


Research and Development
2023.08.02 Wed
Combining satellite observations and numerical simulations to “stochastically” reproduce the land surface water cycle: Global terrestrial hydrological ensemble simulation “TE-Global NEXRA” has released
In recent years, several studies have highlighted an increase in extreme weather events attributed to global warming. In particular, changes in the Earth’s water cycle, such as floods and droughts, greatly affect our daily lives. To adopt to these changes and build a safe society, precise risk assessments based on high-fidelity computer simulations are imperative. However, just as we recognize that even with today’s remarkable improvements in accuracy, daily weather forecasts are not always perfect, a computer-generated Earth will always contain uncertainty.
To overcome these issues, JAXA is promoting research and development aimed at improving the accuracy of simulations that reproduce the Earth’s dynamics and at providing easily comprehensive risk information. In the process, the integration of satellite and other observation data with numerical simulations is important to maximize their effectiveness. Therefore, JAXA conducts joint research with various universities and research institutes that have expertise in numerical simulation and observational data applications. In this article, we will introduce two simulation systems developed so far, “NEXRA” and “TE-Global”, and a newly developed system that combines these two systems, “TE-Global NEXRA”.
Integration of “NEXRA (atmosphere)” and “TE-Global (terrestrial water cycle) ”
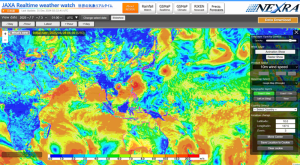
NEXRA (NICAM-LETKF JAXA Research Analysis) is a system that combines Global Satellite Mapping of Precipitation (GSMaP) and other observation data into a numerical weather model using a technique known as data assimilation. The system provides weather forecasts up to five days in advance and publishes key variables representing atmospheric conditions, such as precipitation and wind speed, on its website. An additional benefit of NEXRA’s data assimilation is its ability to effectively incorporate errors in both observations and numerical models to create ensemble members (multiple possible conditions of the Earth that may exist), each of which is used to make future predictions. This probabilistic approach, as opposed to deterministic forecasting (which yields a single outcome), allows the expression of weather conditions and risk information in terms of probability, generally resulting in accurate forecast outcomes (see detailed article here). JAXA also uses satellite data to simulate not only meteorological (atmospheric) phenomena, but also changes in the water cycle on land, where we live. Today’s Earth – Global (TE-Global) is a system that calculates terrestrial water and energy fluxes in response to changing weather conditions. Estimates of global river and land conditions are available on the website (for more information, see detailed article here).
This time, by using the analysis values of 128 meteorological ensemble members of “NEXRA” as input to the hydrological simulation of “TE-Global”, the global terrestrial hydrological ensemble simulation “TE-Global NEXRA” has been realized, and the data and the web page are now available on a trial basis. TE-Global NEXRA is expected to reduce errors compared to a single-member simulation by averaging the simulation results of each ensemble member, and to allow evaluation of simulation reliability based on the variation among members. This type of global terrestrial ensemble system remains relatively uncommon worldwide, and we intend to further enhance and explore it in the future. Below, you will find some examples of the current capabilities of this system.
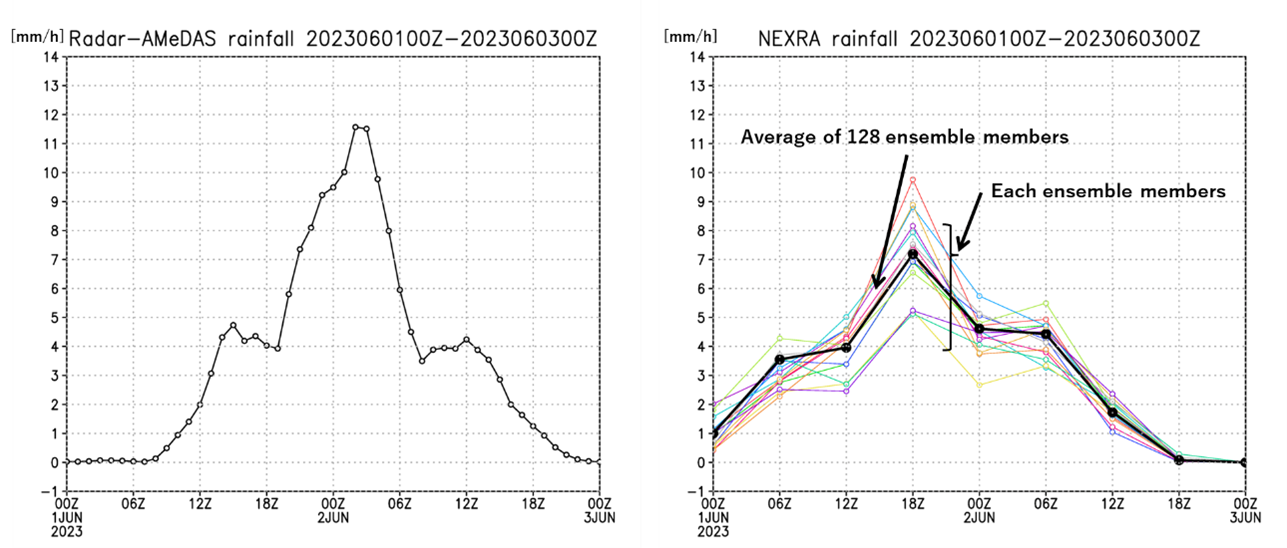
Case 1: Heavy rainfall associated with line-shaped precipitation systems in Japan (June 2023)
In June 2023, the “line-shaped precipitation system”, a series of rainstorms on the Pacific side of western and eastern Japan, caused widespread damage across the country (Observations by the GPM core observatory are here). The government announced on June 27 that it expected the disaster to be classified as a “severe disaster” (reference: Cabinet Office website).
Heavy precipitation was observed over a wide area, including the Shikoku, Kinki, Chubu, and Kanto regions, as indicated by the temporal variation of the JMA’s radar-AMeDAS precipitation observation in Figure 1. To see how NEXRA estimated this rainfall, let’s look at the changes in average precipitation within the black-boxed area in Figure 1, which covers Wakayama to Aichi prefectures that were particularly affected (Figure 2). The averages of the 128 ensemble members and the analyzed precipitation do not capture the peaks and fine scale variations due to the resolution of the NEXRA input to TE-Global, which is 112 km gridded and 6-hourly. However, they still reproduce to some extent the mesoscale phenomena around Japan. Furthermore, the multi-colored lines in the right side of Figure 2 are precipitation amounts for each ensemble member. Whether the values of the 128 ensemble members are close or scattered provides new information. These similarities and differences can be an indication of the confidence in the estimation or the specificity of the phenomenon.
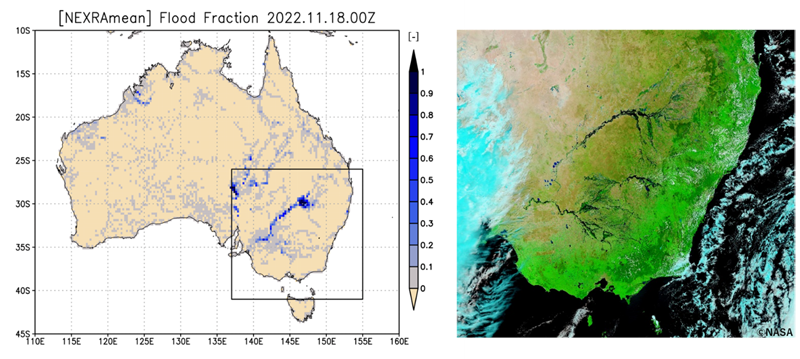
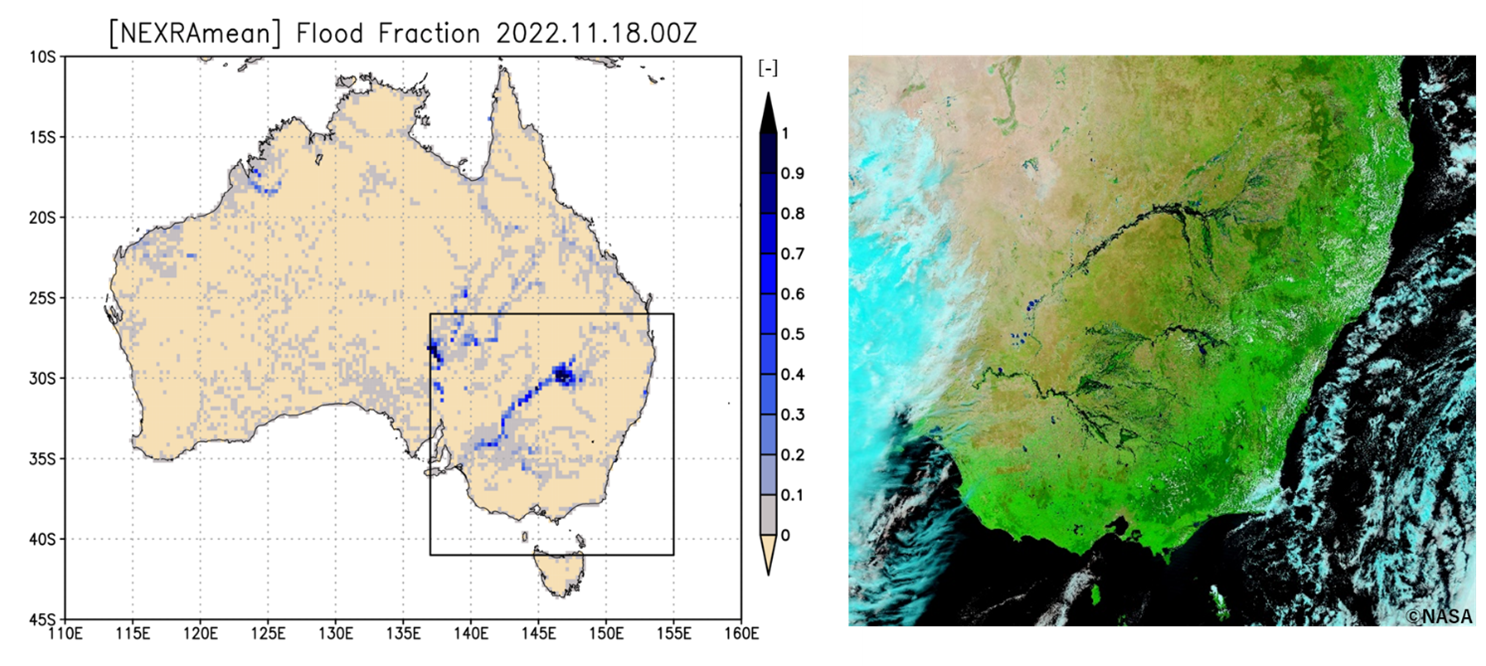
Case 2: The flood in Australia (November 2022)
By using NEXRA ensemble meteorological data, including such precipitation data, as input to TE-Global NEXRA, global terrestrial water circulation can be estimated, taking variations into account. Here, we present a case study of a flood that caused significant damage in Australia in 2022.
Figure 3 right shows flooding in New South Wales (state capital, Sydney) as observed by the MODIS sensor on NASA’s Terra satellite (see detailed article here). In some areas, there were reports of a rainfall amount over four days that was equivalent to approximately eight months’ worth of normal rainfall. This led to extensive and severe flooding. In the figure, the flood area shown in black around the center of the figure is widely distributed. Figure 3 left shows the distribution of flooded area fraction within the model grid (ensemble averages) across Australia as estimated by TE-Global NEXRA at the same time as the satellite observations on the right. The black box corresponds to the observation area shown on the right, and the results are consistent with the flood area observed over a wide area.
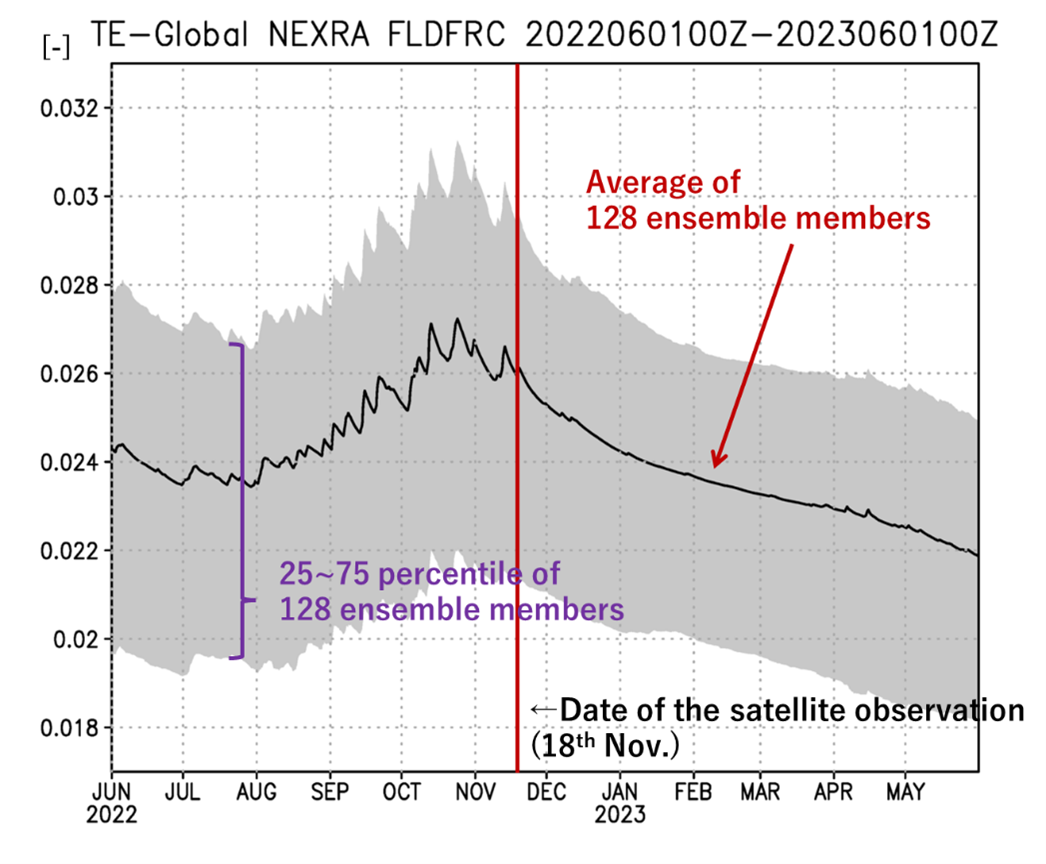
Figure 4 shows the temporal variation of the average percentage of inundated area in the same area, which shows a sharp increase in values from September to November. In Earth-orbiting satellite observations, it takes a fixed number of days (recurrence days) to observe the same location again. One advantage of numerical model simulations is that they can capture such changes by providing spatiotemporally continuous information. The gray bands drawn in the figure show the 25th-75th percentile values obtained from the estimates of each ensemble member, as shown on the right side of Figure 2, and provide an idea of the temporal trends, including simulation variability, regarding the estimated inundation. Some of the functions for drawing such time series graphs are also implemented in the display interface of the public web pages, making them easy for anyone to use.
Toward more advanced risk information
TE-Global NEXRA is a system that allows the monitoring of various physical quantities related to water on land, taking into account the variability of the simulation. By obtaining the average of physical quantities estimated from 128 ensemble members of the input NEXRA data, the error is reduced compared to single member simulations, and in addition, the confidence in the simulation can be estimated from the variation among the members. Currently, the system operates with a delay of several days from real time, but we plan to make further improvements so that future risk information can be expressed with confidence by performing ensemble forecasting based on this system. JAXA will continue research and development in cooperation with universities and other collaborative research institutions to provide more advanced risk information through the fusion of satellite observation data and numerical models.
Search by Year
Search by Categories


Tags
-
#Earthquake
-
#Land
-
#Satellite Data
-
#Aerosol
-
#Public Health
-
#GCOM-C
-
#Sea
-
#Atmosphere
-
#Ice
-
#Today's Earth
-
#Flood
-
#Water Cycle
-
#AW3D
-
#G-Portal
-
#EarthCARE
-
#Volcano
-
#Agriculture
-
#Himawari
-
#GHG
-
#GPM
-
#GOSAT
-
#Simulation
-
#GCOM-W
-
#Drought
-
#Fire
-
#Forest
-
#Cooperation
-
#Precipitation
-
#Typhoon
-
#DPR
-
#NEXRA
-
#ALOS
-
#GSMaP
-
#Climate Change
-
#Carbon Cycle
-
#API
-
#Humanities Sociology
-
#AMSR
-
#Land Use Land Cover
-
#Environmental issues
-
#Quick Report
-
#GOSAT-GW
Related Resources


Research and Development Related Articles
-
 Research and Development 2026.03.09 Mon High-Resolution Predictions of Global Terrestrial Water Cycle:
Today’s Earth – Global Updated -
 Research and Development 2025.06.18 Wed Advancing Space-Based Weather Analysis and Forecasting – Renewal of JAXA’s Realtime Weather Watch ‘NEXRA3’ and Performance Evaluation with the previous system (Overview Article)
 -
 Research and Development 2025.03.27 Thu Launch of Ocean Weather Forecasts 1km resolution
 -
 Research and Development 2024.05.27 Mon The Use of Earth Observation Satellite Data in the Humanities and Social Sciences (3)
Stay Connected
