


Introduction of data download websites
Here are some of the major websites where you can get data from Earth observation satellites, including JAXA’s satellites.
Major download websites
JAXA’s website
(Globe Portal System)
G-Portal is to search and download data acquired by JAXA’s Earth observation satellites
Format: HDF etc.
Satellites: GCOM-C, GCOM-W
Aqua, GPM etc.
※Some data are search function only
JAXA’s website
(JAXA Satellite Monitoring for Environmental Studies)
JASMES can display MODIS data and SGLI data on a website screen.
Format: netCDF,binary format etc.
Satellites:GCOM-C, GCOM-W,
MODIS, Aqua etc.
JAXA’s website
(Global Satellite Mapping of Precipitation)
GSMaP provides global precipitation maps using various satellite data.
Format: binary, csv format
Satellites: GPM Core Observatory +
precipitation observation satellites
and meteorological satellite
Here are some more details about the website operated by JAXA.
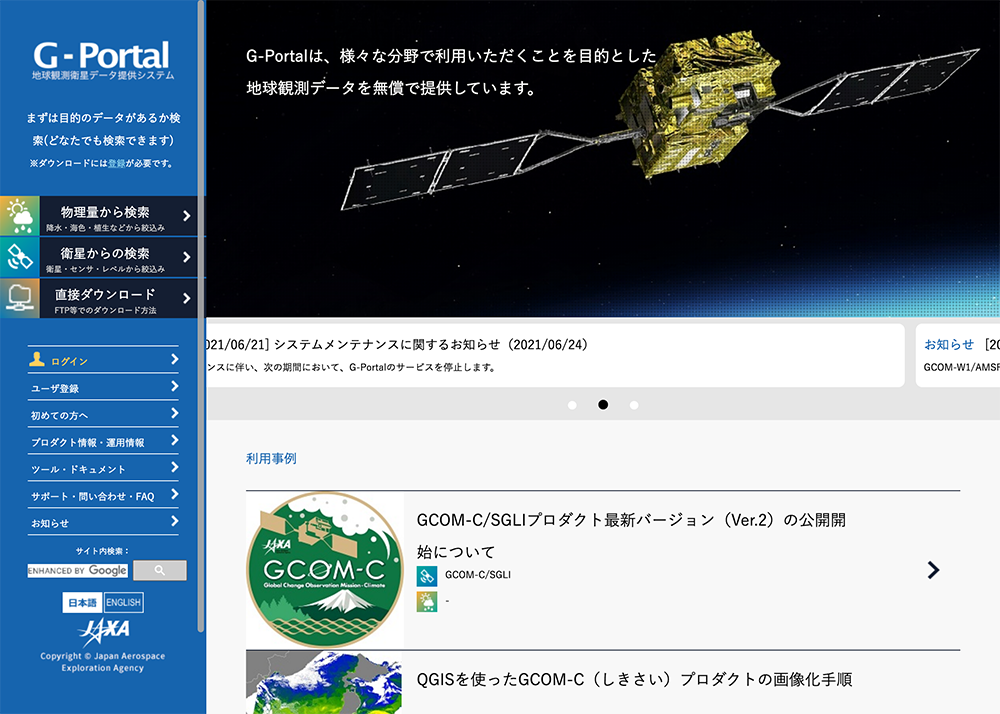
G-Portal
You can search data obtained by JAXA’s Earth observation satellites (satellite/sensor search, geophysical quantity search), and receive data provision service.
<Major contents>
・Search by geophysical quantities: Narrow down data by geophysical quantity, such as precipitation, sea color, vegetation, etc.
・Search by satellites: Narrow down data by satellite unit, such as satellite, sensor, processing level, etc.
・Product and operation information: Product descriptions for each satellite and information on satellite operations.
・Tools and documents: Handbook and analysis tools for each satellite.
| 💡Highly recommended for: ・People who want to search JAXA’s Earth observation satellite data by geophysical quantity or satellite/sensor information ・People who want to download data from FTP etc |
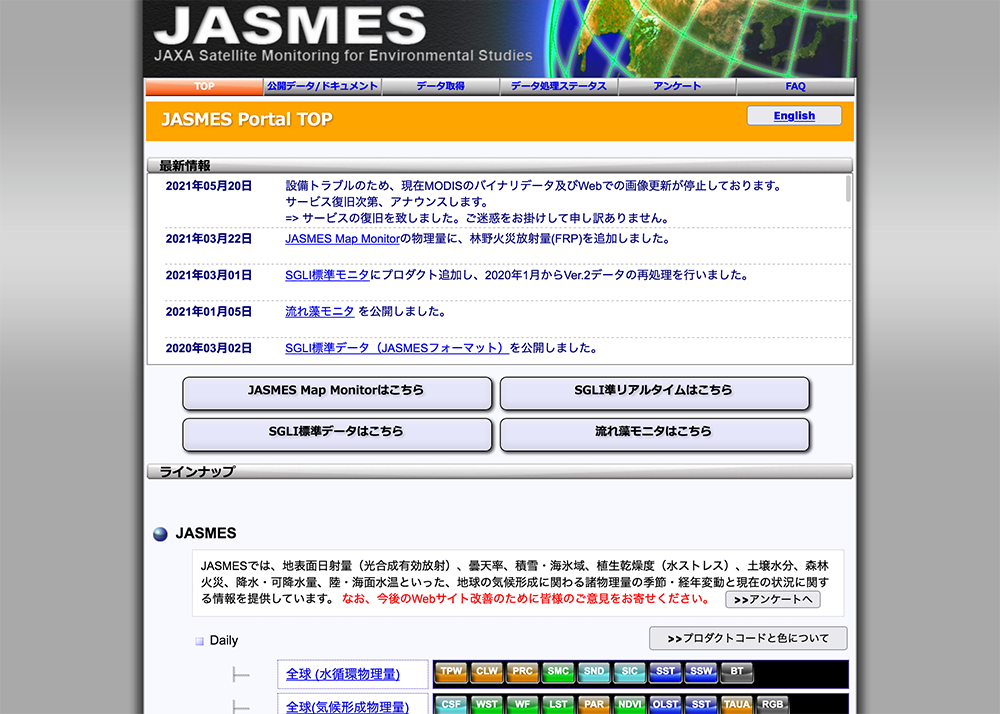
JASMES
You can download data from MODIS (sensors onboard NASA’s satellites Terra and Aqua) and SGLI (sensor onboard JAXA’s satellite GCOM-C) (). This site is mainly a map display and a monitor display for easy viewing of time series changes, and focuses on annual variation and real-time monitoring of physical quantities related to global climate changes. () Map projected data can be downloaded from the FTP site. Currently, you can download only limited areas in Japan and global regions.
<Major contents>
・JASMES Map Monitor: Provide information on seasonal and annual variations of physical quantities related to the climate formation on the Earth and their latest status.
・SGLI Standard Data Monitor: Provide the standard data of the area around Japan from the “Second generation GLobal Imager(SGLI)”, an optical sensor onboard the Global Change Observation Mission “SHIKISAI” (GCOM-C). SGLI standard products (HDF5 format) is converted to netCDF4 format resampled on the JASMES grid.
・SGLI Near-realtime Monitor: Release the near-realtime observation data of the area around Japan from the SGLI, an optical sensor onboard the Global Change Observation Mission “SHIKISAI” (GCOM-C). The data is projected onto a map in equal latitudes and longitudes.
・FAI Monitor: Release the Floating Algae Index (FAI) and three-band RGB images of the upper atmosphere brightness observed by SGLI, an optical sensor onboard the Global Change Observation Mission “SHIKISAI” (GCOM-C).
| 💡Highly recommended for: ・People who want to use MODIS or SGLI data. ・People who want to view the observation data as images on the web without downloading. |
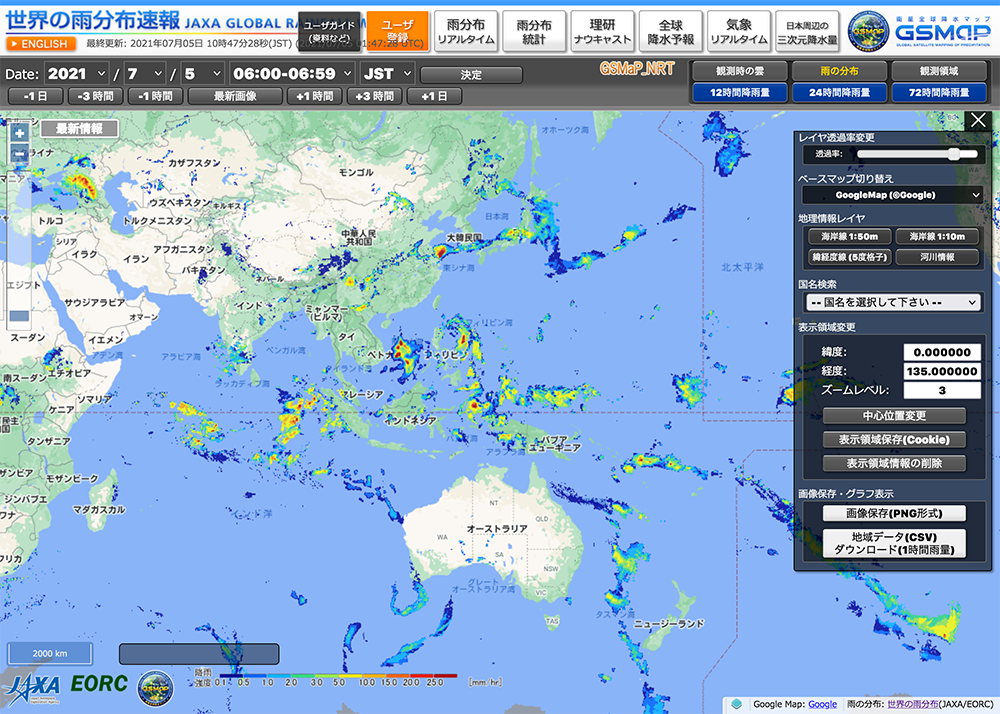
GSMaP
Global Satellite Mapping of Precipitation (GSMaP) is a global rainfall map developed under the Global Precipitation Measurement (GPM) mission by combining multiple precipitation observation satellites and geostationary meteorological satellites, mainly the Dual-frequency Precipitation Radar (DPR) onboard the GPM Core Observatory. You can view hourly global rainfall information.
The main feature of the GSMaP algorithm is utilization of various attributes derived from the spaceborne precipitation radar, TRMM/PR and GPM/DPR.
Specifically, in the field of disaster prevention, GSMaP is used for flood forecasting and warning systems in areas where ground observation data is insufficient. Also, in the agricultural sector, GSMaP is being applied to drought monitoring systems and weather information services.
For specific examples, please see here.
<Major contents>
・GSMaP Realtime: You can see real-time global precipitation map, updated every 30 minutes.
・Rainfall Watch: You can see global precipitation map in the past specific date up to 4 hours in advance.
・GSMaP Climate: You can see indices related to drought compared to precipitation in the past 20 years and extreme heavy rainfall.
| 💡Highly recommended for: ・People who are interested in global precipitation. ・People who are interested in monitoring heavy rainfall and drought. |
We also have a list of links to other sites which you can download data. Please refer to here.


Stay Connected
