


Flow of satellite data analysis
The following is an example of the work flow for analyzing satellite data.
Learn about Earth observation satellite data
To start data analysis, knowing “what and how Earth observation satellites are observing” and “what Earth observation satellite data is used for” will help you plan a more specific analysis process and interpret the analysis results.
Organize the purpose of the analysis.
The first step in satellite data analysis is to organize the elements of information that you want to obtain from analyzed satellite data. The elements are listed below.
- Is the target the entire globe or just Japan? If the target area is too large, the amount of data may become huge depending on the spatial resolution of the data, and the time required for analysis may increase.
- Is the target information at present, in the past, or changes and averages from the past to the present? If you need to obtain information older than the period for which the satellite data exists, you may need to look for other sources of information, such as ground-based observations.
- Physical quantities such as surface temperature, soil moisture, sea surface temperature, and precipitation, as well as information such as the extent of flooding caused by heavy rain, the area of forest loss, land subsidence in urban areas, and the area of urban expansion.
- The spatial resolution (ground resolution) required based on the spatial scale of the phenomenon or information to be captured. The higher the spatial resolution, the more spatially detailed information you can obtain. But the larger the data size, the more time it may take to analyze it. In addition, high-resolution satellite data is often available for a fee.
- The temporal resolution (observation frequency) required based on the time scale of the phenomenon or information to be captured. The higher the temporal resolution, the higher the probability of obtaining detailed time-varying information, and in the case of optical observations, the higher the probability of obtaining data without cloud cover. But depending on the length of the target period, the amount of data to be collected may increase and the time required for analysis may increase.
Find satellite data/Decide analysis method
The next step is to find satellite data for analysis based on the information organized in step 1. Satellite data is mainly distributed by organizations that operate Earth observation satellites through data search systems, etc. You can search and download JAXA’s Earth observation satellite data from the G-Portal.
It is also necessary to select an analysis method according to the satellite data you found. In general, you can either program your own analysis programs or use analysis tools such as software (applications) that can be operated with a Graphical User Interface (GUI). There are various types of analysis tools available in the public domain, including those that support a wide range of data and those that specialize in specific satellite data.
Obtain Satellite Data
When you find satellite data that meets your needs, you can download the data from the data search system. You often need to create an account to download data from the data search system, including G-Portal. Some data search systems, even free ones, take a certain time to ready for download data after an order is placed.
Read satellite data
Once the data has been downloaded, the next step is to load the data using a self-made program or analysis tool. When creating your own program, it is common to use an existing program (library) to handle the satellite data format.
Transform the coordinate system of satellite data
Most of the satellite observation data of the three-dimensional surface of the Earth are displayed as two-dimensional images with positional information by using the map projection method. In the case of analysis that compares data from different earth observation satellites, ground observation data, or Geographic Information System (GIS) data, it is necessary to match the geodetic system that serves as the reference for location information expressed in latitude and longitude (geographic coordinate system) or the map projection method that sets the location information of the data (projected coordinate system) between the data.
- System consisting of an earth ellipsoid (ex. GRS80 ellipsoid), which serves as a reference plane for position and height, and a coordinate system (ex. ITRF94), which defines the origin of latitude and longitude and datum azimuth. Typical geodetic systems include the Japan Geodetic Datum 2011 (JGD2011) and the World Geodetic System 1984 (WGS84).
- Method to transfer a figure on a rotating ellipsoid surface or sphere to a plane. The following projection methods are used for displaying satellite data and analysis results, as well as GIS.
-
Projection method Overview Example Mercator/Cylindrical map projection A map projection of the Earth onto a cylinder using the normal axis method. The angle between two points is correctly represented. High latitudes are represented larger than the actual area due to distortion. 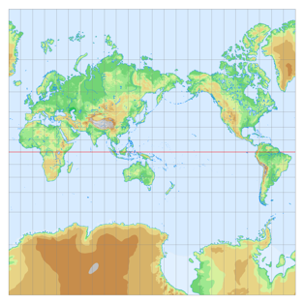
Source:Map image material collection for learning map projection method
Universal Transverse Mercator: UTM Using the central longitude of each longitude zone divided by 6°from 180° West to 180°East as the reference meridian, each longitude zone from 80 degrees south latitude to 84 degrees north latitude is projected on a cylinder using the horizontal axis method, and the polar regions are projected using the universal polar center projection method. Equirectangular Projection The earth is projected onto a cylinder to correctly represent distances on the standard latitude line. The latitudinal and longitudinal lines are represented as a square network (perpendicular and equally spaced). 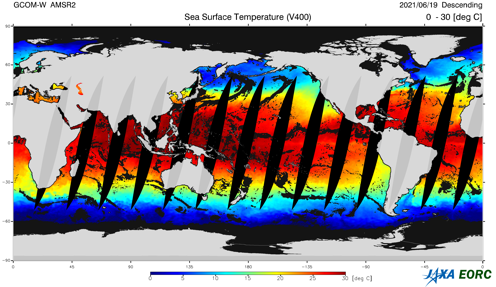
Mollweide projection The equal-area projection which correctly represents the area ratio on a map. The latitude lines are horizontal straight lines, and the standard longitude line is a vertical line and the other longitude lines are arcuate curves. 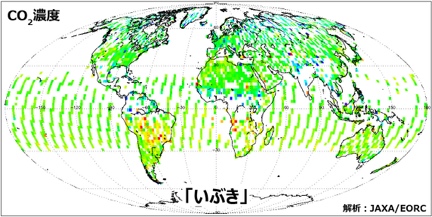
Sinusoidal projection The equal-area projection which correctly represents the area ratio on a map. The latitude lines are horizontal straight lines, and longitude lines are sine curve. 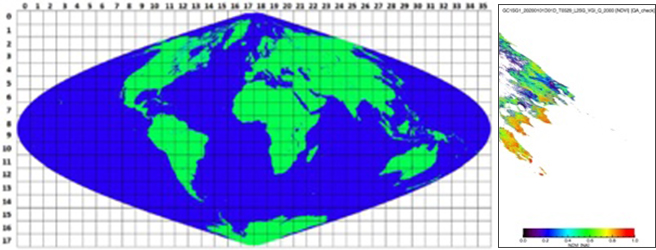
Polar stereographic projection A method in which a plane is placed tangent to the poles of the earth, and a straight line is connected a point on the earth with a viewpoint placed at the pole not tangent to the plane, and intersect points of the line and the plane are projected. The angle between two points is correctly represented. 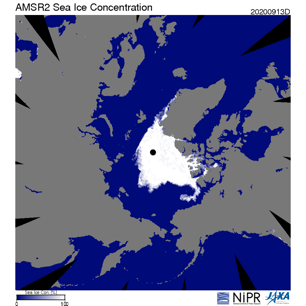
Analysis tools and geographic data libraries (ex. GDAL) are often used to transform these coordinate systems.
Process the analysis according to the purpose
Once the data has been read in and the necessary coordinate transformation and other processing has been done, you can perform the processing according to the purpose using programming and analysis tools. The followings are examples of analysis processing.
- The image processing to extract information from image data that has not been converted into physical or other quantities. Major processes include image enhancement (density conversion, color composition, histogram conversion), inter-image operations to extract various features (spectral features), filtering (geometric features), and texture analysis (texture features).
- The classification is to assign a classification class to each pixel or collection of pixels with similar features in order to distinguish between objects in image data. There are various classification methods (e.g., clustering, multilevel slicing, decision trees, minimum distance classification, maximum likelihood classification, use of expert systems, use of neural networks, etc.), and it is important to select an appropriate method according to the satellite data/supervisor data and classification class.
- In order to obtain temporal characteristics of geophysical quantities (e.g., mean, maximum, minimum, difference from the mean, etc.), multiple data from different time periods are used for analysis. By color composite using image data from different time periods, it is possible to capture changes in the ground surface (ex. deforestation, flood extent, etc.) from even optical and radar images that have not been converted to geophysical quantities.
- In addition to the characteristics extraction process in the image processing, GIS data and other data are used to analyze physical quantities and classification results in order to obtain characteristics in the spatial direction (ex. average value in a specific area, percentage of each classification class in a specific area, etc.).
- Information on height direction can be obtained by specific observation methods, such as the creation of Digital Elevation Model (DEM) using stereo imaging data (stereoscopic image), and the measurement of elevation and ground surface deformation using Interferometric SAR (InSAR) analysis of Synthetic Aperture Radar (SAR) data.
Output the results
Output the results of the analysis process, such as image data and graphs, in the form of images, text, etc.
You can find analysis results and explanations of various satellite data in this page. Some of the data generated by the analysis based on the standard products distributed in G-Portal are also available as research products on the EORC Research Group website.
Supplementary Information
Satellite data analysis requires a computing environment (e.g., personal computer, workstation, cloud server, etc.) with sufficient memory and computing power to handle satellite data, but there are tools and services that can perform the processes in 3.-7.


Stay Connected
