


Research and Development
2024.03.06 Wed
High sea surface temperatures in the Sea of Japan in relation to Typhoon No. 7, the only typhoon to hit Japan in 2023
Every year from summer to fall, typhoons form off the southern coast of Japan, approaching and making landfall in Japan. In recent years, sea surface temperature (SST) has been increasing due to global warming, which is expected to result in stronger winds and more intense rainfall associated with typhoons. According to the announcement of the Japan Meteorological Agency, SSTs in the seas surrounding Japan during August 2023 were significantly higher than usual. Record highs were observed in both the northern and southern Sea of Japan (reference “Sea Surface Temperature Rise and El Niño Event”).
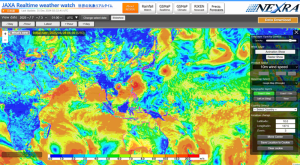
In 2023, Japan experienced a lower number of typhoons compared to a typical year and only one typhoon, Typhoon No. 7, made landfall (Japan Meteorological Agency, Summary of Typhoon 2023). However, after making landfall near the Kii Peninsula and Akashi City in mid-August, Typhoon No. 7 brought record rainfall mainly to the Kinki and Chugoku regions. Figure 1 is a Global Satellite Mapping of Precipitation (GSMaP) animation of the temporal changes in surface precipitation from 9:00 JST on August 8, 2023 to 14:00 JST on August 14, 2023. GSMaP calculates the global precipitation distribution using data from the GPM Core Observatory and data from a constellation of satellites (satellites from countries and organizations participating in the GPM project), including AMSR2 onboard the Global Change Observation Mission – Water “SHIZUKU” (GCOM-W). The animation shows that heavy rain is falling over a wide area, mainly in the Kinki region, due to Typhoon No. 7. In addition, because of heavy rainfall accompanied by line-shaped precipitation systems, a heavy rain emergency warning was issued for Tottori Prefecture. We wish to extend our deepest sympathy to all those who have suffered hardship from the damage of the typhoon.
In order to better understand these phenomena, JAXA is integrating satellite and other Earth observation data with numerical simulations and is conducting research and development in collaboration with external organizations to maximize the best of both. This report introduces the analysis results of the effects of high SSTs in the Sea of Japan on Typhoon No. 7 in 2023, using data from two systems developed as part of this effort: NICAM-LETKF JAXA Research Analysis (NEXRA) (developed in collaboration with the University of Tokyo and RIKEN) and JAXA-RIKEN Ocean Analysis (LORA) (developed in collaboration with RIKEN).
NEXRA daily forecast results: Track and intensity of Typhoon No. 7
Typhoon No. 7, internationally named LAN, formed over Japan’s southern ocean near Minamitori Island (23.9˚N, 149.4˚E) on August 8, 2023. The black line in Figure 2 shows the track of Typhoon No. 7 as reported by the Japan Meteorological Agency. After its formation, the typhoon moved westward with increasing strength and became a very strong typhoon on August 10. The typhoon gradually moved northward and made landfall near Shiomisaki, Wakayama Prefecture, at just before 5:00 a.m. on the 15th (JST) and made landfall again near Akashi City, Hyogo Prefecture, at around 1:00 p.m. on the same day (JST). After crossing the Sea of Japan on the 15th, it retained its typhoon structure and became an extratropical cyclone west of Hokkaido on the 17th.
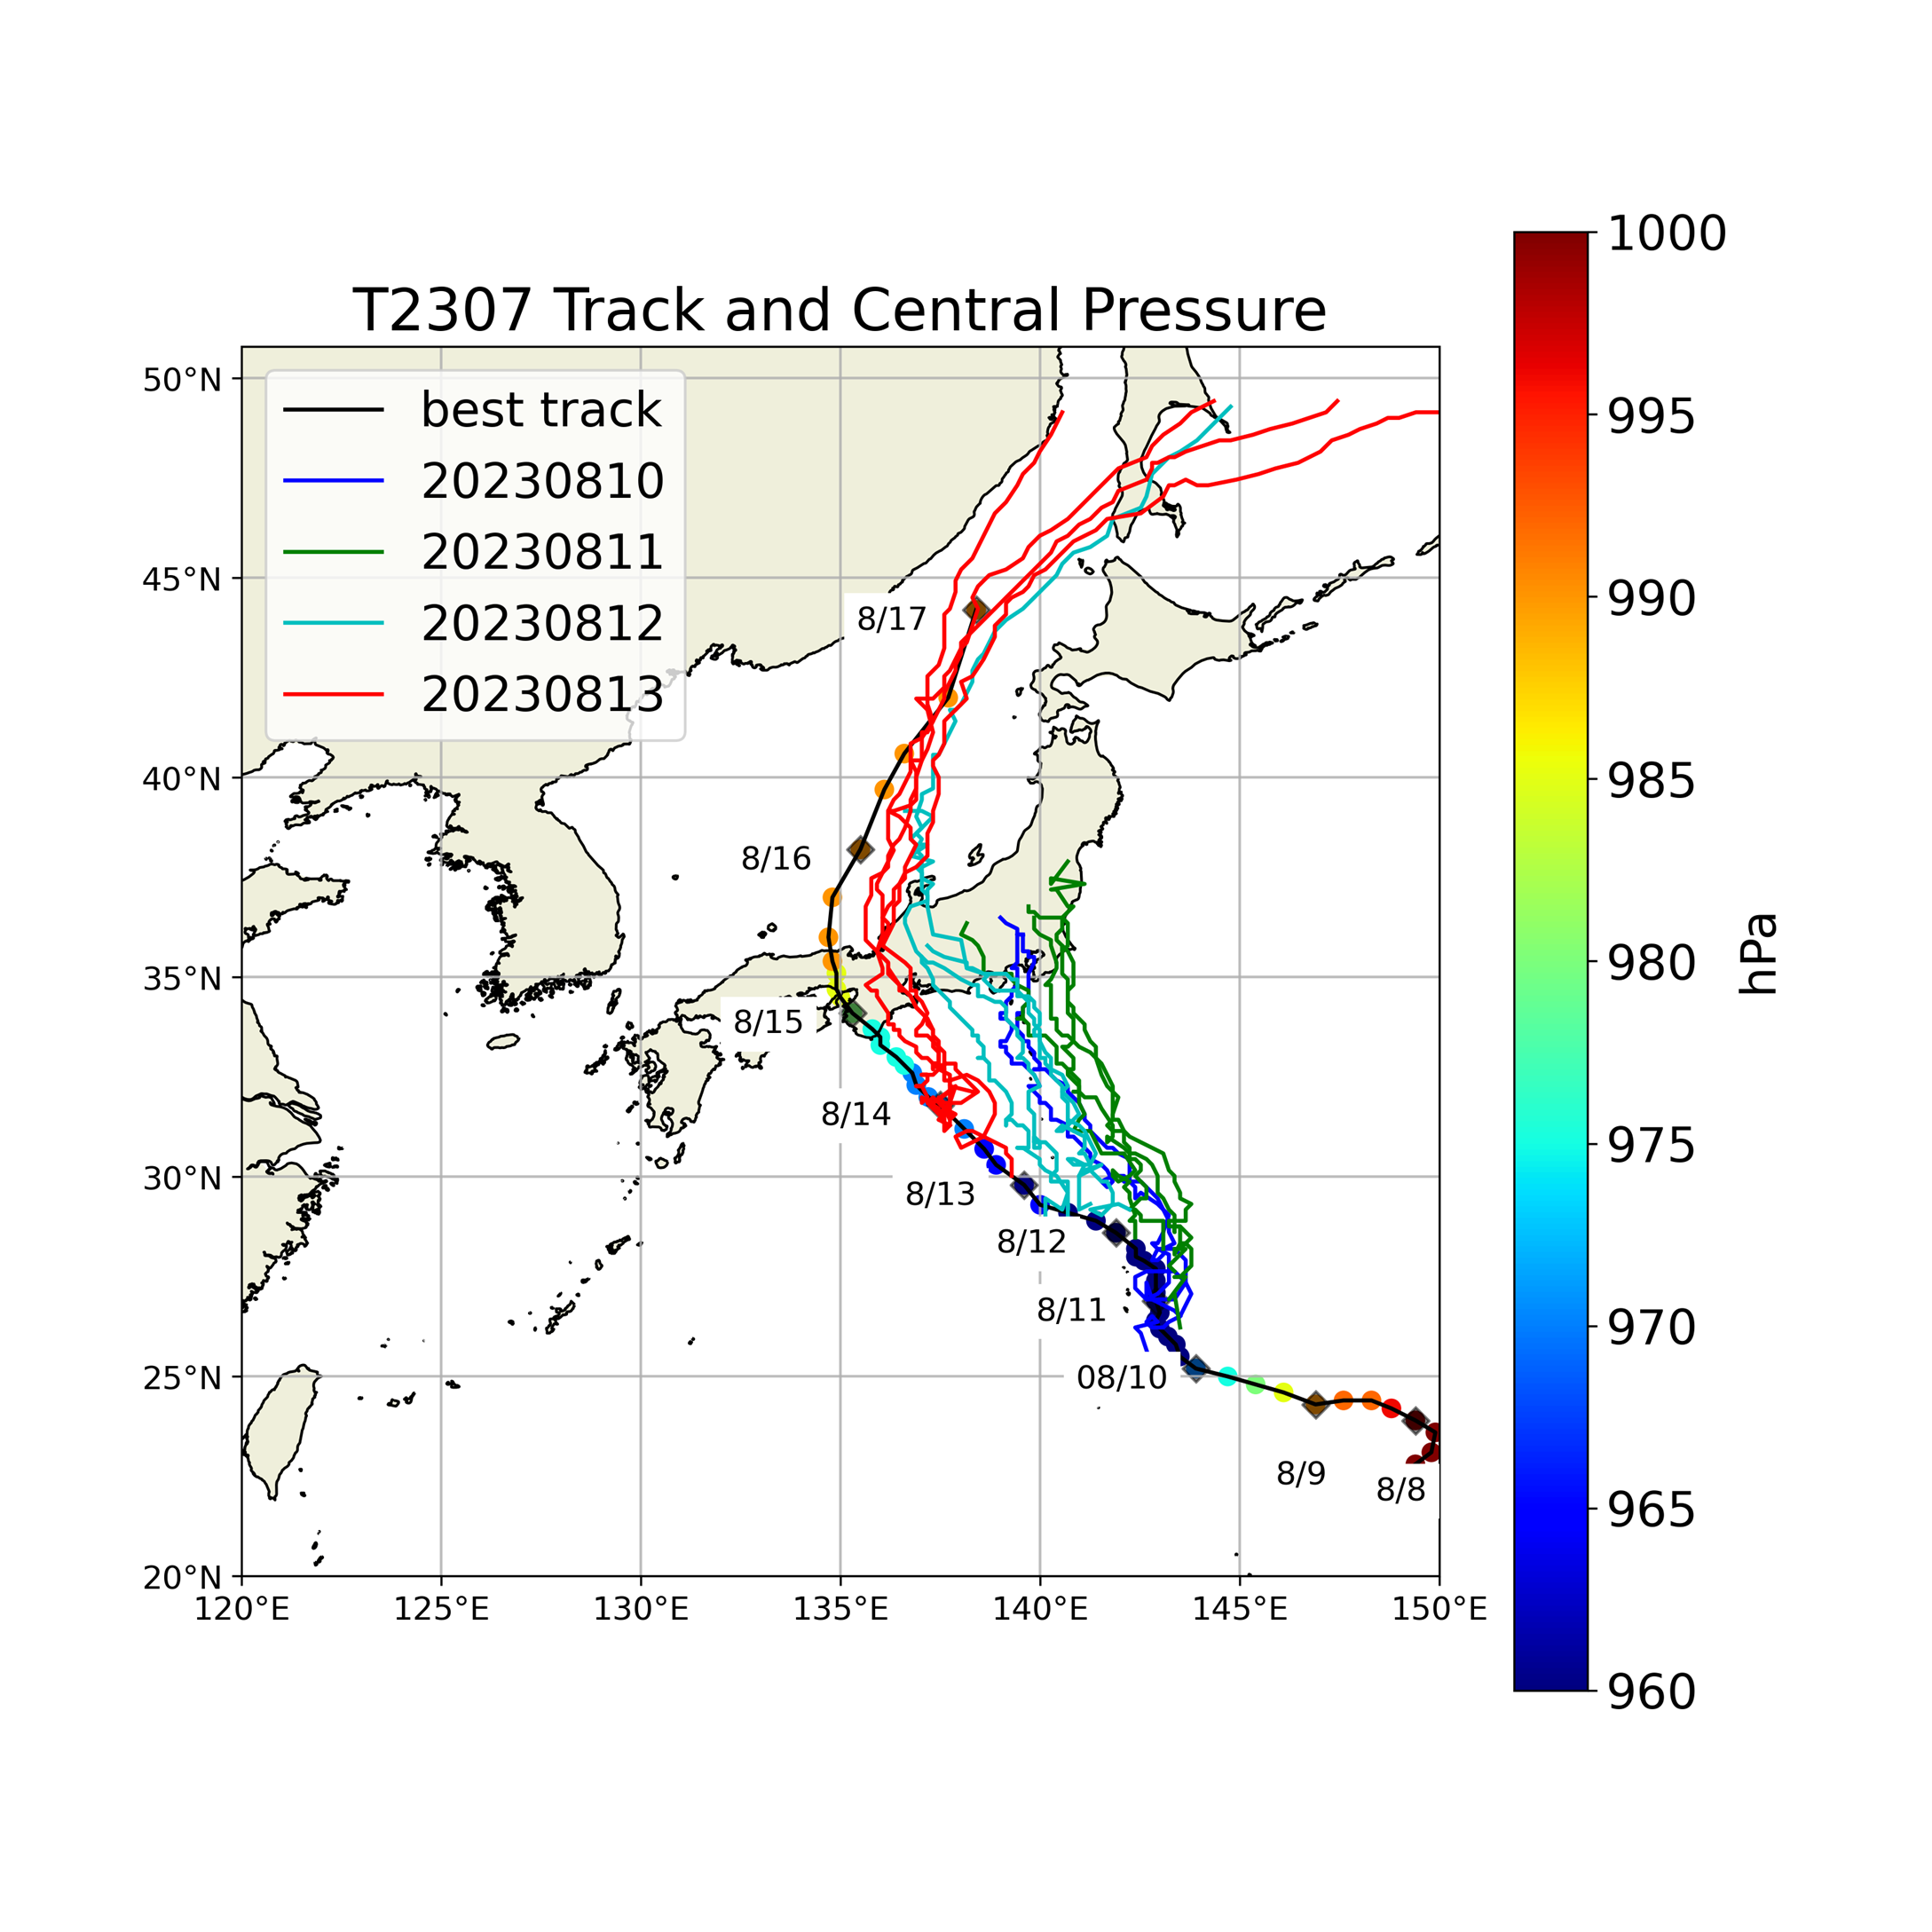
NEXRA conducts atmospheric forecast simulations every six hours, up to five days in advance using NICAM (numerical weather forecast models) on a 14 km horizontal mesh, based on highly accurate initial values generated from numerical simulations and satellite observation data such as GSMaP. The typhoon track forecasted by NEXRA is shown as a colored line overlaying the actual typhoon track (black line) in Figure 2. Simulations with an earlier forecast start time of around August 10 (blue and green lines) forecast the typhoon’s track to move towards the Kanto region, unlike what actually occurred. On the other hand, the simulation with a later forecast start time around August 13 (red line) reproduces the actual typhoon track well. It is thought that the overhang of the Pacific high forecasted by NEXRA was weaker than the actual one in the simulation at the earlier forecast start time, and the track of the typhoon was more northerly. For studies of typhoon tracks, see previous NEXRA reports and research papers using NEXRA (Nakano et al., 2023).
Sea Surface Temperatures (SST) around Japan as seen by various products
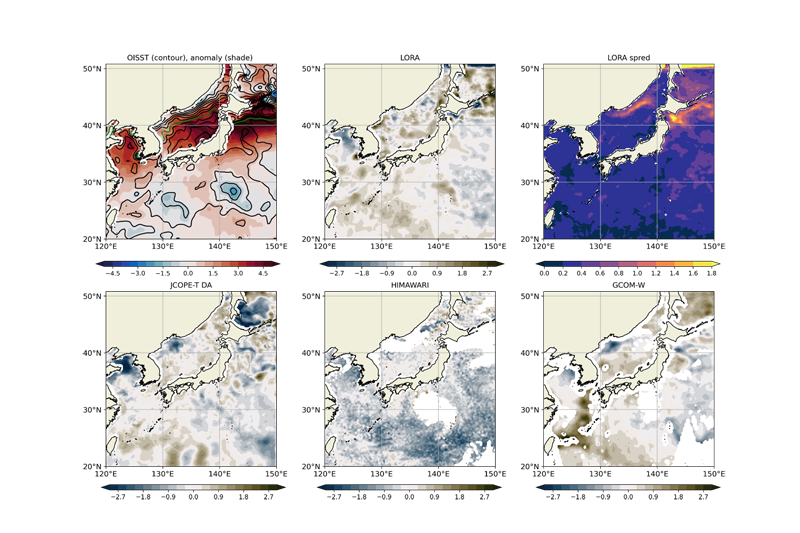
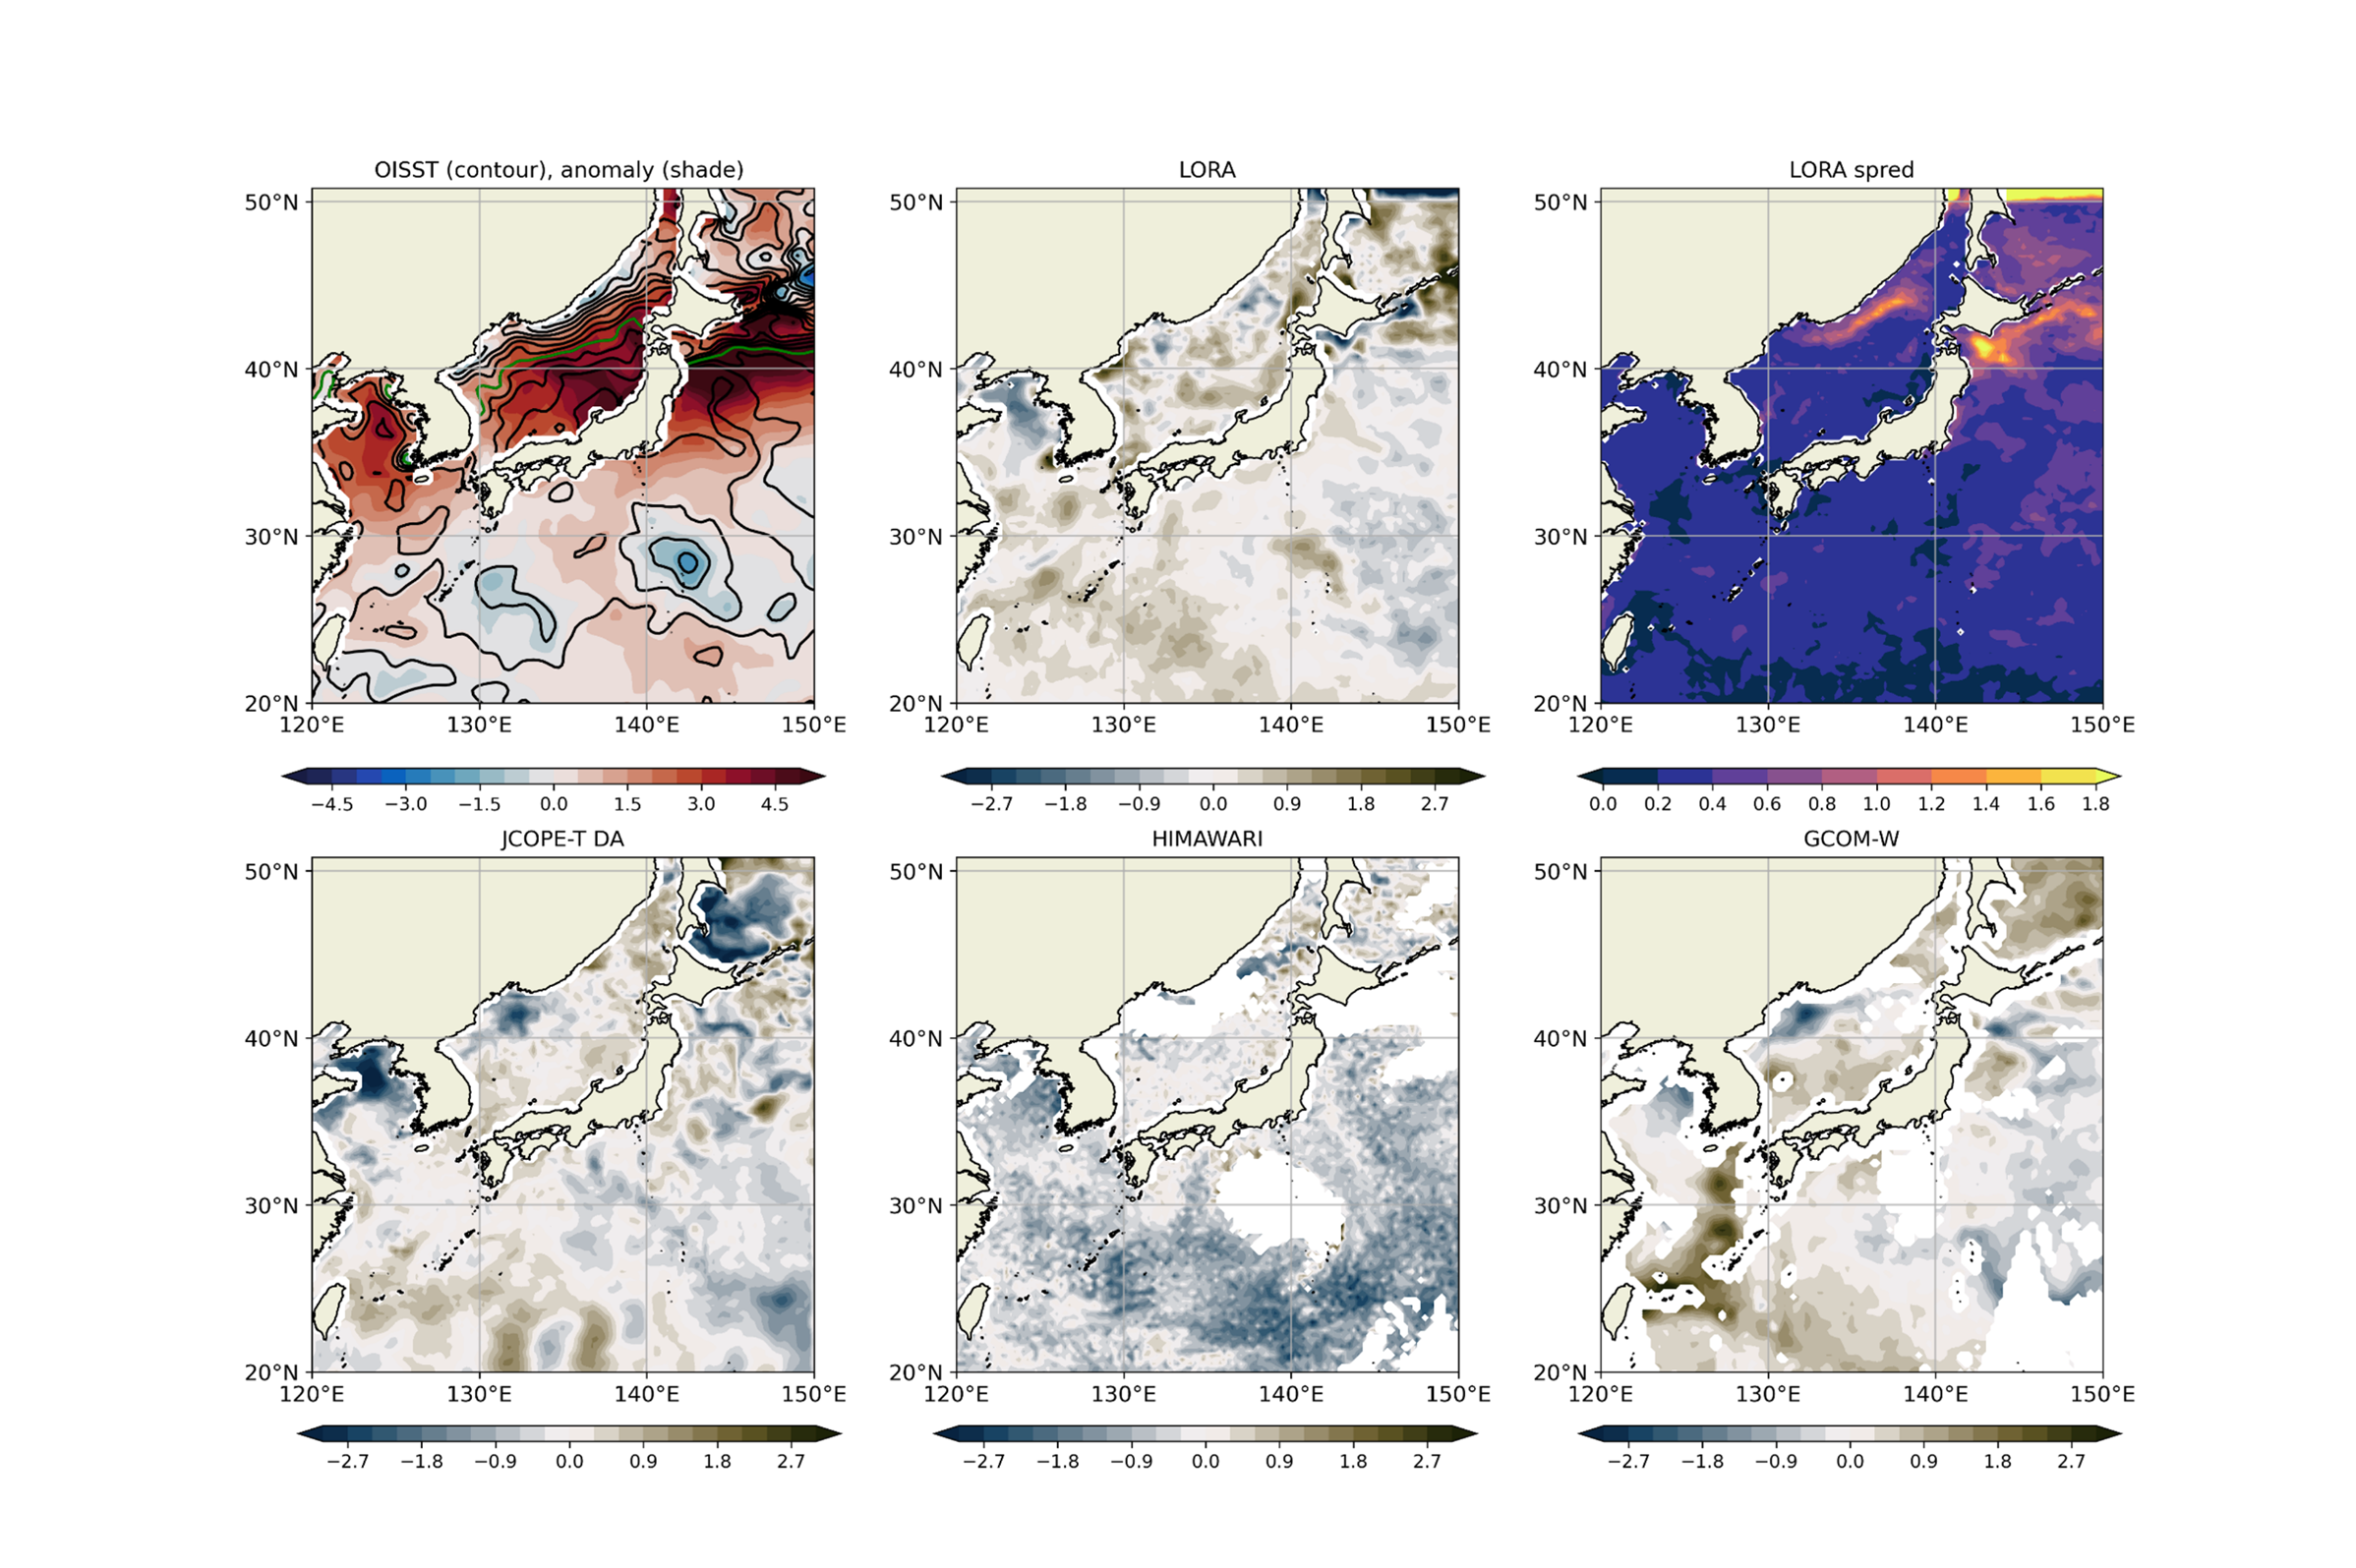
JAXA provides SST data from the Global Change Observation Mission – Water “SHIZUKU” (GCOM-W) and the Himawari satellite to monitor the ocean environment. However, satellite observations can only detect conditions at the ocean surface, and data cannot be obtained in cloudy areas or areas of heavy rainfall. Therefore, by combining these satellite and in-situ observation data with 3D numerical ocean simulations, we have begun to produce and provide high-accuracy 3D ocean analysis products, including undersea area, such as the JAXA-RIKEN Ocean Analysis (LORA) and the JAXA/JAMSTEC Ocean Weather Forecast (JCOPE-TDA). Top left panel of Figure 3 shows the observed SST and its deviation from normal on August 13, before the typhoon made landfall, based on NOAA (National Oceanic and Atmospheric Administration) OISST (Optimum Interpolation Sea Surface Temperature) data. According to the OISST data set, SSTs in the Sea of Japan and off the northeast coast of Japan are up to 5 degrees above normal, a condition that can be described as an ocean heat wave. However, when compared with other SST data shown in the top middle and bottom rows of Figure 3, the trends do not necessarily coincide. This suggests that each product has its own uncertainty due to various factors such as differences in observing instruments/methods, SST estimation methods, and interpolation methods. In fact, there is a maximum difference of about 2 degrees between OISST and each product.
JAXA-RIKEN Ocean Analysis (hereafter referred to as LORA) is characterized by the use of an ensemble data assimilation method that can estimate the uncertainty in this data set itself. Here, “ensemble” refers to a collection of data that are independent of each other, but have slight differences (similar to parallel worlds). LORA has 128 ensembles (each called an ensemble member), and the uncertainty of the data set itself can be estimated by looking at the size of their variation (ensemble spread) (Figure 3, top right). For example, in regions with high variability, such as off the southeastern coast of Hokkaido, there is a 1 degree difference in SSTs among the members of the LORA dataset, indicating significant uncertainty. In the Sea of Japan, which was about 5 degrees higher than normal, the variation was less than 1 degree, and it can be concluded that it seems certain that higher-than-normal SSTs were distributed in the Japan Sea.
Impact of SST in the Japan Sea examined by NEXRA
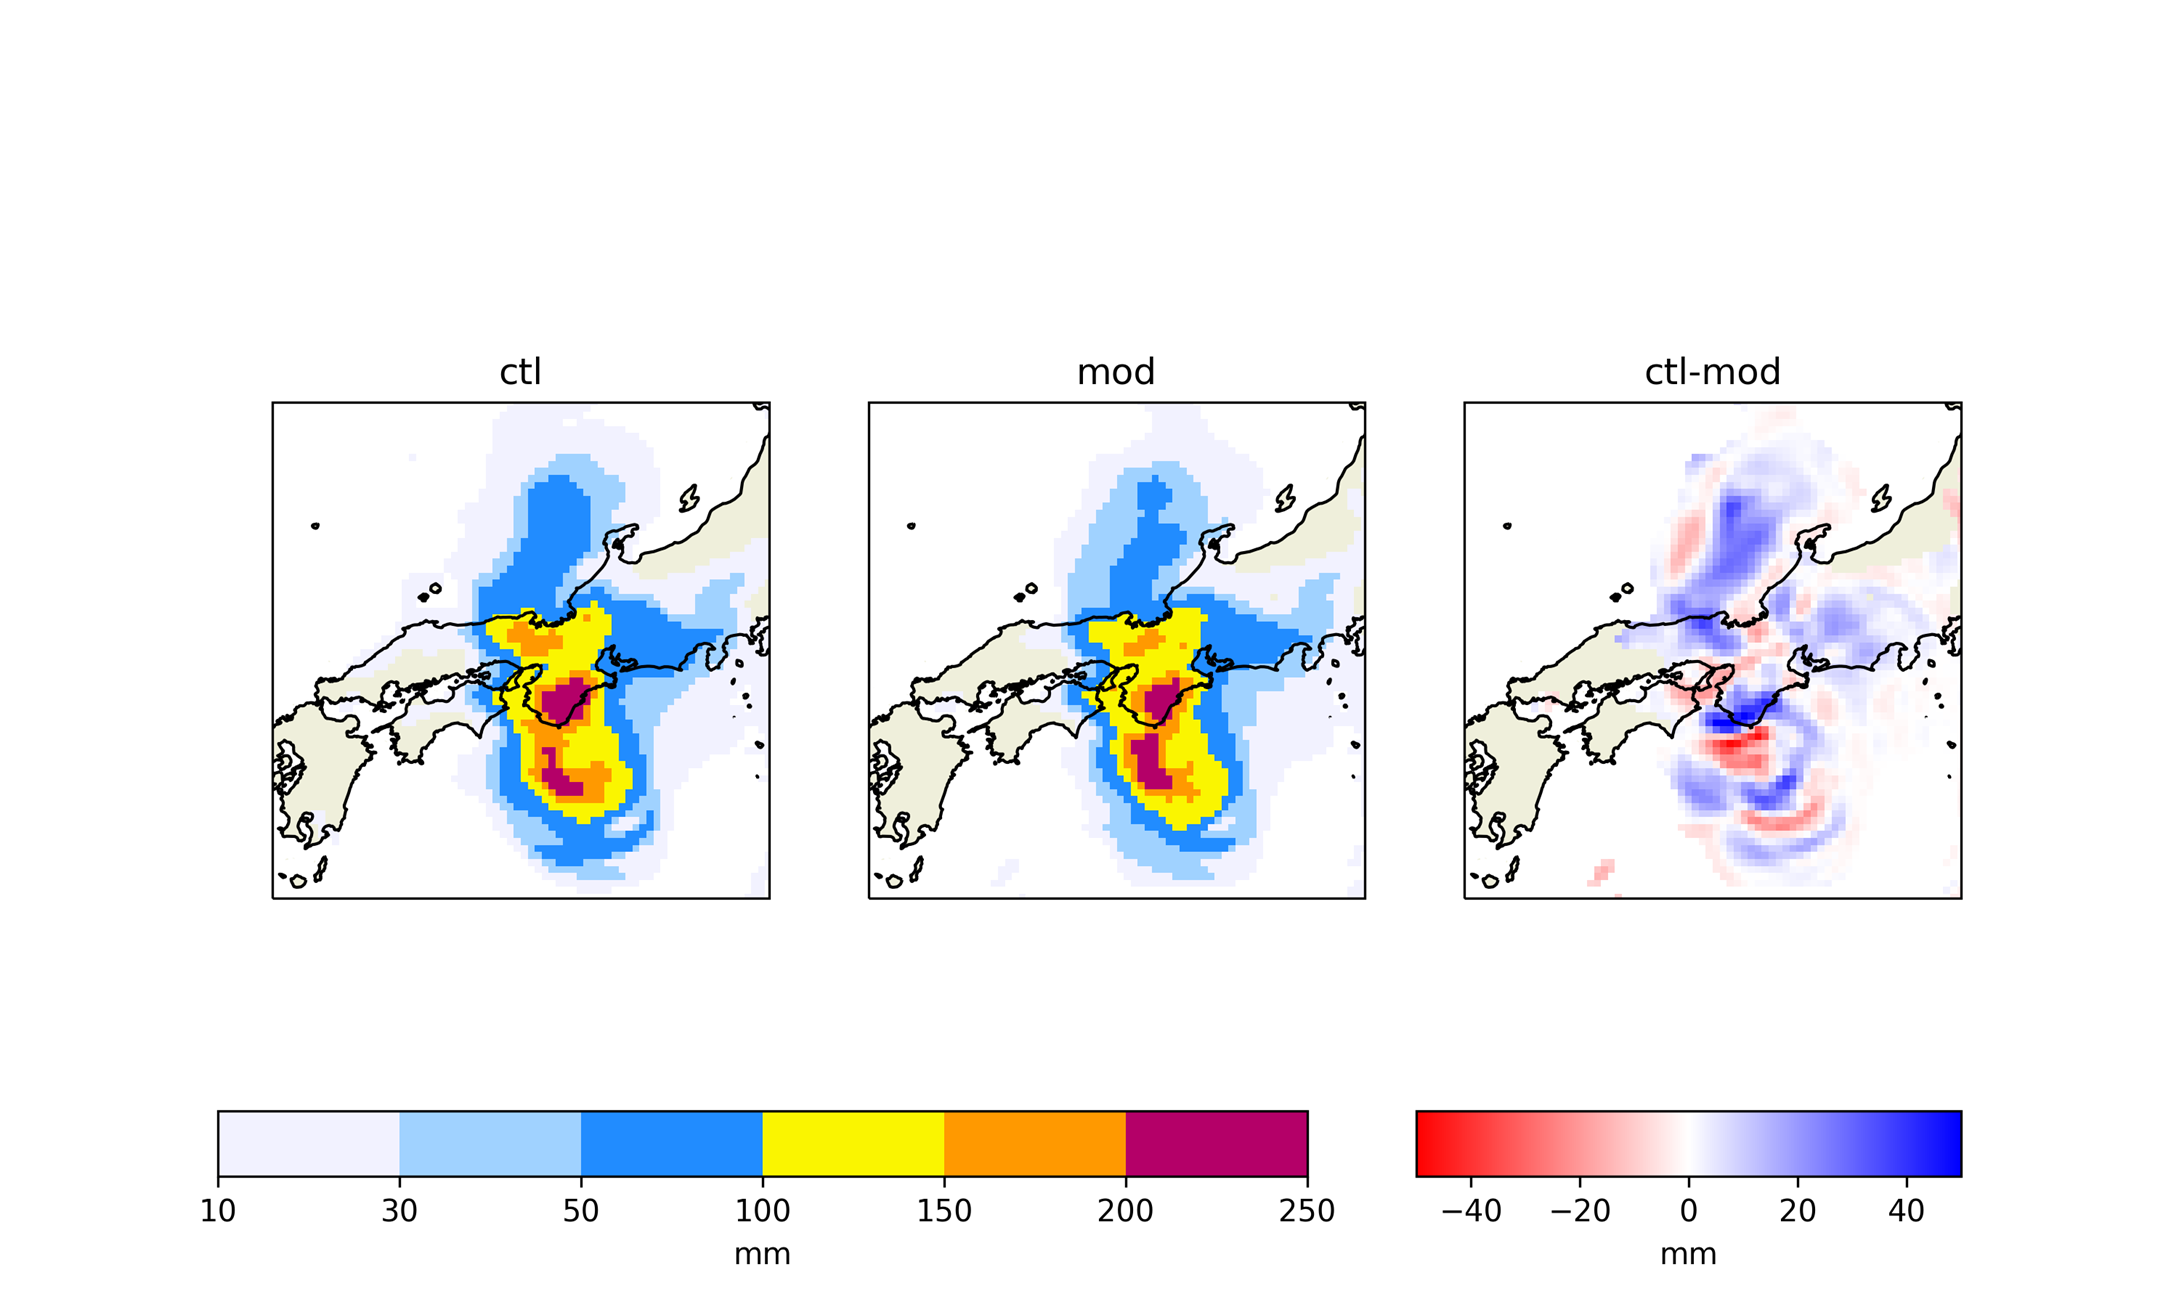
Typhoons derive their energy from the ocean, so they tend to intensify as the SST increases. As mentioned above, on August 13, SSTs in the Sea of Japan and off the Tohoku coast were up to 5 degrees above normal, resulting in an ocean heat wave. To investigate the impact of this ocean heat wave on typhoon, we have specially simulated two patterns of atmospheric forecasting using NEXRA: one with high SSTs in the Japan Sea as observed, and the other with normal. By comparing these results and seeing the differences in forecasted typhoon characteristics, we can examine how high SSTs affect typhoon. As a result, it is evident that high SSTs in the Sea of Japan have an impact on typhoon intensity and water vapor transportation, leading to increased precipitation, particularly on the Sea of Japan side (Figure 4).
For more information on these results, see the article “Effect of significantly higher-than-normal sea surface temperatures in the Sea of Japan for Typhoon No. 7”.
Conclusion
This article examines the impact of SST on typhoon using NEXRA and LORA as an example of research that combines satellite observations and numerical simulations. Through such research, it is possible to obtain four-dimensional information about the Earth that cannot be obtained by satellite alone, taking advantage of the features of satellite observation.
NEXRA plans to improve the data by increasing the horizontal spatial resolution and assimilating new observations from future satellites, such as EarthCARE. Integrating new advanced satellite observation information into simulation models can lead to more precise estimation of atmospheric conditions. This is expected to improve the understanding and accuracy of weather phenomena forecasting, such as typhoons. Keep an eye on the future progress of NEXRA, LORA, and other research and development projects that integrate satellite observations and numerical simulations.
This report was jointly prepared by Dr. Shuhei Matsugishi (project researcher), Prof. Masaki Satoh, Atmosphere and Ocean Research Institute, the University of Tokyo, Dr. Shun Ohishi (researcher), RIKEN, and members of the Earth Observation Research Center (EORC).
Related Sites
- NICAM-LETKF JAXA Research Analysis (NEXRA)
Weather information system jointly developed by JAXA, RIKEN and the University of Tokyo. With the upgrade of JAXA’s supercomputer in FY2021, NEXRA was able to provide weather information at a higher resolution.
https://www.eorc.jaxa.jp/theme/NEXRA/index_e.htm - JAXA-RIKEN Ocean Analysis (LORA)
Ensemble ocean analysis products jointly developed by JAXA and RIKEN. The data was made available to the public in March 2023.
https://www.eorc.jaxa.jp/ptree/LORA/index.html
Search by Year
Search by Categories


Tags
-
#Earthquake
-
#Land
-
#Satellite Data
-
#Aerosol
-
#Public Health
-
#GCOM-C
-
#Sea
-
#Atmosphere
-
#Ice
-
#Today's Earth
-
#Flood
-
#Water Cycle
-
#AW3D
-
#G-Portal
-
#EarthCARE
-
#Volcano
-
#Agriculture
-
#Himawari
-
#GHG
-
#GPM
-
#GOSAT
-
#Simulation
-
#GCOM-W
-
#Drought
-
#Fire
-
#Forest
-
#Cooperation
-
#Precipitation
-
#Typhoon
-
#DPR
-
#NEXRA
-
#ALOS
-
#GSMaP
-
#Climate Change
-
#Carbon Cycle
-
#API
-
#Humanities Sociology
-
#AMSR
-
#Land Use Land Cover
-
#Environmental issues
-
#Quick Report
-
#GOSAT-GW
Related Resources


Related Tags
Research and Development Related Articles
-
 Research and Development 2026.03.09 Mon High-Resolution Predictions of Global Terrestrial Water Cycle:
Today’s Earth – Global Updated -
 Research and Development 2025.06.18 Wed Advancing Space-Based Weather Analysis and Forecasting – Renewal of JAXA’s Realtime Weather Watch ‘NEXRA3’ and Performance Evaluation with the previous system (Overview Article)
 -
 Research and Development 2025.03.27 Thu Launch of Ocean Weather Forecasts 1km resolution
 -
 Research and Development 2024.05.27 Mon The Use of Earth Observation Satellite Data in the Humanities and Social Sciences (3)
Stay Connected
