


Disaster
2019.10.28 Mon
Threat of Typhoon HAGIBIS (TY1919) which caused record damage
Typhoon HAGIBIS (TY1919) in October 2019 caused extensive damage across Japan. We wish to extend our deepest sympathy to all those who have suffered hardship from the disasters.
JAXA/EORC has continued to analyze the typhoon and its damage this time by using data obtained from currently operating various earth observation satellites and numerical simulations with combination of these data. This report will introduce one of the results.
Figure 1 shows the accumulated rainfall observed by Global Satellite Mapping of Precipitation (GSMaP) during October 5, 2019 00:00 – October 13, 2019 23:00 (UTC) as one example of rainfall and its distribution change by Typhoon HAGIBIS.
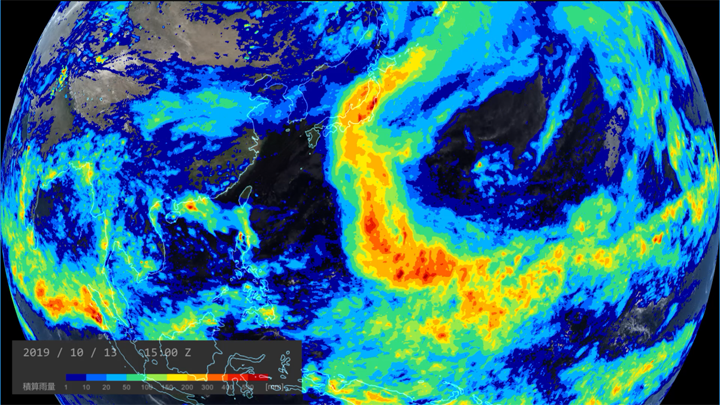
The condition of Typhoon HAGIBIS which generated on South Pacific Ocean is clearly observed. HAGIBIS is moving north toward the Japanese archipelago expanding the rainfall amount and area with increasing its power, causing heavy rain in a large area on its track including Japan. Especially, parts of Kanto and Tohoku region had heavy rainfall with over 500mm in total, and flooding and inundation occurred in many places.
Using information from multiple satellites is necessary since it is not easy for one Low Earth Orbit (LEO) satellite to clarify the whole picture of the damage since they have limitation in observation frequency, especially in case of widespread flood inundation as this time. In addition, by utilizing numerical model, information with higher spatial and temporal resolution can be obtained. As for the Typhoon HAGIBIS case, we received a quick overview of the state of flooding using “TE-Japan”, regional high resolution version of “Today’s Earth (TE)”, which is the land surface simulation system developed under the joint research between JAXA and the University of Tokyo. Looking at the results of river discharge estimates by the land surface simulation shown in Figure 2, we can find that large river discharges are simulated over whole Kanto and Tohoku regions, including Chikuma and Abukuma Rivers where flooding has caused extreme damages.
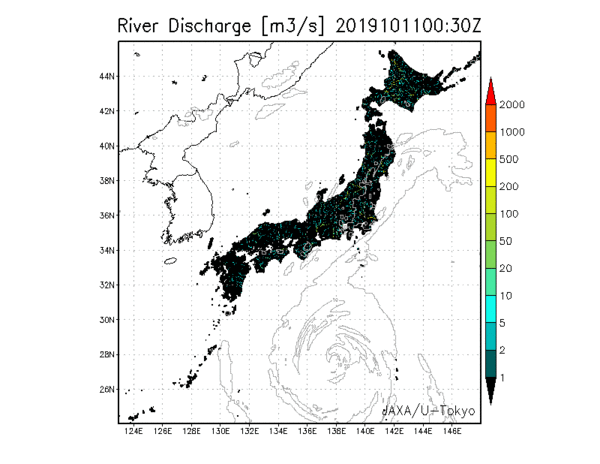
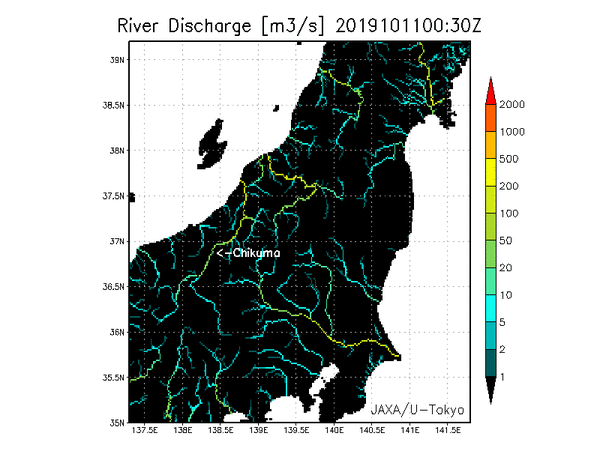
Figure 2. Time series of river discharge simulated by “TE-Japan” during October 11, 2019 00:00 – October 12, 23:00 (UTC) (top: whole area of Japan and the Typhoon track, bottom: extended image of Kanto and Tohoku areas). We input the analytical value of mesoscale model of Japan Meteorological Agency. Contour line shows rain area distribution.
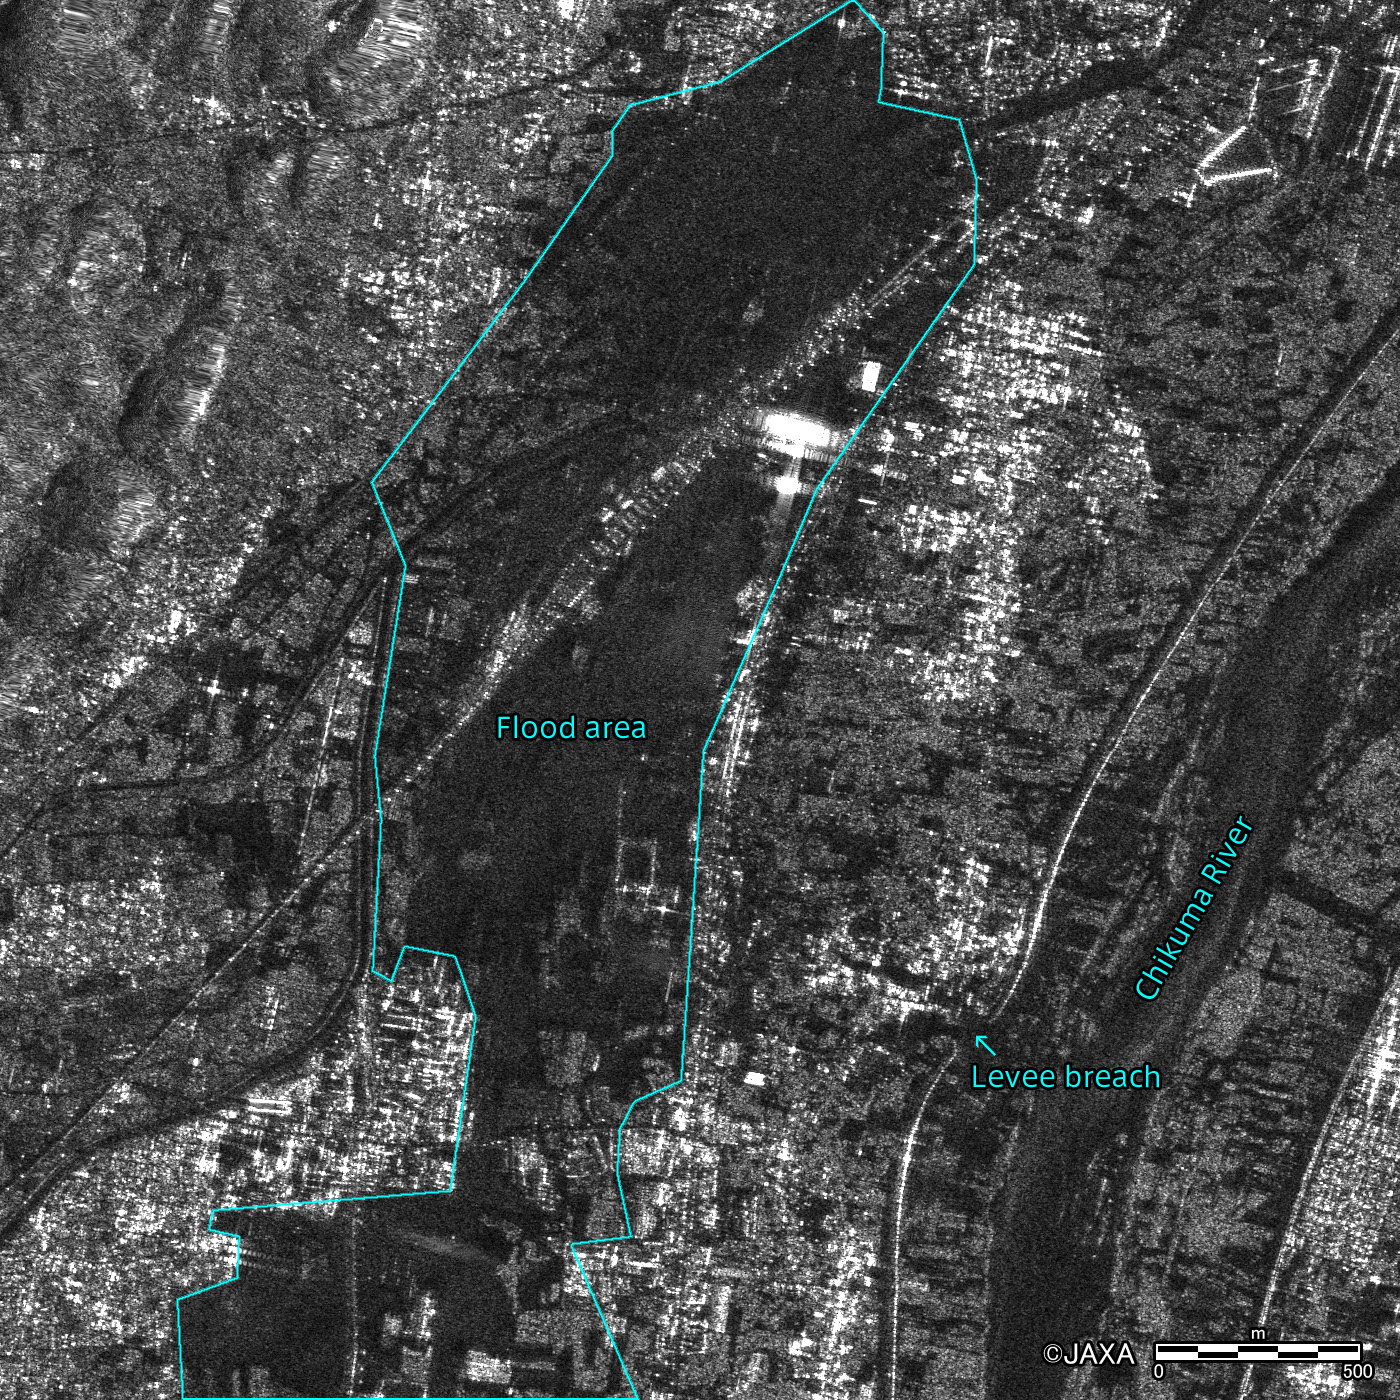
On another front, some information can be directly observed from satellites. Based on the request from Ministry of Land, Infrastructure, Transport and Tourism, JAXA operated the emergency observation around Chikuma River by using high resolution mode (3 m resolution, HH polarized wave) of PALSAR-2, synthetic aperture radar onboard “DAICHI-2” (ALOS-2) on October 13, 11:56 (JST) / 02:56 (UTC). As a result, levee break part of Chikuma River and subsequent inundated area could be observed with high resolution as shown in Figure 3.
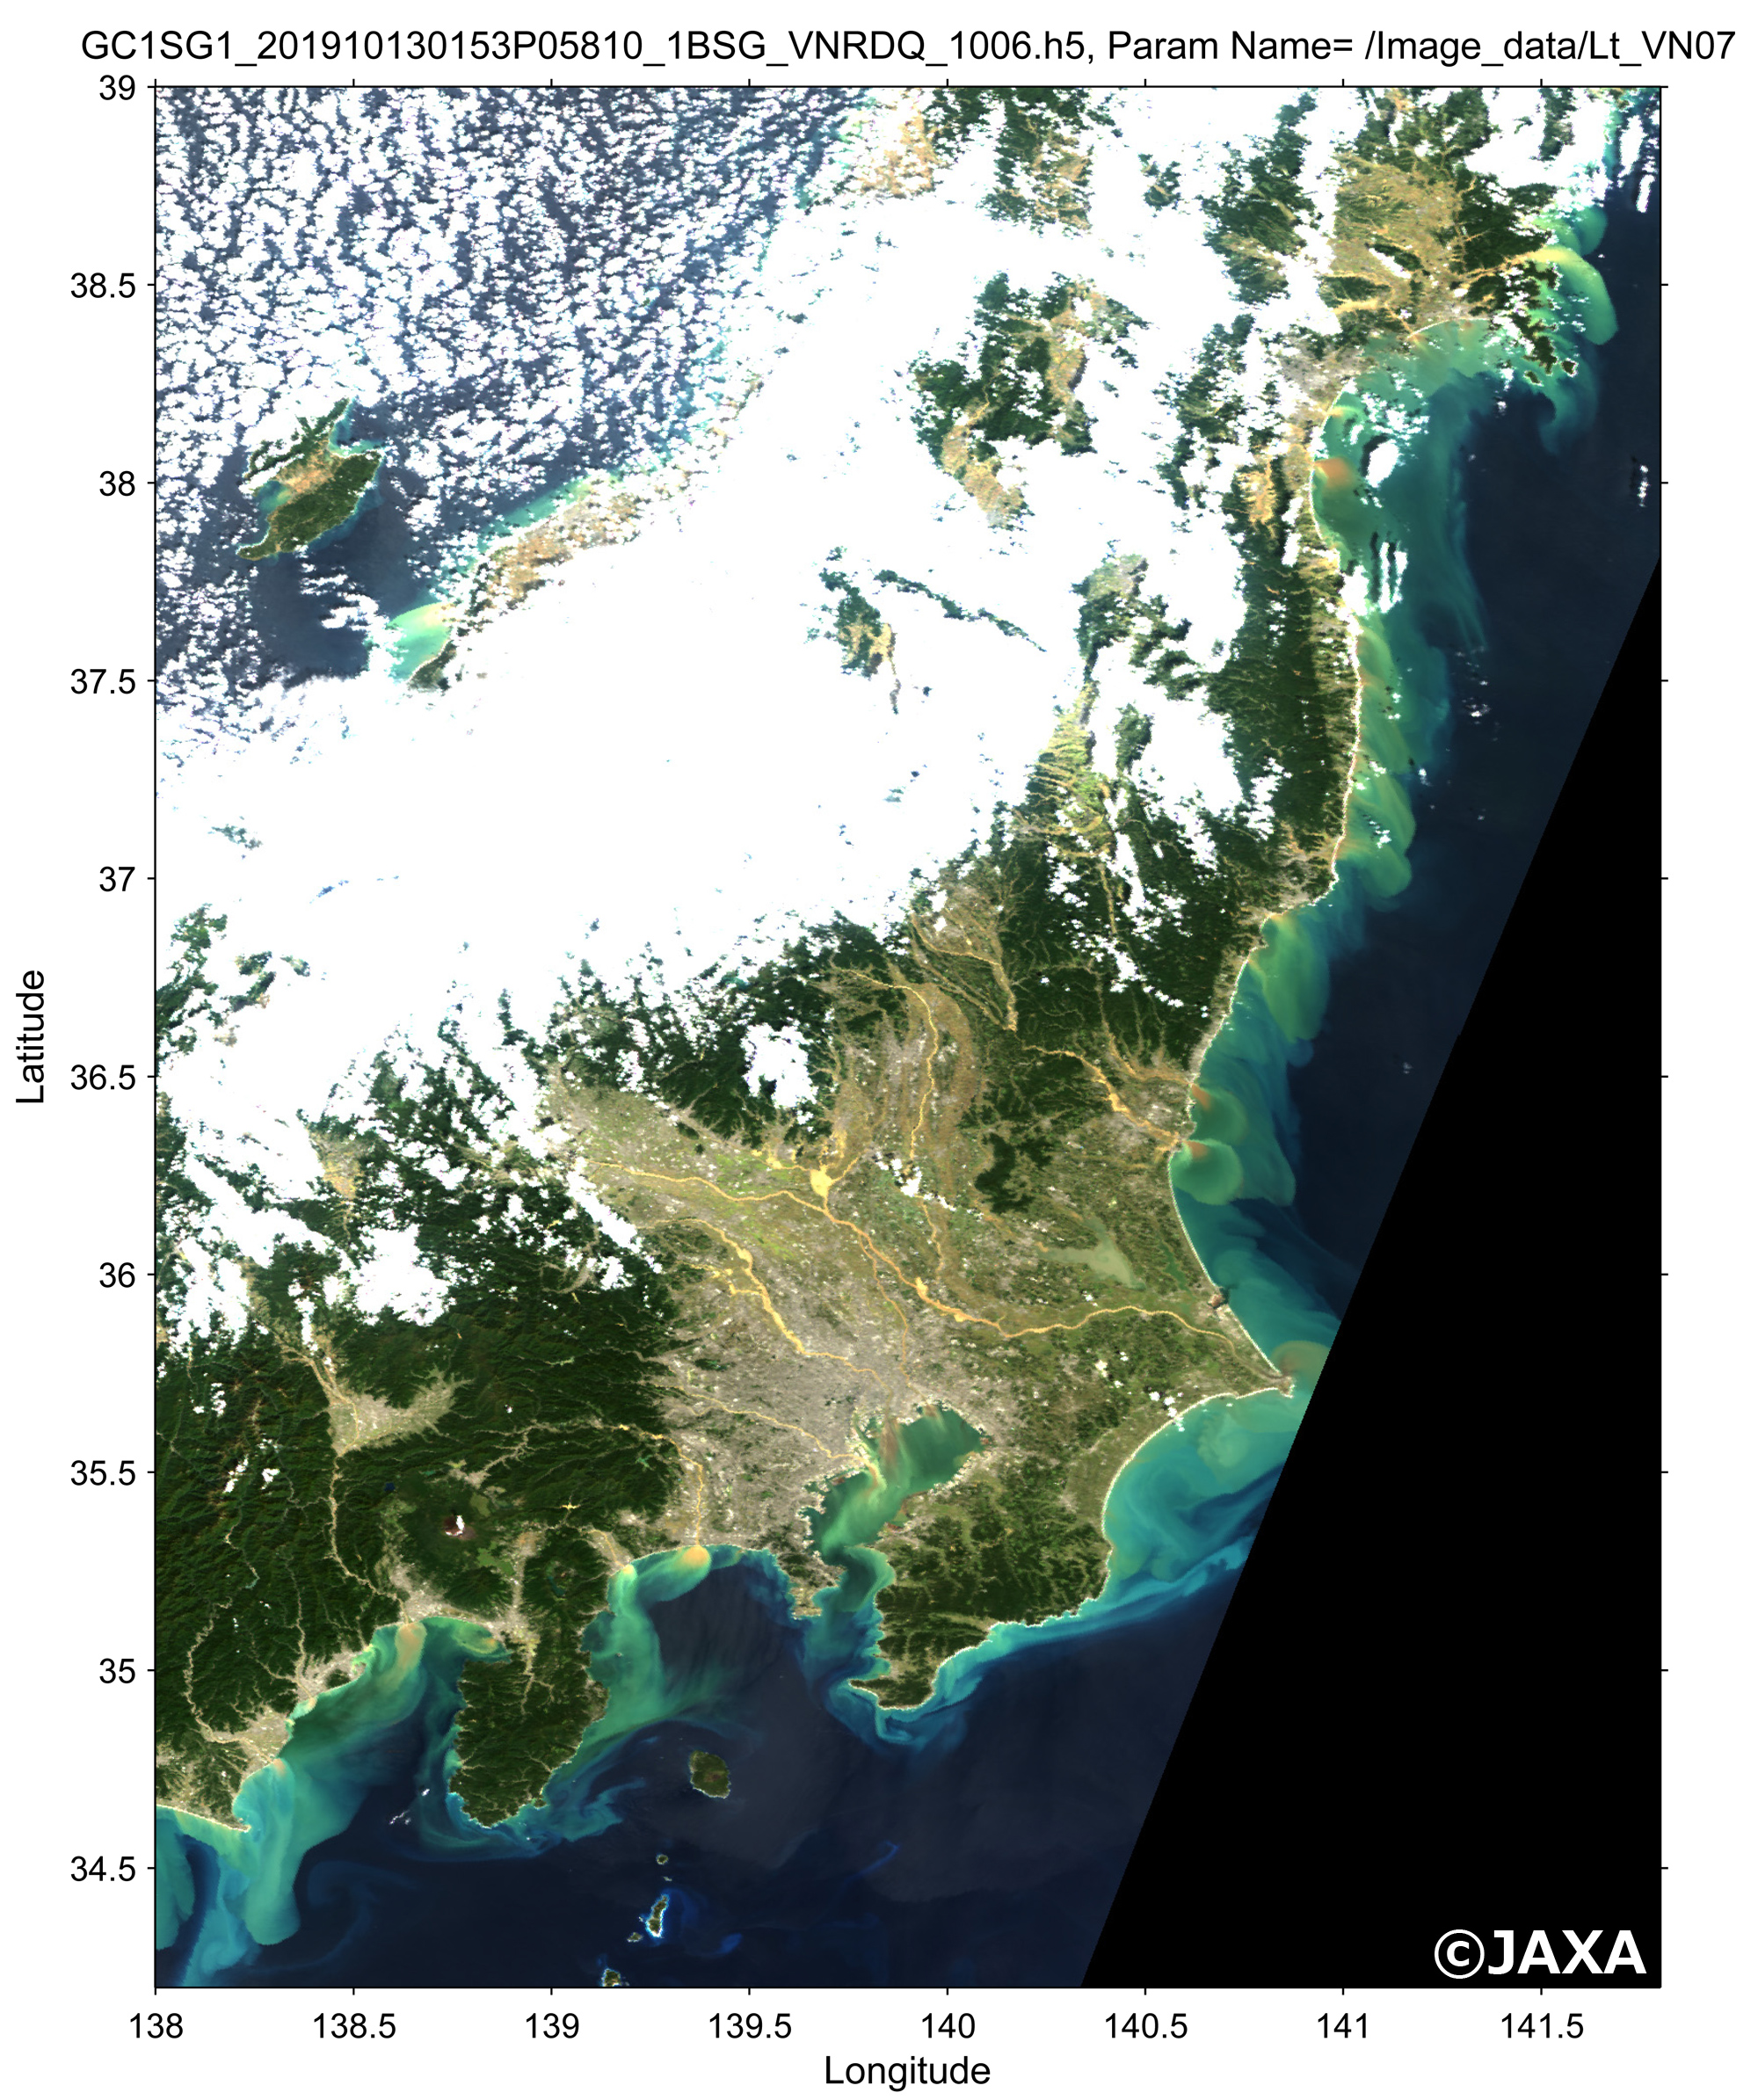
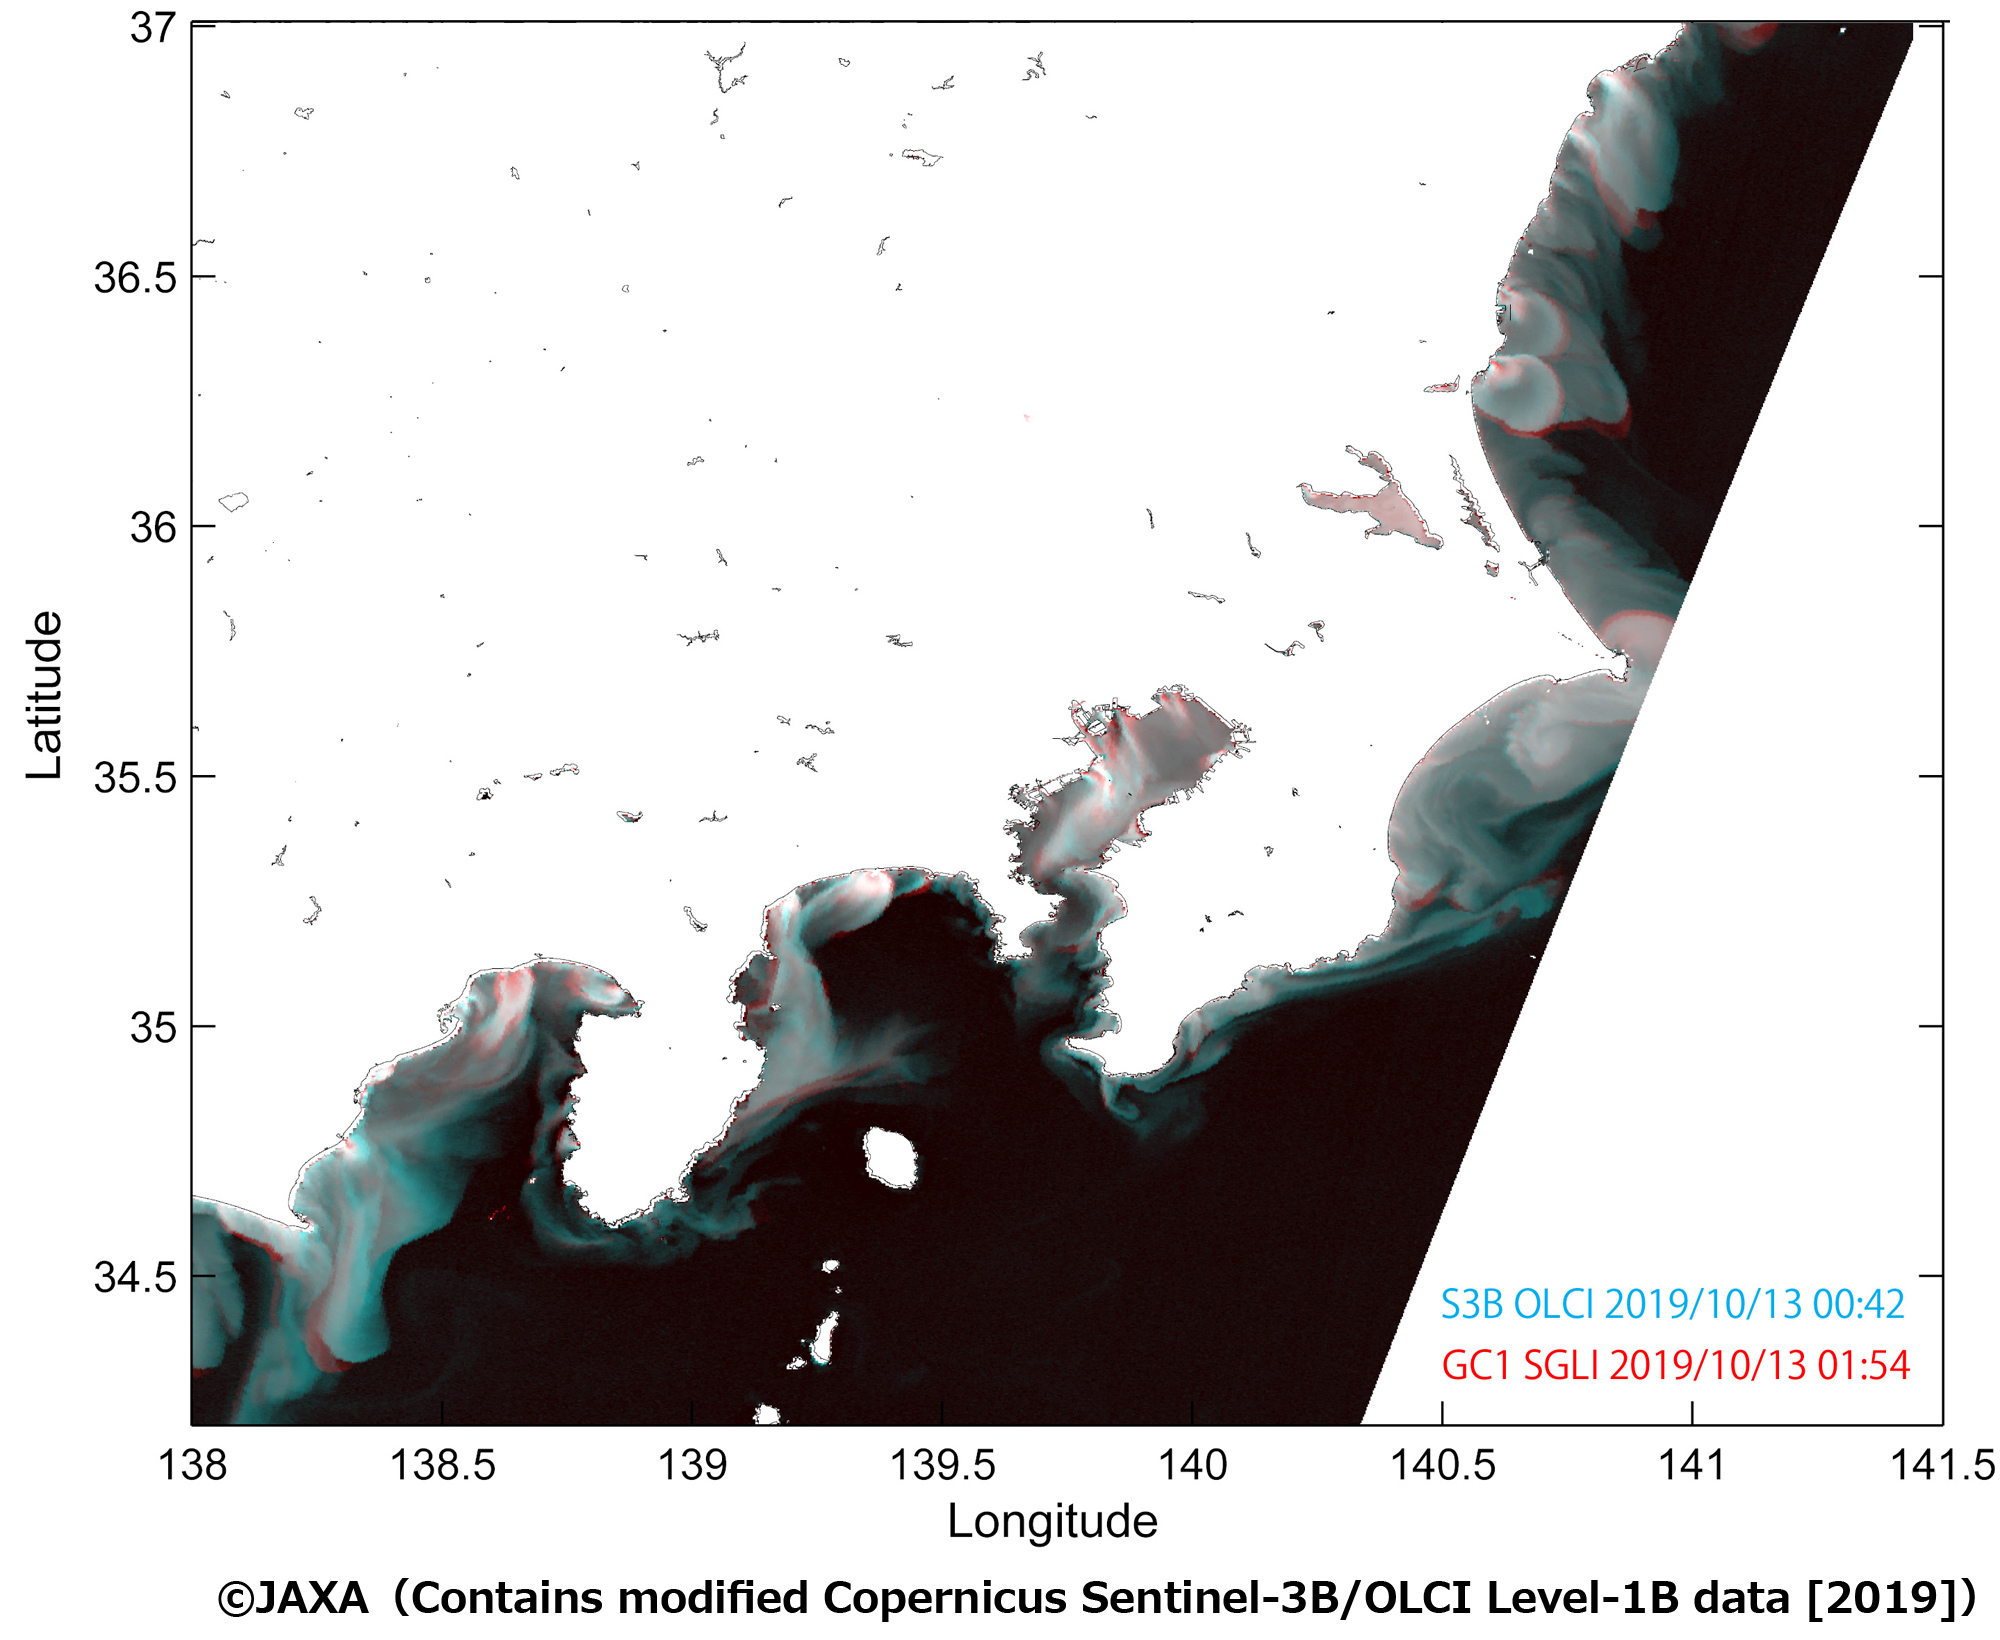
In addition, observation by Global Change Observation Mission – Climate “SHIKISAI” (GCOM-C) captured the situation that a massive amount of sediment was flowing into the Pacific coast due to extremely increased river discharge after the passage of Typhoon HAGIBIS. In figure 4, the sediment discharge areas are clearly observed as ocean area with brown-blue green color. From the distribution range, the sediment expanded more than several tens of kilometers offshore from the coast. Moreover, in order to see the changes of ocean area which had affected by sediment, Fig. 5 shows the difference by overlapping data from Sentinel-3B/OLCI, a European multi-wavelength visible sensor, observed about one hour before “SHIKISAI”. We can find there are changes about several kilometers for one hour, for example, in some area of North Ibaraki and off Choshi etc.
As described above, JAXA/EORC is proceeding researches to provide the accurate information that leads to disaster prevention and mitigation as well as to contribute to the understanding of earth science by making full use of data obtained from various earth observation satellites and the technology of numerical simulation.
Explanation of the Images
Figure 1.
| Satellite | Global Precipitation Measurement core observatory (GPM core observatory) |
|---|---|
| Sensor | Dual-frequency Precipitation Radar (DPR) |
| Date | October 5, 2019 00:00 – October 13, 2019 23:00 (UTC) |
Figure 3.
| Satellite | Advanced Land Observing Satellite-2 “DAICHI-2” (ALOS-2) |
|---|---|
| Sensor | Phased Array type L-band Synthetic Aperture Radar-2 (PALSAR-2) |
| Dates | October 13, 2019 11:56 (JST) / 02:56 (UTC) |
Figure 4.
| Satellite | Global Change Observation Mission – Climate “SHIKISAI” (GCOM-C) |
|---|---|
| Sensor | Second generation GLobal Imager (SGLI) |
| Dates | October 13, 2019 10:53 (JST) / 01:53 (UTC) |
Figure 5.
| Satellite | Global Change Observation Mission -Climate “SHIKISAI” (GCOM-C) |
|---|---|
| Sensor | Second generation GLobal Imager (SGLI) |
| Dates | October 13, 2019 10:54 (JST) / 01:54 (UTC) |
Related Sites
- Seen from Space 2018 Release of Today’s Earth – Global (TE-Global)
- Seen from Space 2015 Release of the JAXA Realtime Rainfall Watch
- Seen from Space 2012 Severe Flood in Thailand
- Rainfall region associated with a developing cyclone
- JAXA GLOBAL RAINFALL WATCH
- Today’s Earth(TE)
- GPM Website
- ALOS-2 ALOS@EORC HomePage
- Global Change Observation Mission – Climate (GCOM-C)
- disaster, Seen from Space
Search by Year
Search by Categories


Tags
-
#Earthquake
-
#Land
-
#Satellite Data
-
#Aerosol
-
#Public Health
-
#GCOM-C
-
#Sea
-
#Atmosphere
-
#Ice
-
#Today's Earth
-
#Flood
-
#Water Cycle
-
#AW3D
-
#G-Portal
-
#EarthCARE
-
#Volcano
-
#Agriculture
-
#Himawari
-
#GHG
-
#GPM
-
#GOSAT
-
#Simulation
-
#GCOM-W
-
#Drought
-
#Fire
-
#Forest
-
#Cooperation
-
#Precipitation
-
#Typhoon
-
#DPR
-
#NEXRA
-
#ALOS
-
#GSMaP
-
#Climate Change
-
#Carbon Cycle
-
#API
-
#Humanities Sociology
-
#AMSR
-
#Land Use Land Cover
-
#Environmental issues
-
#Quick Report
-
#GOSAT-GW
Related Resources


Related Tags
Disaster Related Articles
-
 Disaster 2025.10.23 Thu ALOS-2 Observations of the Earthquakes in the Philippines
(Cebu Island and Mindanao Island) -
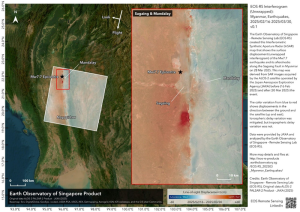 Disaster 2025.04.04 Fri ALOS-2 Observation of the M7.7 Earthquake in Myanmar
 -
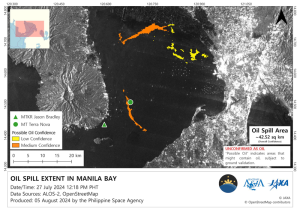 Disaster 2024.09.09 Mon ALOS-2 Observation of the Oil Spill Caused by the Sinking of a Tanker in Manila Bay, Philippines
 -
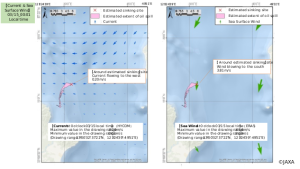 Disaster 2023.04.07 Fri ALOS-2 observation: Oil spill from sunken oil tanker off Mindoro Island, Philippines (follow-up report)
Stay Connected
