


Disaster
2012.02.29 Wed
Severe Flood in Thailand
Thailand was affected by a violent flood from July to December, 2011. The results of the emergency observation using SPOT-5 were reported in “Seen from Space” on October 25, 2011. Spatial observations were also made by the airborne Pi-SAR-L sensor in September and November, 2011, and these results were reported on the “Latest Image” corner of the EORC (Earth Observation Research Center) home page.
The image below (Fig. 1) shows the flood in Thailand as observed from space. An animation was created using images taken from November 1 to December 25, 2011 by the GOSAT/CAI* sensor. GOSAT (Greenhouse Gases Observing Satellite) was launched in January 2009. CAI(Cloud and Aerosol Imager) is a sensor on board GOSAT to monitor clouds and aerosols.
The blue area seen in the GOSAT image taken on November 1 shows the region inundated by the flooding of the Chao Phraya River. Note that the city of Ayutthaya looks like an island in a great lake and that the flooding approached Bangkok, the capital of Thailand. As shown in the image taken on December 25, the inundated region shrank as the water withdrew from the Bangkok area. Japanese factories in Thailand were seriously damaged by this flood.
*The GOSAT (Greenhouse Gases Observing Satellite) was launched to measure the atmospheric concentrations of carbon dioxide and methane, the two major greenhouse gases, from space. The image data from CAI(Cloud and Aerosol Imager) are used to correct the effects of the clouds and aerosols.
The old capital, Ayutthaya, a world heritage site
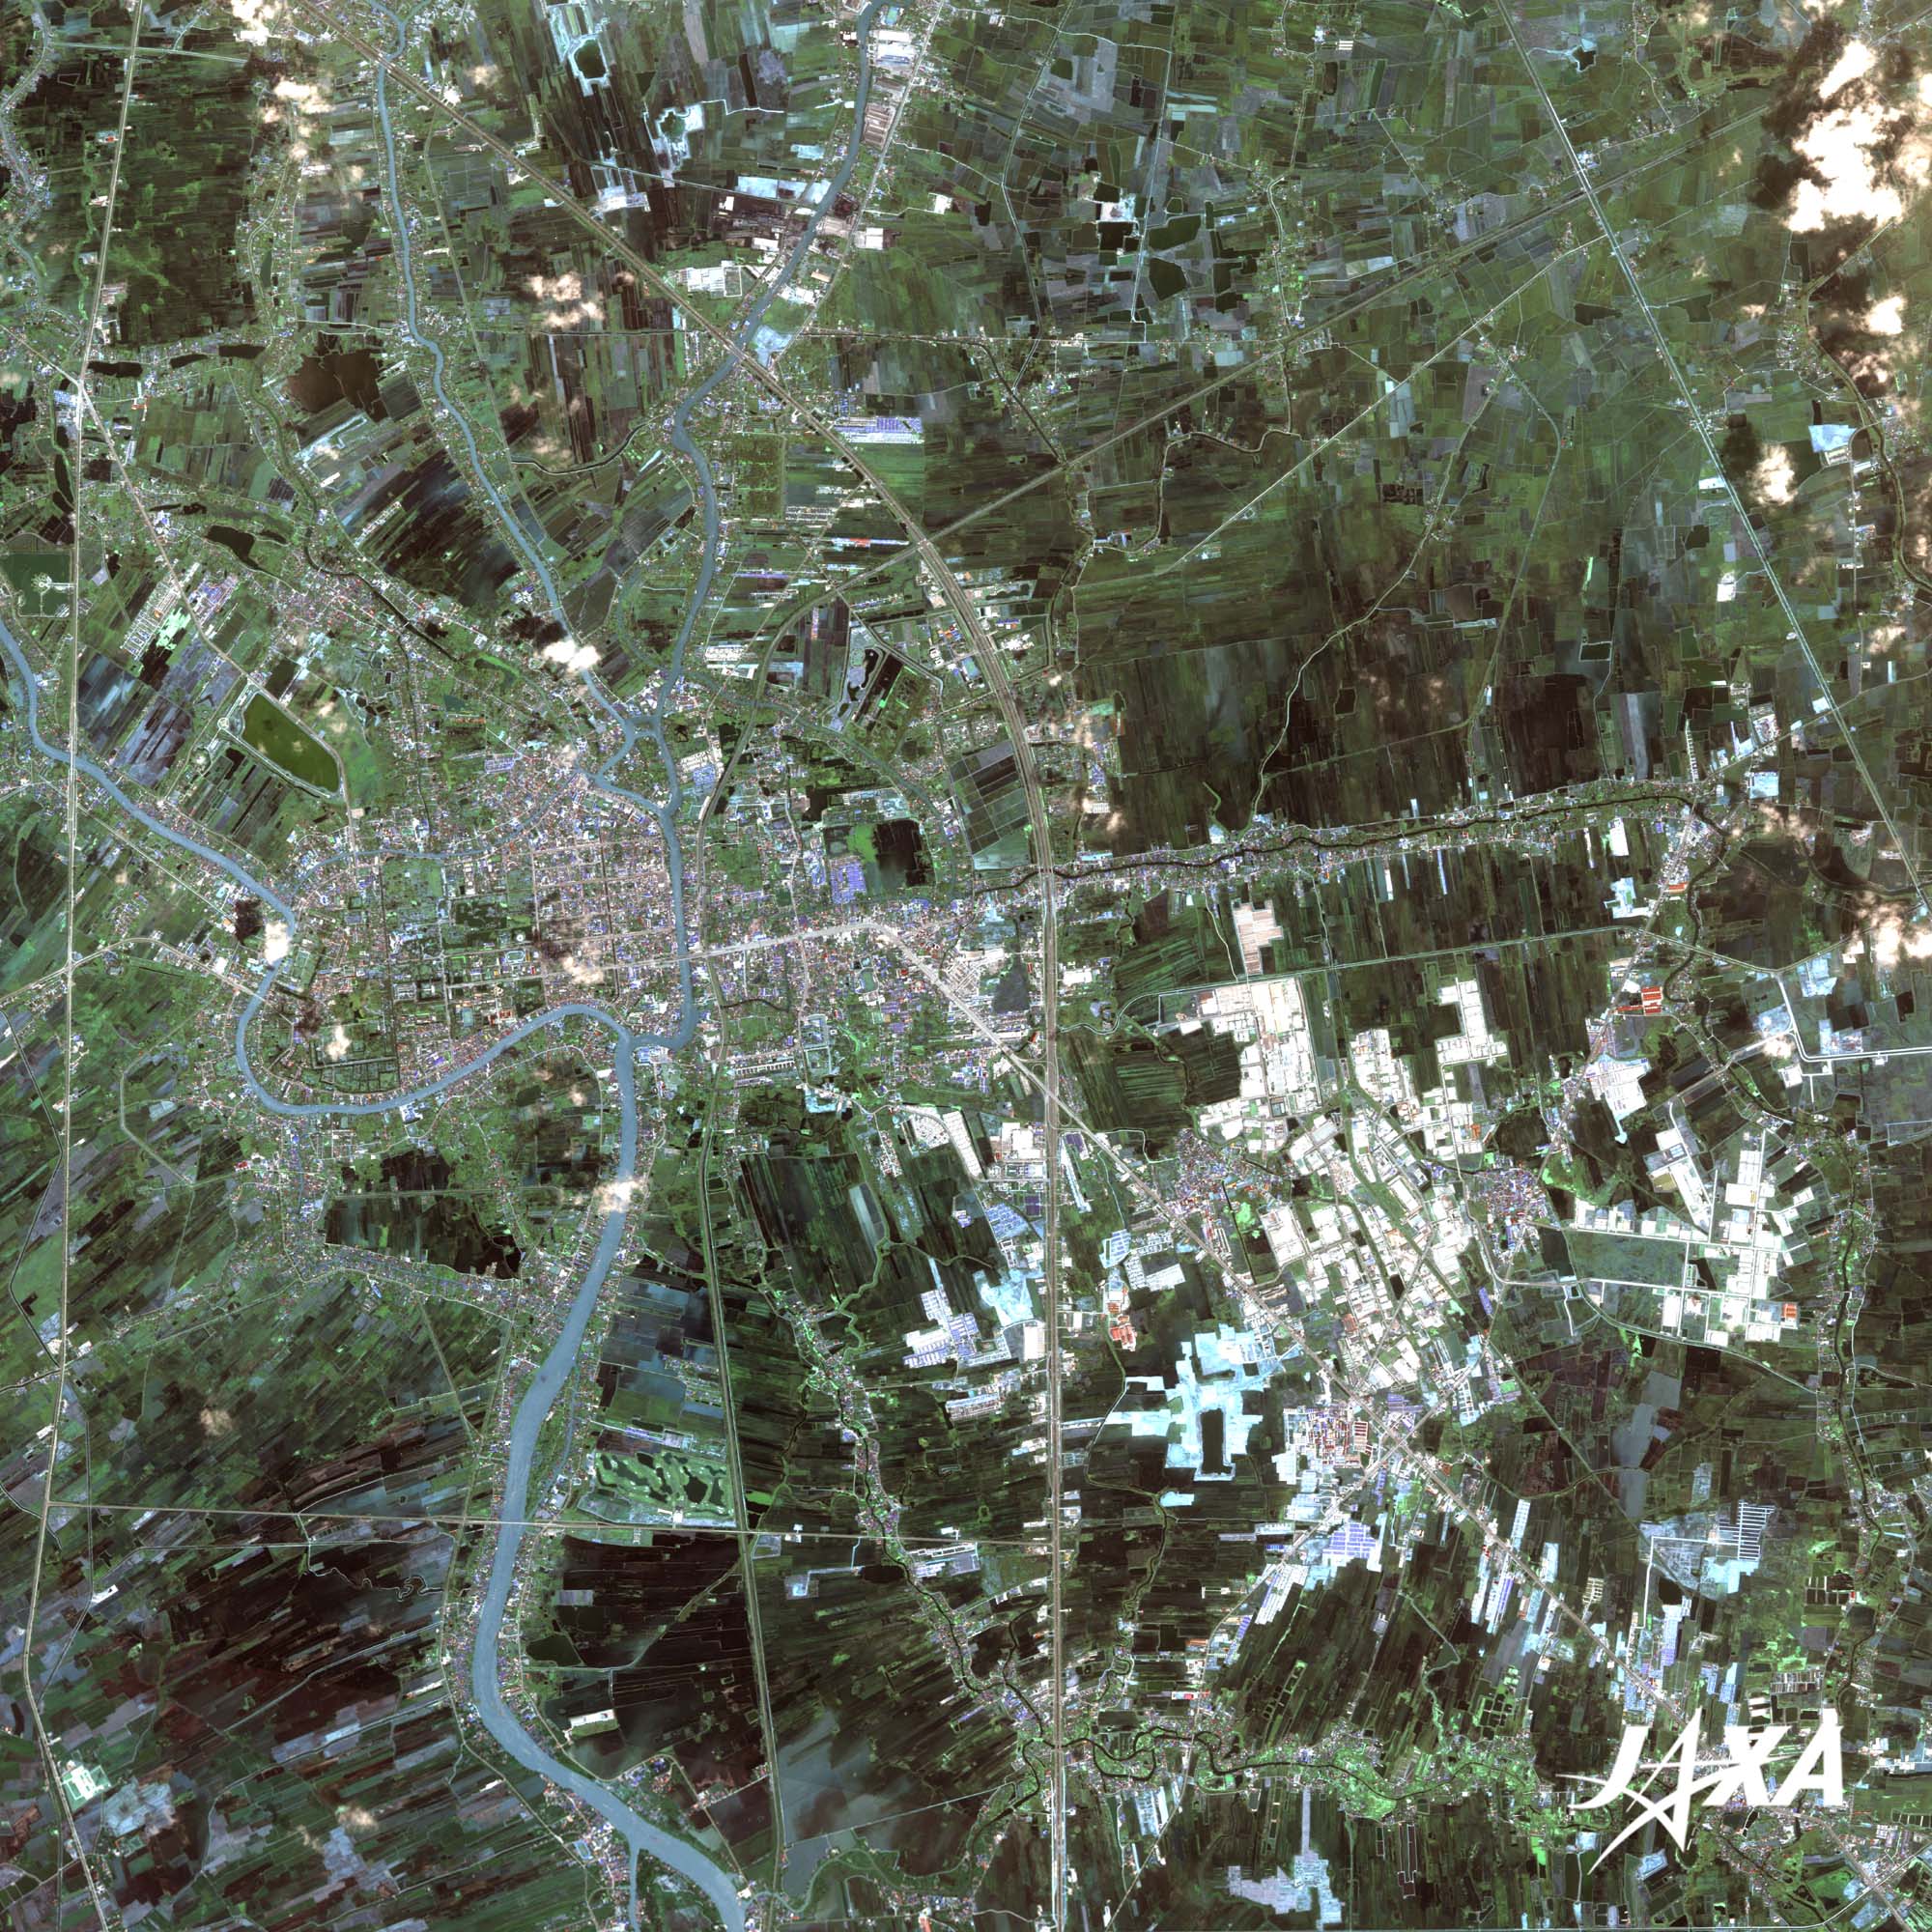
Figure 2 shows an image of the city of Ayutthaya taken on September 22, 2010 by AVNIR-2 (Advanced Visible and Near Infrared Radiometer-2) on board ALOS (Advanced Land Observing Satellite). Ayutthaya was included in the list of world heritage sites. Ayutthaya was prosperous for approximately 420 years beginning in the middle of the fourteenth century. It was the capital of the Ayutthaya dynasty and became an international trade between Europe and East Asia at the beginning of the seventeenth century. The city is surrounded by the Chao Phraya River and its tributaries. The remains of many pagodas and temples still persist within the city. The industrial park in Ayutthaya is seen at the lower right of the image in Fig. 2. Pi-SAR-L also observed the flooded areas of the industrial factories located to the south of Ayutthaya. The observation result of Part 4 (Japanese only) was reported in the Latest Image corner on the EORC homepage on December 12, 2011.

caption on
caption off
Ayutthaya (kmz, 4.77 MB, Low Resolution) as seen on Google Earth
End of operation of ALOS (Daichi)
Operation of the satellite ALOS (Daichi), which was launched on January 24, 2006, ended at 01:50 am (UTC) on May 12, 2011. The satellite operated beyond the three years of its design life and the five years of its target life. ALOS made important contributions to Earth observation, accumulating 6.5 million images around the world and contributing to emergency disaster observation. ALOS obtained over 400 scenes of the Great East Japan Earthquake (March 11, 2011), and its images were provided to ten governmental agencies. Archived images obtained by ALOS will be used in the REDD+ project.
Explanation of the Images:
| Satellite: | Greenhouse Gases Observing Satellite (GOSAT) (“Ibuki”) |
| Sensor: | Thermal and Near Infrared Sensor for Carbon Observation-Cloud and Aerosol Imager (TANSO-CAI) |
| Date: | November 1, 2011–December 25, 2011 (UTC) (Fig. 1) |
| Ground resolution: | 500 m |
TANSO-CAI is a remote sensor for observing clouds and aerosol and for detecting error sources in measurements of greenhouse gases. TANSO-CAI has four observation bands. Figure 1 was produced by assigning red to Band 2 (664 to 684 nm), green to Band 3 (860 to 880 nm), and blue to Band 1 (370 to 390 nm). The resulting image has natural coloring as if seen by the naked eye. The following colors designate ground objects:
| Green: | Forests, grass fields, or farmland |
| Blue: | Water |
| White: | Clouds |
| Satellite: | Advanced Land Observing Satellite (ALOS) (Daichi) |
| Sensor: |
Advanced Visible and Near Infrared Radiometer-2 (AVNIR-2) Panchromatic Remote-sensing Instrument for Stereo Mapping (PRISM) |
| Date: | 3:55 (UTC) on September 22, 2010 (AVNIR-2 and PRISM) (Fig. 2) |
| Ground resolution: | 10 m (AVNIR-2) and 2.5 m (PRISM) |
| Map Projection: | Universal Transversal Mercator (UTM) |
AVNIR-2 has four observation bands. The color composite images in Fig. 2 were produced by assigning red to Band 3 (610 to 690 nm), green to Band 2 (520 to 600 nm), and blue to Band 1 (420 to 500 nm). The resulting images have natural coloring as if seen by the naked eye. Each color indicates the following ground objects:
| Dark Green: | Forests |
| Bright Green: | Farmland or grass fields |
| Brown: | Fields or bare land |
| Bluish-gray: | Urban area |
| Blue: | Water surface |
| White: | Roads, buildings, or clouds |
(Fig. 2)
PRISM is an optical sensor for observing ground surfaces with visible and near-infrared signals in the 520- to 770-nm (one-billionth of a meter) band. The image is monochromatic but has a higher resolution. PRISM has three independent optical systems to acquire images in the view of nadir, forward, and backward simultaneously. The nadir image was used in the figure.
The above AVNIR-2 color composite image was decomposed into hue, saturation, and intensity. The intensity portion was replaced by PRISM data. The hue, saturation, and intensity data were then reversed into a color image with a virtual 2.5-m resolution. A color image created by combining a higher resolution monochromatic image and a lower resolution color image is called a pan-sharpened image.
Search by Year
Search by Categories


Tags
-
#Earthquake
-
#Land
-
#Satellite Data
-
#Aerosol
-
#Public Health
-
#GCOM-C
-
#Sea
-
#Atmosphere
-
#Ice
-
#Today's Earth
-
#Flood
-
#Water Cycle
-
#AW3D
-
#G-Portal
-
#EarthCARE
-
#Volcano
-
#Agriculture
-
#Himawari
-
#GHG
-
#GPM
-
#GOSAT
-
#Simulation
-
#GCOM-W
-
#Drought
-
#Fire
-
#Forest
-
#Cooperation
-
#Precipitation
-
#Typhoon
-
#DPR
-
#NEXRA
-
#ALOS
-
#GSMaP
-
#Climate Change
-
#Carbon Cycle
-
#API
-
#Humanities Sociology
-
#AMSR
-
#Land Use Land Cover
-
#Environmental issues
-
#Quick Report
-
#GOSAT-GW
Related Resources


Related Tags
Disaster Related Articles
-
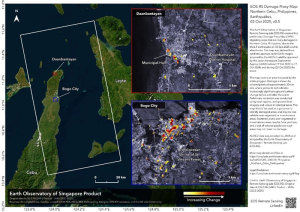 Disaster 2025.10.23 Thu ALOS-2 Observations of the Earthquakes in the Philippines
(Cebu Island and Mindanao Island) -
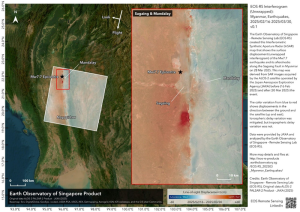 Disaster 2025.04.04 Fri ALOS-2 Observation of the M7.7 Earthquake in Myanmar
 -
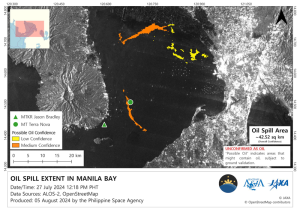 Disaster 2024.09.09 Mon ALOS-2 Observation of the Oil Spill Caused by the Sinking of a Tanker in Manila Bay, Philippines
 -
 Disaster 2023.04.07 Fri ALOS-2 observation: Oil spill from sunken oil tanker off Mindoro Island, Philippines (follow-up report)
Stay Connected
