


Meteorology and the Environment
2023.08.31 Thu
Climate Change 2023 (1) : Sea Surface Temperature Rise and El Niño Event
The World Meteorological Organization (WMO) and the EU weather information agency announced at the end of July that July 2023 was the hottest month on record (*). In conjunction with this announcement, United Nations Secretary-General António Guterres expressed a strong sense of urgency by stating, “The era of global warming has ended; the era of global boiling has arrived.” JAXA collects information on global environmental changes through observations by Earth observation satellites and has analyzed this summer’s abnormal weather as a situation worthy of special mention. Therefore, in this series of articles, “Climate Change 2023”, we will focus on “Sea Surface Temperature”, “Sea Ice” and “Land” and introduce the abnormal weather in 2023. This is the first article in the series, “Sea Surface Temperature Rise and El Niño Event.”
*July 2023 confirmed as hottest month on record:
https://public.wmo.int/en/media/news/july-2023-confirmed-hottest-month-record
Record rise in global sea surface temperature
September 11, 2023 Added global sea surface temperatures for August as preliminary report
October 17, 2023 Added global sea surface temperatures for August as preliminary report
November 15, 2023 Added global sea surface temperatures for October
December 26, 2023 Added global sea surface temperatures for November
January 11, 2024 Added global sea surface temperatures for December
April 26, 2024 Added global sea surface temperatures for January-March 2024.
August 7, 2024 Added global sea surface temperatures for January-July 2024.
It is known that the ocean has a characteristic that makes it difficult to cool down once warmed compared to the atmosphere and land, and that it functions as a heat reservoir that has increased due to global warming (*1). JAXA’s Advanced Microwave Scanning Radiometer (AMSR) series has been continuously monitoring sea surface temperature (SST) since 2002 and is used as a diagnostic tool for ocean warming in Japan and overseas.
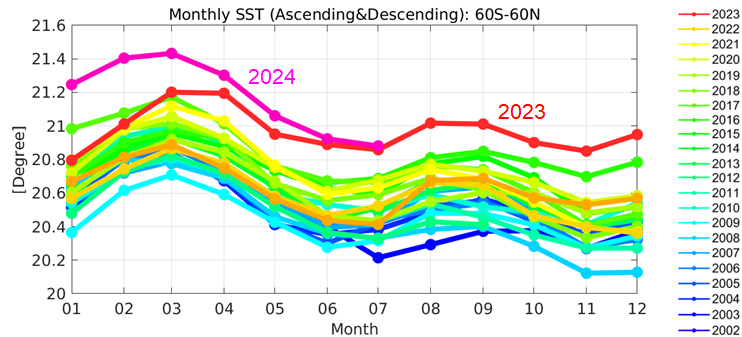
In fact, let’s take a look at the trends in global mean SST (seasonal changes) observed by the AMSR series for about 20 years of higher temperatures (Figure 1). Since data from the northern and southern hemispheres are averaged together, seasonal changes are repeated every year, with maximum and minimum peaks in water temperature observed twice a year. It is clear that global SSTs have increased for all seasons in the first half of the decade from 2002 to 2011 and in the second half of the decade from 2012 to 2022. However, for this year 2023, record high temperatures deviating from this seasonal cycle have persisted since around March, resulting in record high SSTs in every month since the AMSR series began observations in 2002 (red line in the figure).
(Added on September 11, 2023)
Preliminary SSTs for August* have been added to the Figure 1 graph. High SSTs continued into August.
(Added on October 17, 2023)
Preliminary SSTs for September* have been added to the Figure 1 graph. High SSTs continued into September.
* Data in August and September are preliminary and will be updated as they are confirmed.
(Added on November 15, 2023)
SSTs for October have been added to the Figure 1 graph. Although the temperature has declined since August and September, it is still high compared to previous years.
* Data in August and September are preliminary and will be updated as they are confirmed.
(Added on December 26, 2023)
SSTs for November have been added to the Figure 1 graph. The temperature remains high compared to those in previous years.
* Data in August and September are preliminary and will be updated as they are confirmed.
(Added on January 11, 2024)
SSTs for December have been added to the Figure 1 graph. The temperature remains high compared to those in previous years.
* Data in August and September are preliminary and will be updated as they are confirmed.
(Added on April 26, 2024)
SSTs from January to March 2024 have been added to the Figure 1 graph. In the averaging processing, the areal distortion due to the map projection has been considered.
(Added on August 7, 2024)
SSTs from January to July 2024 have been added to the Figure 1 graph. As the bug in the averaging process was found, the reprocessing was conducted.
Observation Satellites: Aqua/AMSR-E (June 2002-September 2011), “SHIZUKU” GCOM-W/AMSR2 (July 2012-)
(No observation data from October 2011 to June 2012)
High SSTs near Japan, especially off the coast of Tohoku and Hokkaido
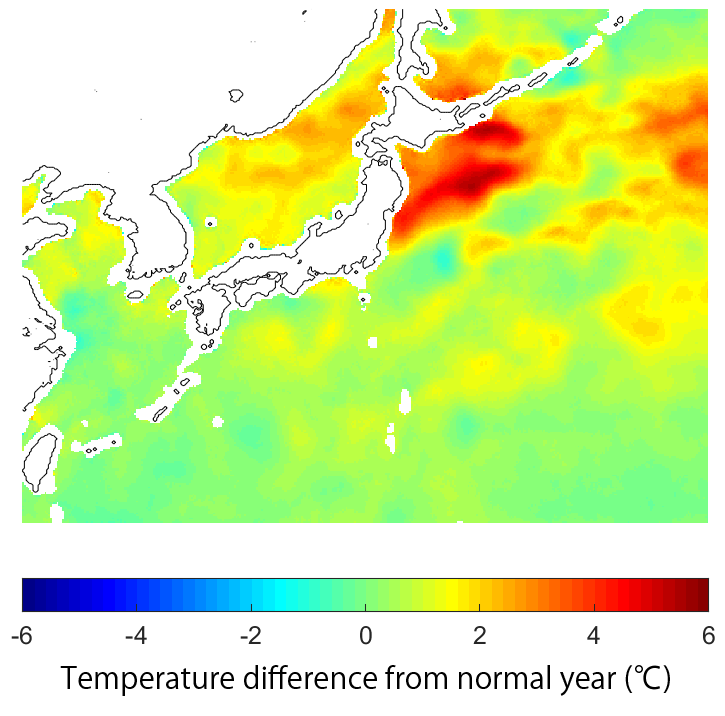
Then, let us turn our attention to the waters around Japan, where we live. Figure 2 is a map of SST anomalies for July 2023. Overall, SSTs tend to be higher than normal, especially in the Pacific Ocean off the coast of Tohoku and Hokkaido, where they are more than 5°C higher than normal. The Kuroshio extension, which normally flows eastward from Joban-oki, moved northward to Sanriku-oki this season, bringing high water temperatures. In a recent report of Japan Meteorological Agency (JMA), it was pointed out that this high SST may have been one of the factors that brought record high temperatures to northern Japan this summer (*2).
Figure 3 shows the monthly mean SST anomalies in the seas around Japan (20-50°N, 120-160°E), which shows the long-term trends of variations, excluding seasonal cycles. The anomalies in the seas around Japan vary between -1°C and +1°C. In recent years, August 2022 and July 2023 were particularly warm.
In addition to global warming, SSTs in the ocean around Japan are changing under the influence of complex variations in the ocean current system, which has a significant impact on Japan’s weather, climate, and fisheries. To meet the demand for monitoring and forecasting such oceanic changes, JAXA, in cooperation with the Japan Agency for Marine-Earth Science and Technology, operates the “Ocean Weather Forecast” for the area around Japan, providing forecast results of water temperature and current speed up to about two weeks ahead. The Ocean Weather Forecast uses SST data from the AMSR series to improve forecast accuracy.
(Normal values are calculated from monthly averages of AMSR-E and AMSR2 observations.)
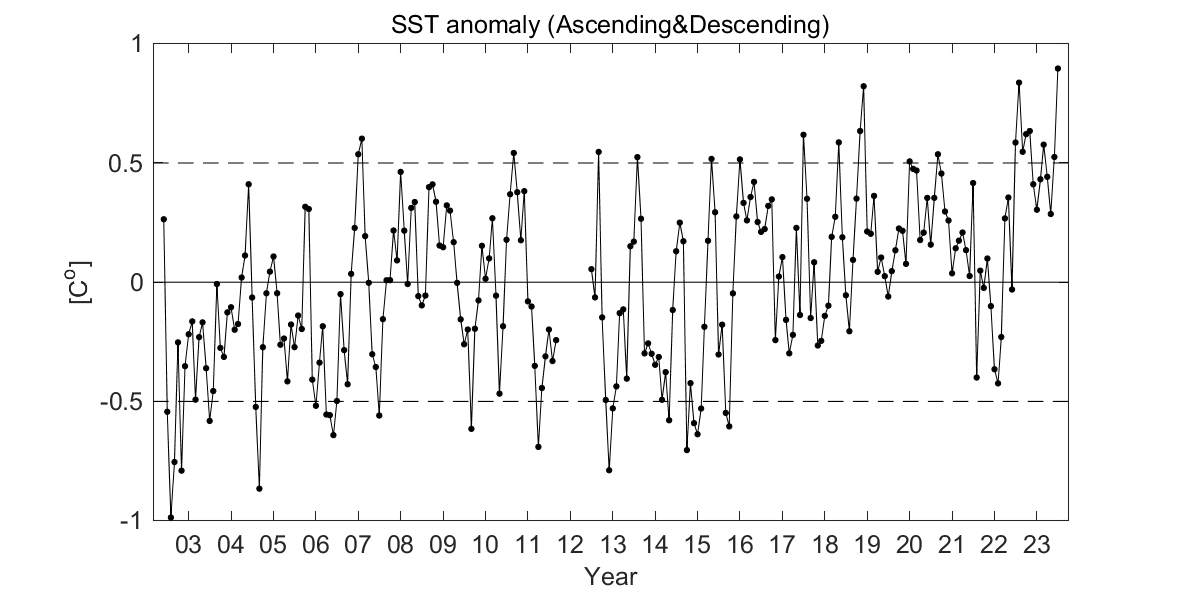
(Normal values are calculated from monthly averages of AMSR-E and AMSR2 observations.)
Will a super El Niño event occur?
Japan’s weather is affected by changes that occur not only in nearby waters, but also in distant areas of the ocean. One of the best known is the connection with the El Niño/La Niña event. An El Niño event is one in which SSTs in the eastern equatorial Pacific Ocean are above normal and remain so for a year or more. A La Niña event, on the other hand, is one in which SSTs in the same region remain below normal. It is known that both occur in multi-year cycles and can trigger extreme weather events not only in the equatorial Pacific region but also in other parts of the world, including Japan, by acting on the position and strength of the global atmospheric convection system. For example, the largest El Niño (Super El Niño) event in recorded history, which occurred in the winter of 1997-1998, is considered to have been responsible for the cold summer of 1998, which led to reduced crop production in Japan, as well as the massive wildfires in Southeast Asia. In order to detect the signs of such extreme weather events, JAXA provides a web tool called “El Nino Watch” that uses SSTs from the AMSR series.
Let’s take a look at the situation in 2023 using this web tool. Figure 4 (1) shows the tropical SST anomalies for August 22-26, 2023. The area enclosed by the rectangle in the eastern equatorial Pacific Ocean indicates the El Niño monitoring area as defined by JMA. SSTs in the monitoring area are about 2-3°C above normal, indicating that an El Niño event is occurring. The tool uses time series of anomalies in the monitored ocean area to more intuitively confirm the transition of the El Niño/La Niña event (Figure 4 (2)). In the figure, periods in the past when high and low SST anomalies persisted and were defined as El Niño/La Niña events are indicated in pink and light blue, and an El Niño event comparable to the 1997/1998 event was observed in 2015 (*3). In 2023, the El Niño event has been ongoing since around March, and the increase in high SST temperature anomalies is approaching its peak in 2015. We encourage you to check the “EL Nino Watch” to see if this develops into a Super El Nino event in the future.
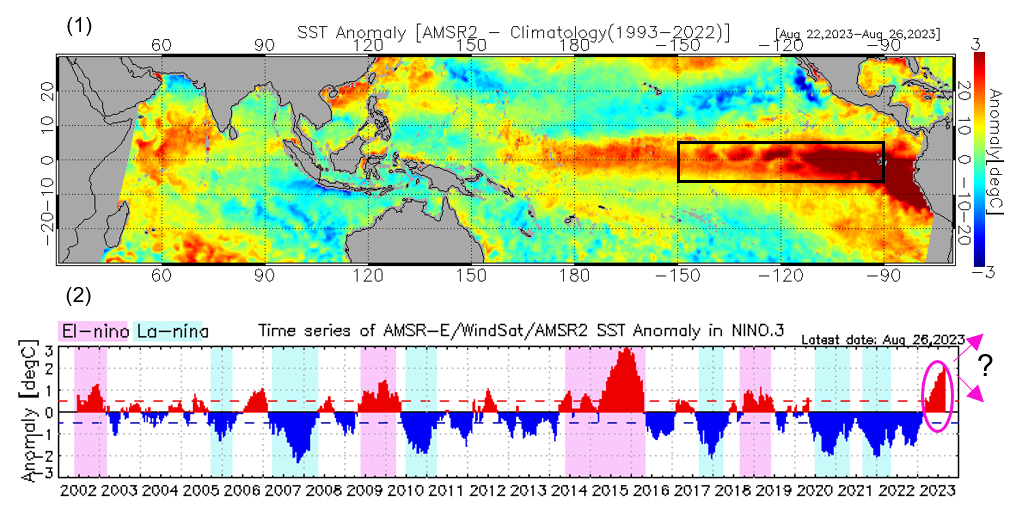
(2) Time series of 5-day mean SST anomalies in the El Niño monitoring area
(The normal values are calculated based on monthly mean SSTs (1991-2020) published by JMA).
In contrast to the 1997/1998 Super El Niño event, which brought a cool summer to Japan, the year 2023, as mentioned at the beginning of this report, is characterized by an extremely hot summer. Several factors other than the El Niño event have been pointed out as contributing to this summer’s extreme heat, and the detailed mechanism has not yet been clarified. What is needed for clarification is precisely the monitoring of ongoing extreme weather events, but as introduced here, it is not possible to detect extreme weather events without the accumulation of past observational data. JAXA will make further efforts to continue Earth observation satellites, including the AMSR series, to provide a wide range of data and contribute to the development of climate change research.
Reference: The Advanced Microwave Scanning Radiometer (AMSR) series
The AMSR introduced in this article is a sensor developed by JAXA to measure weak microwaves emitted from natural sources such as the ground surface and the atmosphere. A major advantage of the AMSR is that it can observe and provide data with few missing data on a daily basis, even in tropical regions that are difficult to observe due to cloud cover. In particular, observations by AMSR-E on NASA’s Aqua satellite and AMSR2 (since 2012) on the GCOM-W “SHIZUKU” satellite currently operated by JAXA have collected observation data for more than 20 years and are widely used for numerical weather prediction and climate change research not only in Japan but also overseas. The successor, AMSR3 (on board the GOSAT-GW satellite), is scheduled for launch in FY2024. The AMSR is one of the world’s leading series to provide the continuous global observations needed to elucidate the mechanisms of climate change. By providing near real-time data to JMA, we also help improve the accuracy of daily numerical weather forecasts and typhoon analysis.
Acknowledgments
We would like to thank Professor Naoto Ebuchi of Hokkaido University for helping us to prepare and write this article.
Reference:
*1 von Schuckmann et al. 2020, Heat stored in the Earth system: where does the energy go?: https://doi.org/10.5194/essd-12-2013-2020
*2 A case of heavy rainfall in the rainy (Baiu) season of 2023 and characteristics and factors of significantly high temperatures in and after the second half of July (JMA, 28 August 2023): https://www.jma.go.jp/jma/press/2308/28a/kentoukai20230828.html (Japanese only)
*3 El Niño phenomenon being close to the strongest on record 2015.11.30: https://earth.jaxa.jp/en/earthview/2015/11/30/1288/index.html
Search by Year
Search by Categories


Tags
-
#Earthquake
-
#Land
-
#Satellite Data
-
#Aerosol
-
#Public Health
-
#GCOM-C
-
#Sea
-
#Atmosphere
-
#Ice
-
#Today's Earth
-
#Flood
-
#Water Cycle
-
#AW3D
-
#G-Portal
-
#EarthCARE
-
#Volcano
-
#Agriculture
-
#Himawari
-
#GHG
-
#GPM
-
#GOSAT
-
#Simulation
-
#GCOM-W
-
#Drought
-
#Fire
-
#Forest
-
#Cooperation
-
#Precipitation
-
#Typhoon
-
#DPR
-
#NEXRA
-
#ALOS
-
#GSMaP
-
#Climate Change
-
#Carbon Cycle
-
#API
-
#Humanities Sociology
-
#AMSR
-
#Land Use Land Cover
-
#Environmental issues
-
#Quick Report
-
#GOSAT-GW
Related Resources


Related Tags
Meteorology and the Environment Related Articles
-
 Meteorology and the Environment 2025.11.05 Wed The Breakup of the World’s Largest Iceberg, “A23a”: The Trajectory of Iceberg A23a Observed by “GCOM-W”, “ALOS-2”, “ALOS-4” and the Latest Satellite, “GOSAT-GW”
 -
 Meteorology and the Environment 2025.10.02 Thu Satellite Observations and Flood Forecasts for Line-shaped Rainbands in August 2025
 -
 Meteorology and the Environment 2025.05.20 Tue February 2025: Global Sea Ice Extent Reaches its Lowest in the History of Satellite Observations
 -
 Meteorology and the Environment 2023.10.11 Wed Climate Change 2023 (2) : Antarctic Winter Sea Ice Extent Lowest Ever Recorded
Stay Connected
