


Meteorology and the Environment
2023.10.11 Wed
Climate Change 2023 (2) : Antarctic Winter Sea Ice Extent Lowest Ever Recorded
In the first article of this series (special website), which deals with extreme weather events in 2023, we explained ocean warming. The Advanced Microwave Scanning Radiometer (AMSR) series operated by JAXA, which we introduced in the first article, conducts oceanographic observations not only in the waters around Japan, but also in the distant Arctic and Antarctic regions. In the Arctic, the North American and Eurasian continents surround the Arctic Ocean, while in the Antarctic, the Antarctic Ocean surrounds the Antarctica. Both the Arctic and Antarctic oceans show seasonal variations, with sea ice expanding as seawater freezes in winter and shrinking as sea ice melts in summer. When we think of “Antarctic ice”, the first thing that comes to mind may be the continental ice sheet formed by snow accumulation, but there are also areas of sea ice that surround the continent, formed by seawater and providing a stage for the development of ecosystems. Sea ice is used as an indicator of climate change because it lies between the atmosphere and the ocean and is affected by both air and water temperatures. The AMSR series allows us to capture not only the seasonal advance and retreat of sea ice cover, but also the long-term trend of change over 45 years from 1978 to the present, in combination with U.S. microwave radiometer data.
Figure 1 shows the seasonal changes in Arctic and Antarctic sea ice extent for each year obtained from these passive microwave observations. Because the seasons are reversed in the northern and southern hemispheres, the Arctic (Antarctic) sea ice cover shrinks (expands) most during the year in September (Hereinafter referred to as “summer” Arctic sea ice extent and “winter” Antarctic sea ice extent). The Arctic region experienced sea ice loss from the 1990s through the 2010s, with the smallest summer sea ice extent on record in 2012, but no comparable sea ice loss has occurred in 2023. On the other hand, the Antarctic sea ice extent showed almost the same seasonal variation until the 2010s, but in 2023, sea ice did not expand as much as in other years from around June, and in September, when sea ice extent is usually at its maximum, the minimum winter sea ice extent in the history of satellite observations was recorded. This unprecedented stagnation in the Antarctic sea ice advance is explained in this article.
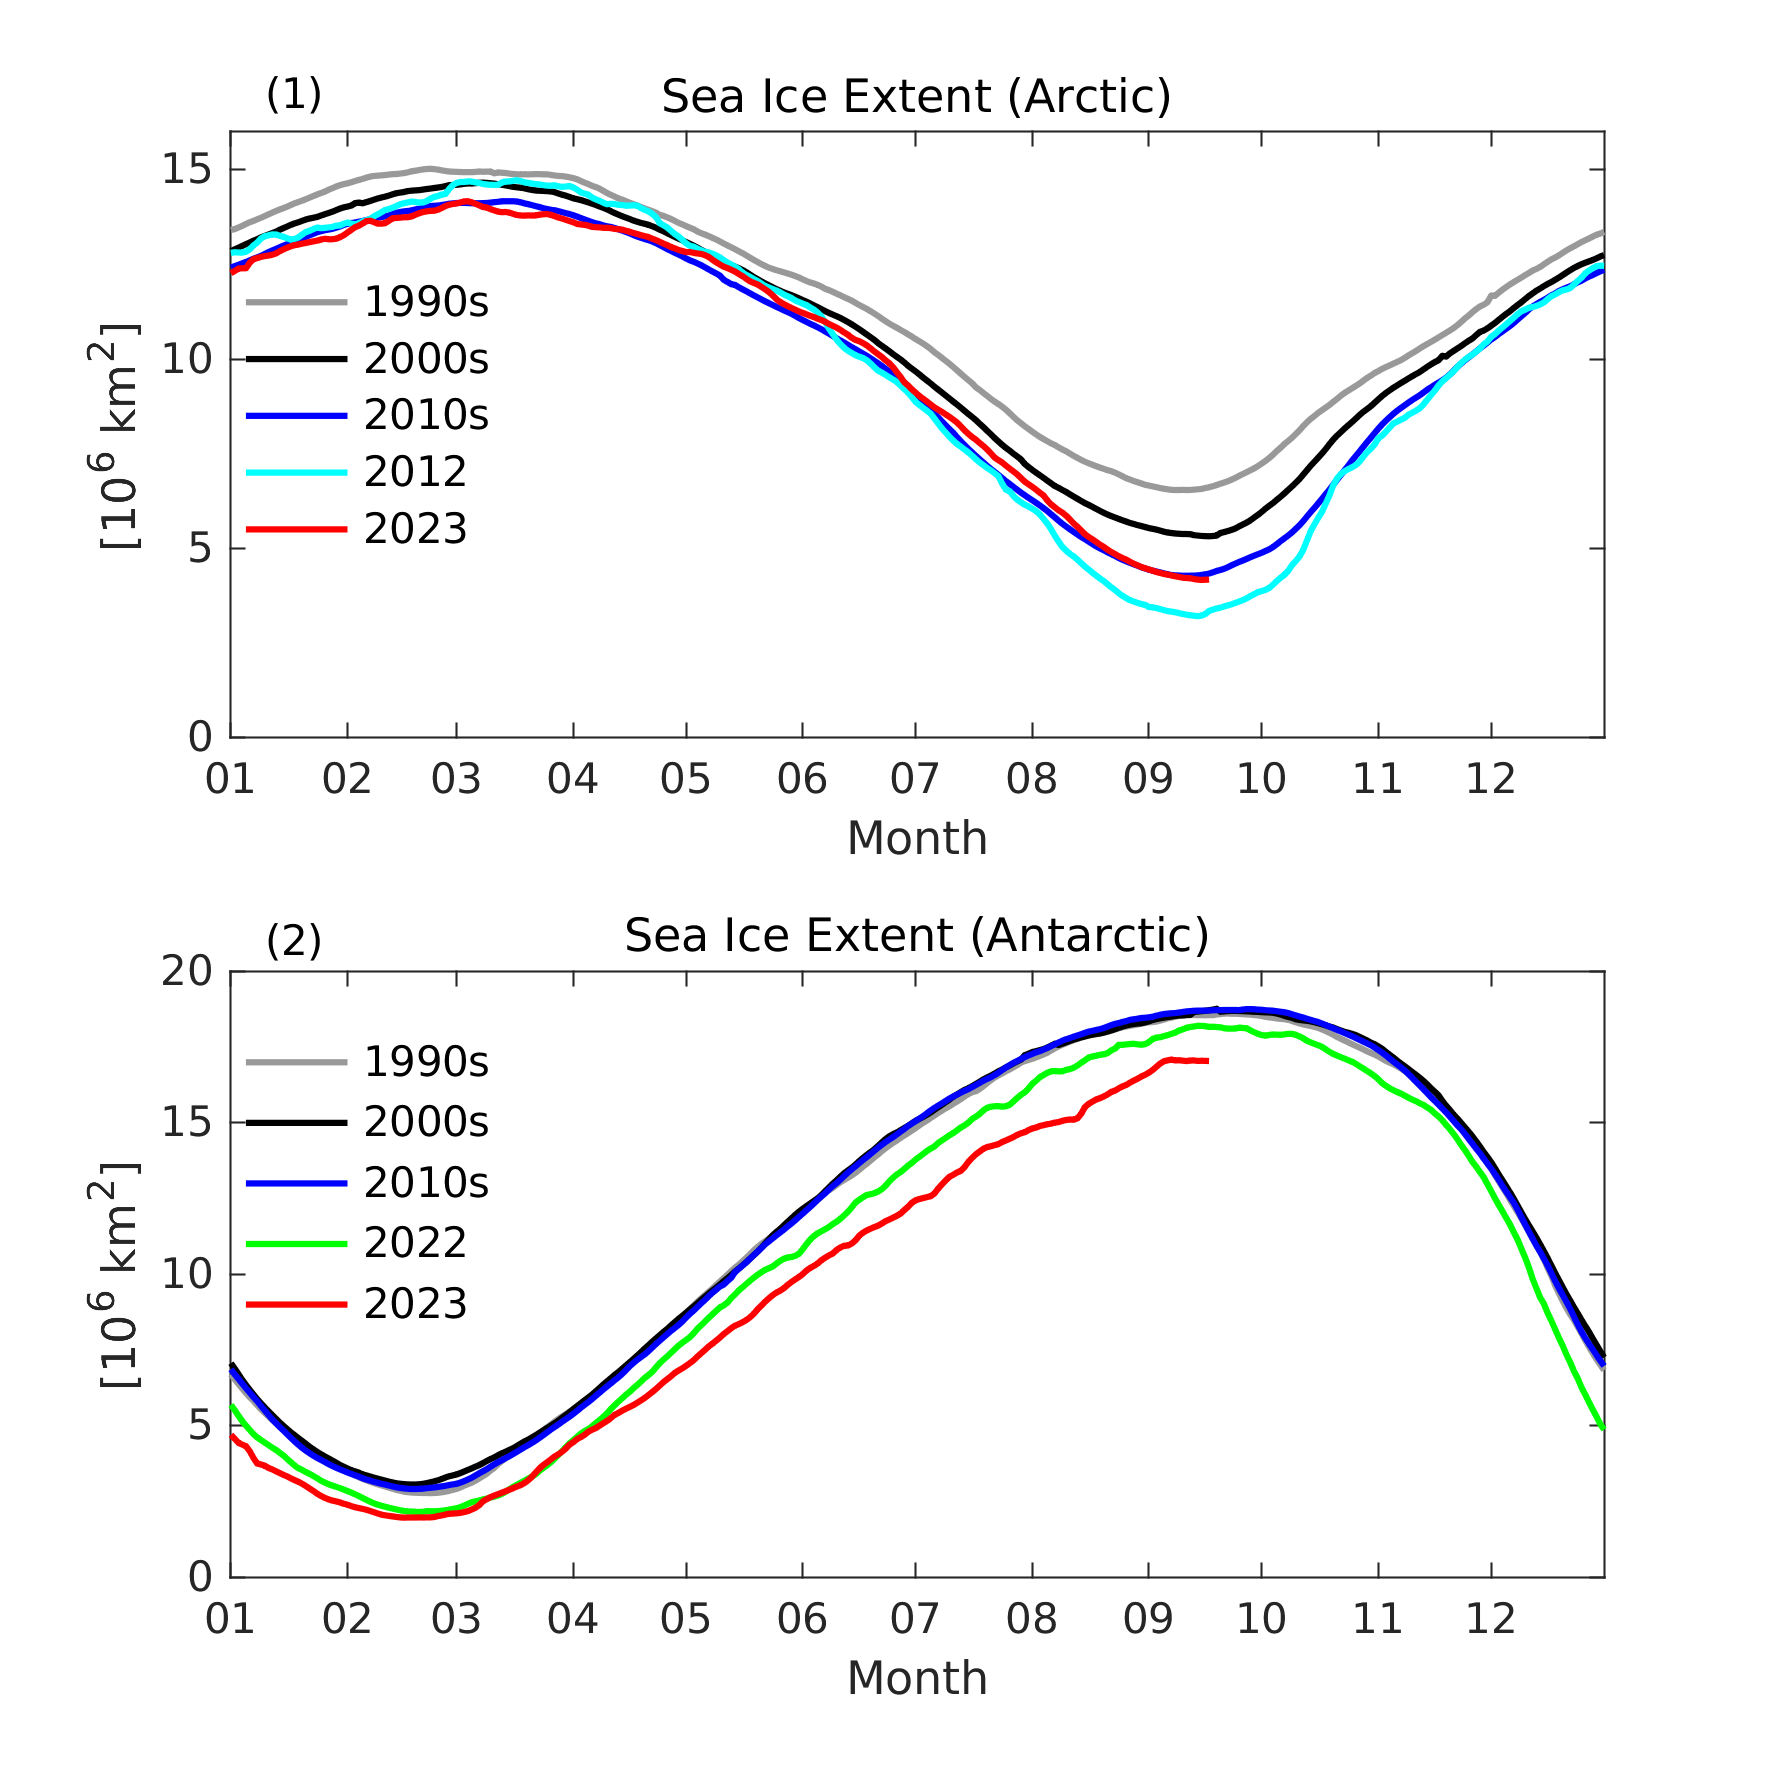
Figure 1 Seasonal changes in sea ice extent in the (1) Arctic and (2) Antarctic regions.
- Each year in September, the Arctic region (summer) has the smallest sea ice extent, and the Antarctic region (winter) has the largest sea ice extent.
- Arctic: A record minimum (summer) was recorded in 2012. This year it remains at the same level as in the 2010s.
- Antarctic: Record minimums (summer) continue to be recorded in 2022 and 2023. In addition, sea ice extent is much lower than usual this year between April and September, the period of sea ice expansion.
(Observation satellites: DMSP/SSM/I [January 1991―June 2002], Aqua/AMSR-E [June 2002―September 2011], Coriolis/WINDSAT [October 2011―July 2012], “SHIZUKU” GCOM-W/AMSR2 [July 2012-])
Changes in Antarctic sea ice extent
First, let us look at the interannual variability of the Antarctic summer sea ice extent. Figure 2 shows the minimum sea ice extent for the month of February calculated from microwave radiometer data, including the AMSR series. As mentioned above, sea ice extent in the Arctic Ocean has been on a decreasing trend, while in the Antarctic Ocean it has been on a slightly increasing trend until about 2015. The cause of the difference in trend between the two is not entirely clear, but it is thought to be related to the fact that Antarctic sea ice is more affected by natural variability than anthropogenic climate change due to differences in geographic conditions (*1). In any case, the long-term trend in the Antarctic sea ice extent has not been as dramatic as in the Arctic and has not received as much attention.
The trend in Antarctic sea ice extent began to change in the early spring of 2016 (around November). Higher sea surface temperatures in the Antarctic Ocean and warm air advection from the north led to a decrease in sea ice extent (*2, *3), with a record minimum in February 2017, as shown in Figure 2. The higher ocean surface temperatures are thought to be the result of a combination of changes in two “climate modes (see Supplement 1)”: the remote “El Niño-Southern Oscillation” and the more local “Southern Annular Mode” (*2). Although it has been considered that the minimum may have been caused by a short-term event, sea ice extent has consistently remained low since then, reaching a new record minimum in 2022 and 2023. A very recent study suggests that the dramatic decline in Antarctic sea ice that began in 2016 may be primarily due to long-term warming of the Antarctic Ocean associated with greenhouse gas emissions, rather than a change in climate mode as described above (*4).
Let us return to Figure 1 to take a closer look at the seasonal changes in sea ice extent this year compared to last year. As shown in Figure 1(2), the sea surface in the Antarctic Ocean usually begins to freeze around March, and the sea ice extent peaks around from September to October. In contrast, this year’s sea ice extent from March to September was consistently well below the historical average. While sea ice extent has been below normal for the past seven years, the year 2023 in particular is characterized by a slowdown in sea ice extent expansion (in the Antarctic winter) not seen in previous years.
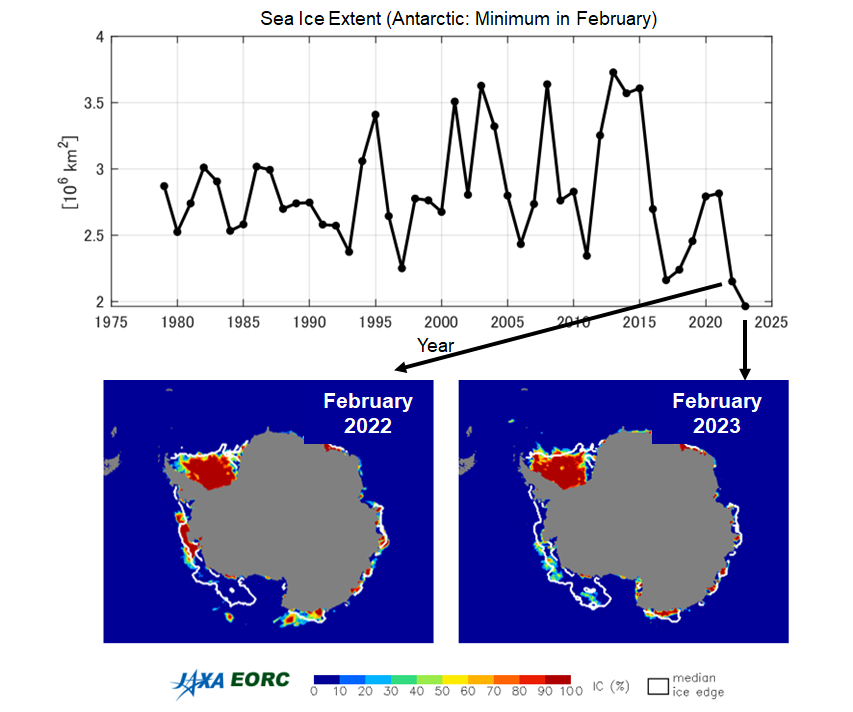
Figure 2. (Upper graph) Annual minimum Antarctic sea ice extent
- Sea ice extent was on a slight upward trend until about 2015, but has been declining since then.
(Lower figures) Sea ice concentration distribution observed by AMSR2 in February 2022 and 2023, when sea ice extent continued to be the lowest on record.
- The gray area shows Antarctica, and the white line shows the average February sea ice extent over the past 45 years.
Causes of sea ice distribution and extent stagnation in winter 2023
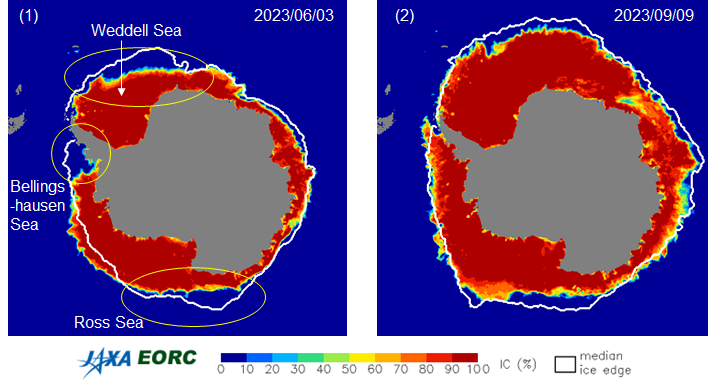
Let’s take a closer look at where sea ice extent is stagnating from the June and September 2023 sea ice distributions (Figure 3). As shown in Figure 3(1), Antarctica is bounded on the left by the Bellingshausen Sea, on the top left by the Weddell Sea, and on the bottom by the Ross Sea. Comparing these areas with the sea ice extent in normal years (white line), we can see that the south-to-north sea ice expansion is significantly weakened in June. In September, when sea ice extent is at its maximum, the Bellingshausen Sea has recovered to levels similar to previous years, but the Weddell Sea, Ross Sea, and other areas continue to have generally weak sea ice extensions.
Although the cause of the significantly smaller Antarctic winter sea ice extent in 2023 compared to previous years is still unknown, one possible factor is that the heat stored in the ocean (ocean heat content) due to the ongoing summer sea ice retreat since around 2016 (Figure 2) has slowed sea ice production. In particular, if there is less sea ice in the summer than in a normal year, the sea surface is exposed to more solar radiation and absorbs more of it. This increases the ocean heat content, preventing the formation of sea ice in autumn and winter. In this way, the amount of solar radiation absorbed by the ocean increases with the exposed open water fractions, leading to the further decrease in sea ice. This effect is known as the “sea ice/ocean albedo feedback” (albedo: ratio of the energy of reflected light to the energy of incident sunlight). Given that a correlation between minimum Antarctic summer sea ice extent and maximum winter sea ice extent has indeed been observed for the period 2016―2022 (*4), it seems quite possible that the above feedbacks between sea ice and the ocean are related.
Figure 3. Sea ice concentration distribution in the Antarctic region observed by AMSR2 (1) on June 3, 2023 and (2) on September 9, 2023.
- The gray area in the figure shows the Antarctic continent, and the white line shows the average extent of sea ice on each day over the past 45 years.
- (1) shows significant sea ice loss in the area marked by the yellow circle.
- In the distribution (2), where three months have passed, the overall overhang continues to be weak.
Impacts of Antarctic sea ice loss
What would happen if Antarctic sea ice were to begin to decline at a significant rate? Regarding the impact on ecosystems, we would like to introduce a study on a colony of emperor penguins published in Communications Earth & Environment, a journal in the field of earth and planetary sciences (*5). Emperor penguins lay their eggs from May to June on landfast sea ice that is attached to the shore and does not move as a breeding ground, and the hatched chicks fledge during December and January. Therefore, for successful breeding, the landfast ice must be stable from winter to early spring. However, in 2022, when spring sea ice extent was at an all-time low, it was reported that four of the five colonies had lost all their Emperor penguin chicks due to the loss of solid ice in the Bellingshausen Sea.
What about the impact on the oceans? As mentioned at the beginning of this article, Antarctica is covered by a thick layer of ice, up to 4000 m thick, called the ice sheet. Ice sheets flow to the sea under their own weight, forming ice shelves (ice that is attached to land and floats in the sea). Since ice shelves are connected to seawater at the bottom, higher temperatures in the Antarctic Ocean due to sea ice loss are likely to accelerate ice shelf melting and contribute to sea level rise.
In addition, “coastal polynya”, areas that produce large amounts of sea ice, are ubiquitous around Antarctica. When seawater freezes to form sea ice, much of the salt is released into the ocean below, so coastal polynya is also a region where highly saline water forms. The high-salinity, low-temperature water formed there becomes dense water, which sinks to the ocean depths and eventually spreads to the bottom layers of the entire global ocean. Higher surface ocean temperatures due to sea ice loss and subsequent freshening of upper oceans due to melting ice shelves could suppress the formation of high-density water, potentially leading to a weakening of the global deep ocean circulation. In fact, in 2017, a Japanese polar research group found that ice shelf melting was accelerated by increased ocean heat storage due to reduced summer sea ice, which simultaneously affected the formation of high-density water (*6). This year, 2023, the changes are more severe than in 2017. There’s concern about more significant impacts on ice shelves and oceans.
Summary
It remains to be determined whether the changes in Antarctic sea ice that have persisted since the late 2010s, and which were dramatically reduced this year, are of natural or anthropogenic origin, a temporary anomaly, or indicative of a long-term regime shift (a rapid transition from one state to another) in the Antarctic sea ice system. In order to elucidate the causes of these issues and to ensure that future trends in sea ice extent are understood, JAXA will continue to conduct continuous observations using the AMSR series and cooperate with related universities and research institutes.
Writing: Kazuki Nakata and Eri Yoshizawa, JAXA/EORC
Acknowledgements
We would like to thank Professor Keiichiro Ohshima of Hokkaido University for his help in preparing this article.
Reference:
*1 National Snow and Ice Data Center, How does Antarctic sea ice differ from Arctic sea ice? January 7, 2022.
https://nsidc.org/learn/ask-scientist/how-does-antarctic-sea-ice-differ-arctic-sea-ice#:~:text=First%2C%20the%20Arctic%20is%20an,has%20shown%20no%20clear%20trend.
*2 Stuecker, M. F., Bitz, C. M., & Armour, K. C. Conditions leading to the unprecedented low Antarctic sea ice extent during the 2016 austral spring season, Geophys. Res. Lett., 44, 9008–9019 (2017).
https://doi.org/10.1002/2017GL074691
*3 Turner, J. et al. Record Low Antarctic Sea Ice Cover in February 2022. Geophys. Res. Lett. 49, (2022).
https://doi.org/10.1029/2022GL098904
*4 Purich, A. & Doddridge, E.W. Record low Antarctic sea ice coverage indicates a new sea ice state. Commun. Earth Environ., 4, 314 (2023).
https://doi.org/10.1038/s43247-023-00961-9
*5 Fretwell, P.T., Boutet, A. & Ratcliffe, N. Record low 2022 Antarctic sea ice led to catastrophic breeding failure of emperor penguins. Commun. Earth Environ. 4, 273 (2023).
https://doi.org/10.1038/s43247-023-00927-x
*6 Shigeru Aoki. et al., 2022 Warm surface waters increase Antarctic ice shelf melt and delay dense water formation. Commun. Earth Environ. 3, 142 (2022)
https://www.nature.com/articles/s43247-022-00456-z
Supplement 1: About Climate Modes
Climate Modes are phenomena with specific spatial patterns in long-term changes in atmospheric pressure and other weather parameters. The El Niño-Southern Oscillation, a typical example, refers to a phenomenon in which sea level pressure changes in conjunction near Indonesia and in the eastern South Pacific. On the other hand, the Southern Annular Mode refers to a phenomenon in which atmospheric pressure in the Antarctic region and the mid-latitudes of the Southern Hemisphere fluctuate with opposite trends.
Search by Year
Search by Categories


Tags
-
#Earthquake
-
#Land
-
#Satellite Data
-
#Aerosol
-
#Public Health
-
#GCOM-C
-
#Sea
-
#Atmosphere
-
#Ice
-
#Today's Earth
-
#Flood
-
#Water Cycle
-
#AW3D
-
#G-Portal
-
#EarthCARE
-
#Volcano
-
#Agriculture
-
#Himawari
-
#GHG
-
#GPM
-
#GOSAT
-
#Simulation
-
#GCOM-W
-
#Drought
-
#Fire
-
#Forest
-
#Cooperation
-
#Precipitation
-
#Typhoon
-
#DPR
-
#NEXRA
-
#ALOS
-
#GSMaP
-
#Climate Change
-
#Carbon Cycle
-
#API
-
#Humanities Sociology
-
#AMSR
-
#Land Use Land Cover
-
#Environmental issues
-
#Quick Report
-
#GOSAT-GW
Related Resources


Related Tags
Meteorology and the Environment Related Articles
-
 Meteorology and the Environment 2025.11.05 Wed The Breakup of the World’s Largest Iceberg, “A23a”: The Trajectory of Iceberg A23a Observed by “GCOM-W”, “ALOS-2”, “ALOS-4” and the Latest Satellite, “GOSAT-GW”
 -
 Meteorology and the Environment 2025.10.02 Thu Satellite Observations and Flood Forecasts for Line-shaped Rainbands in August 2025
 -
 Meteorology and the Environment 2025.05.20 Tue February 2025: Global Sea Ice Extent Reaches its Lowest in the History of Satellite Observations
 -
 Meteorology and the Environment 2023.08.31 Thu Climate Change 2023 (1) : Sea Surface Temperature Rise and El Niño Event
Stay Connected
