


Meteorology and the Environment
2025.05.20 Tue
February 2025: Global Sea Ice Extent Reaches its Lowest in the History of Satellite Observations
May 20, 2025
Japan Aerospace Exploration Agency
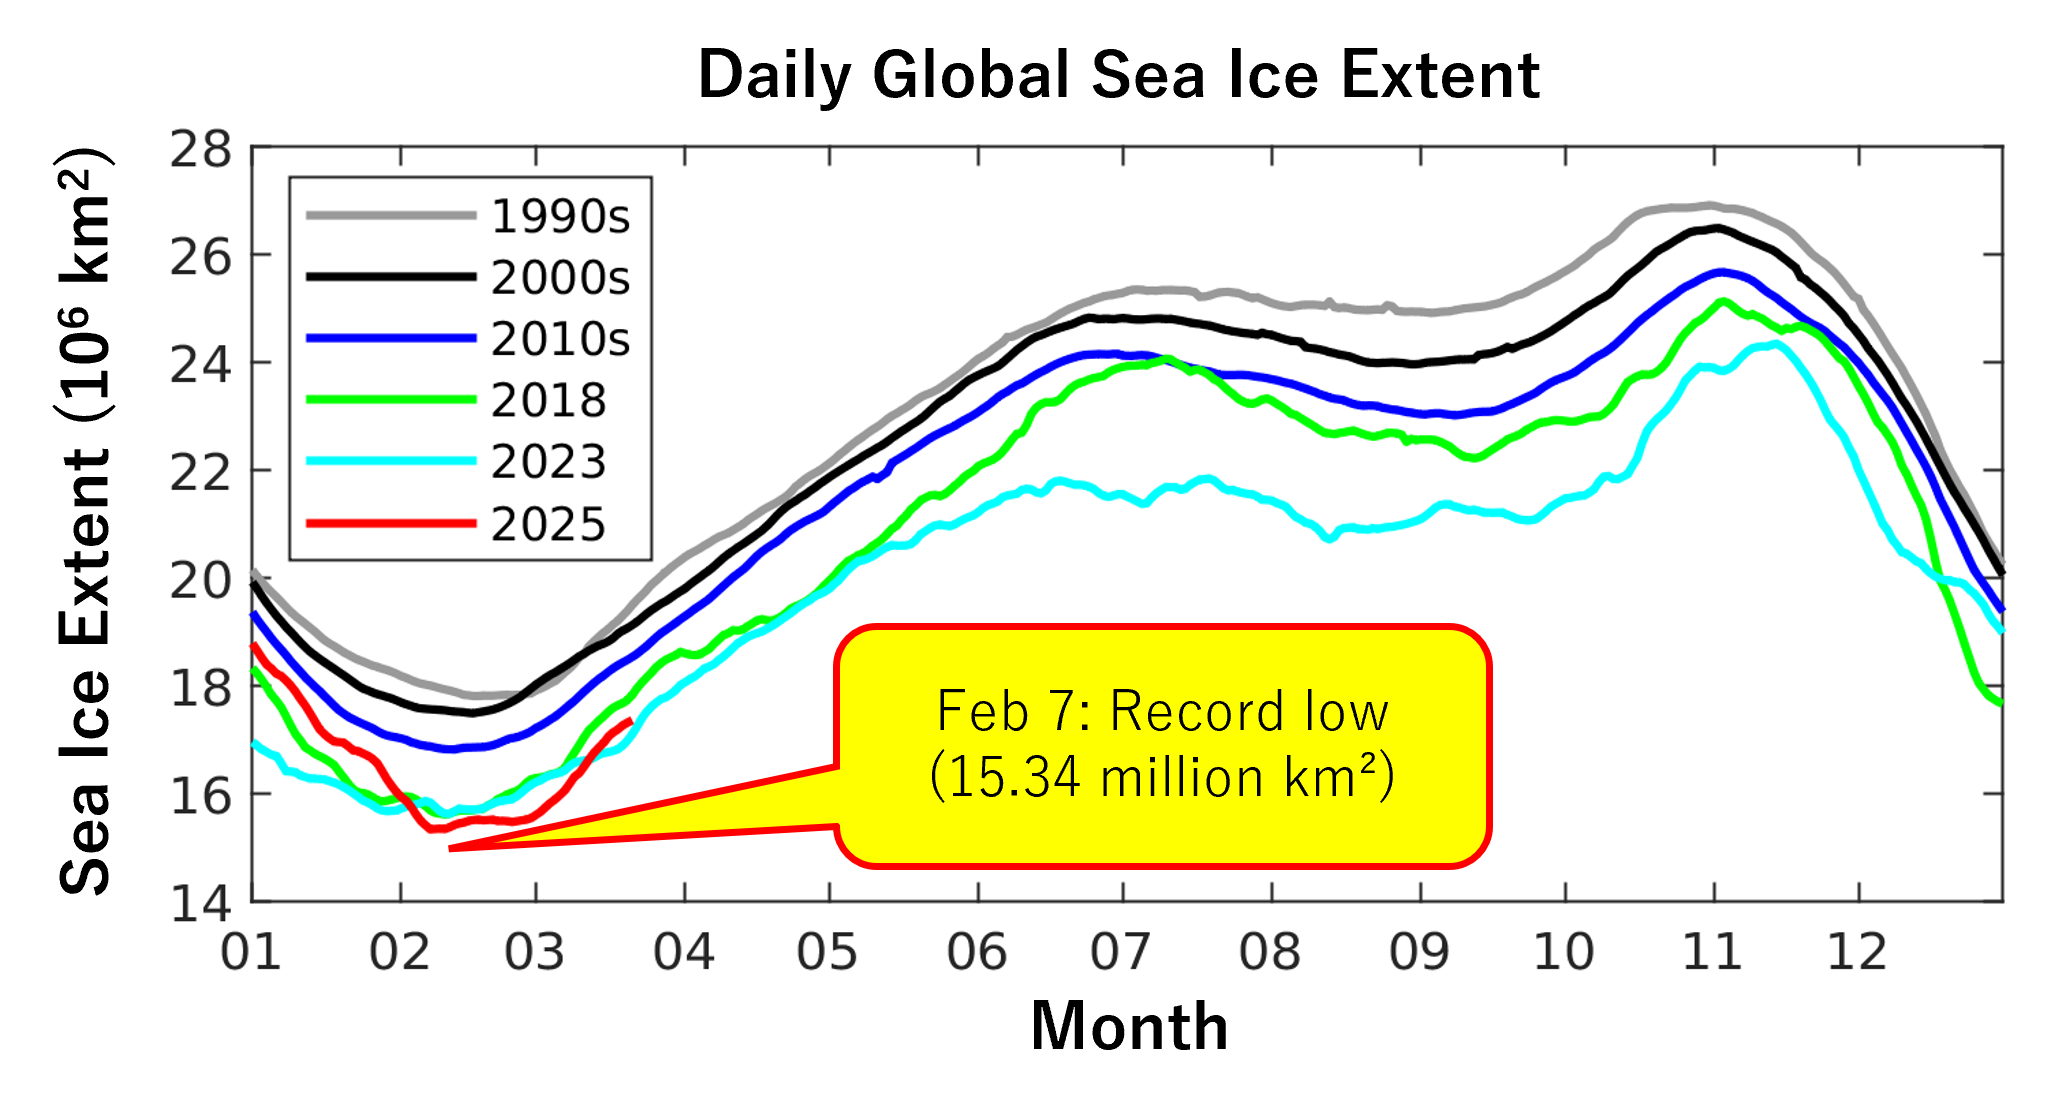
On February 7, 2025, the sea ice extent (*1) on the entire Earth, including in the Arctic and Antarctic regions, reached a record low of 15,343,800 square kilometers, as measured by satellite since 1979. This represents a decrease of 1.5 million square kilometers compared to the average minimum value for the 2010s, which was 16,824,500 square kilometers. In other words, an area of sea ice approximately four times the size of Japan has disappeared in just 10 years.
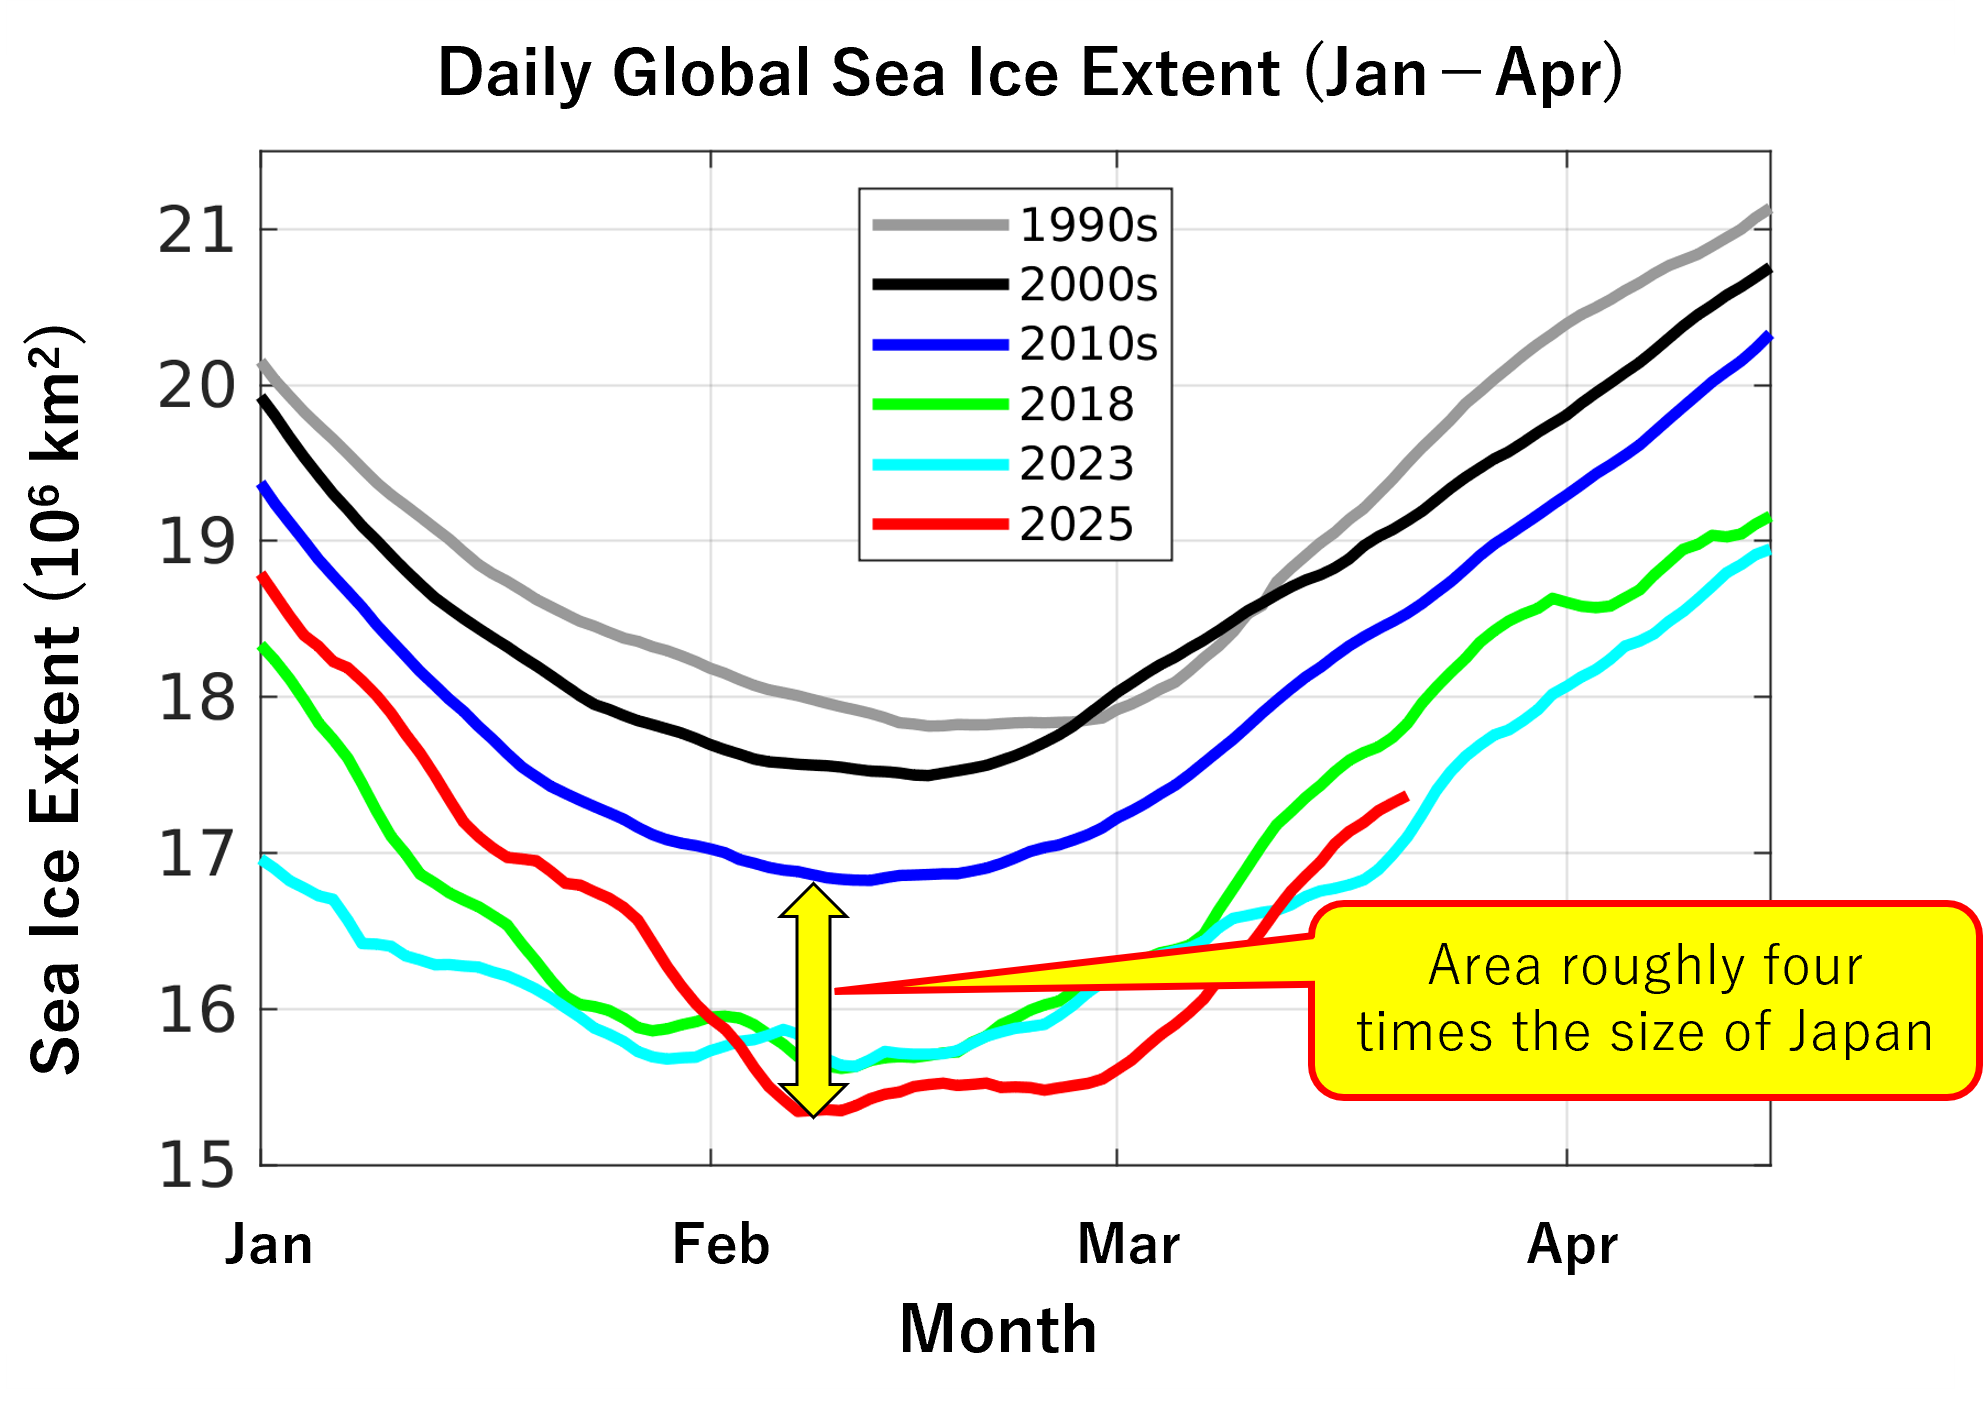
The red, light blue, and green lines indicate the years when the annual minimum value of global sea ice extent was among the three lowest in the history of satellite observations.
Suppressed Arctic Winter Sea Ice Expansion
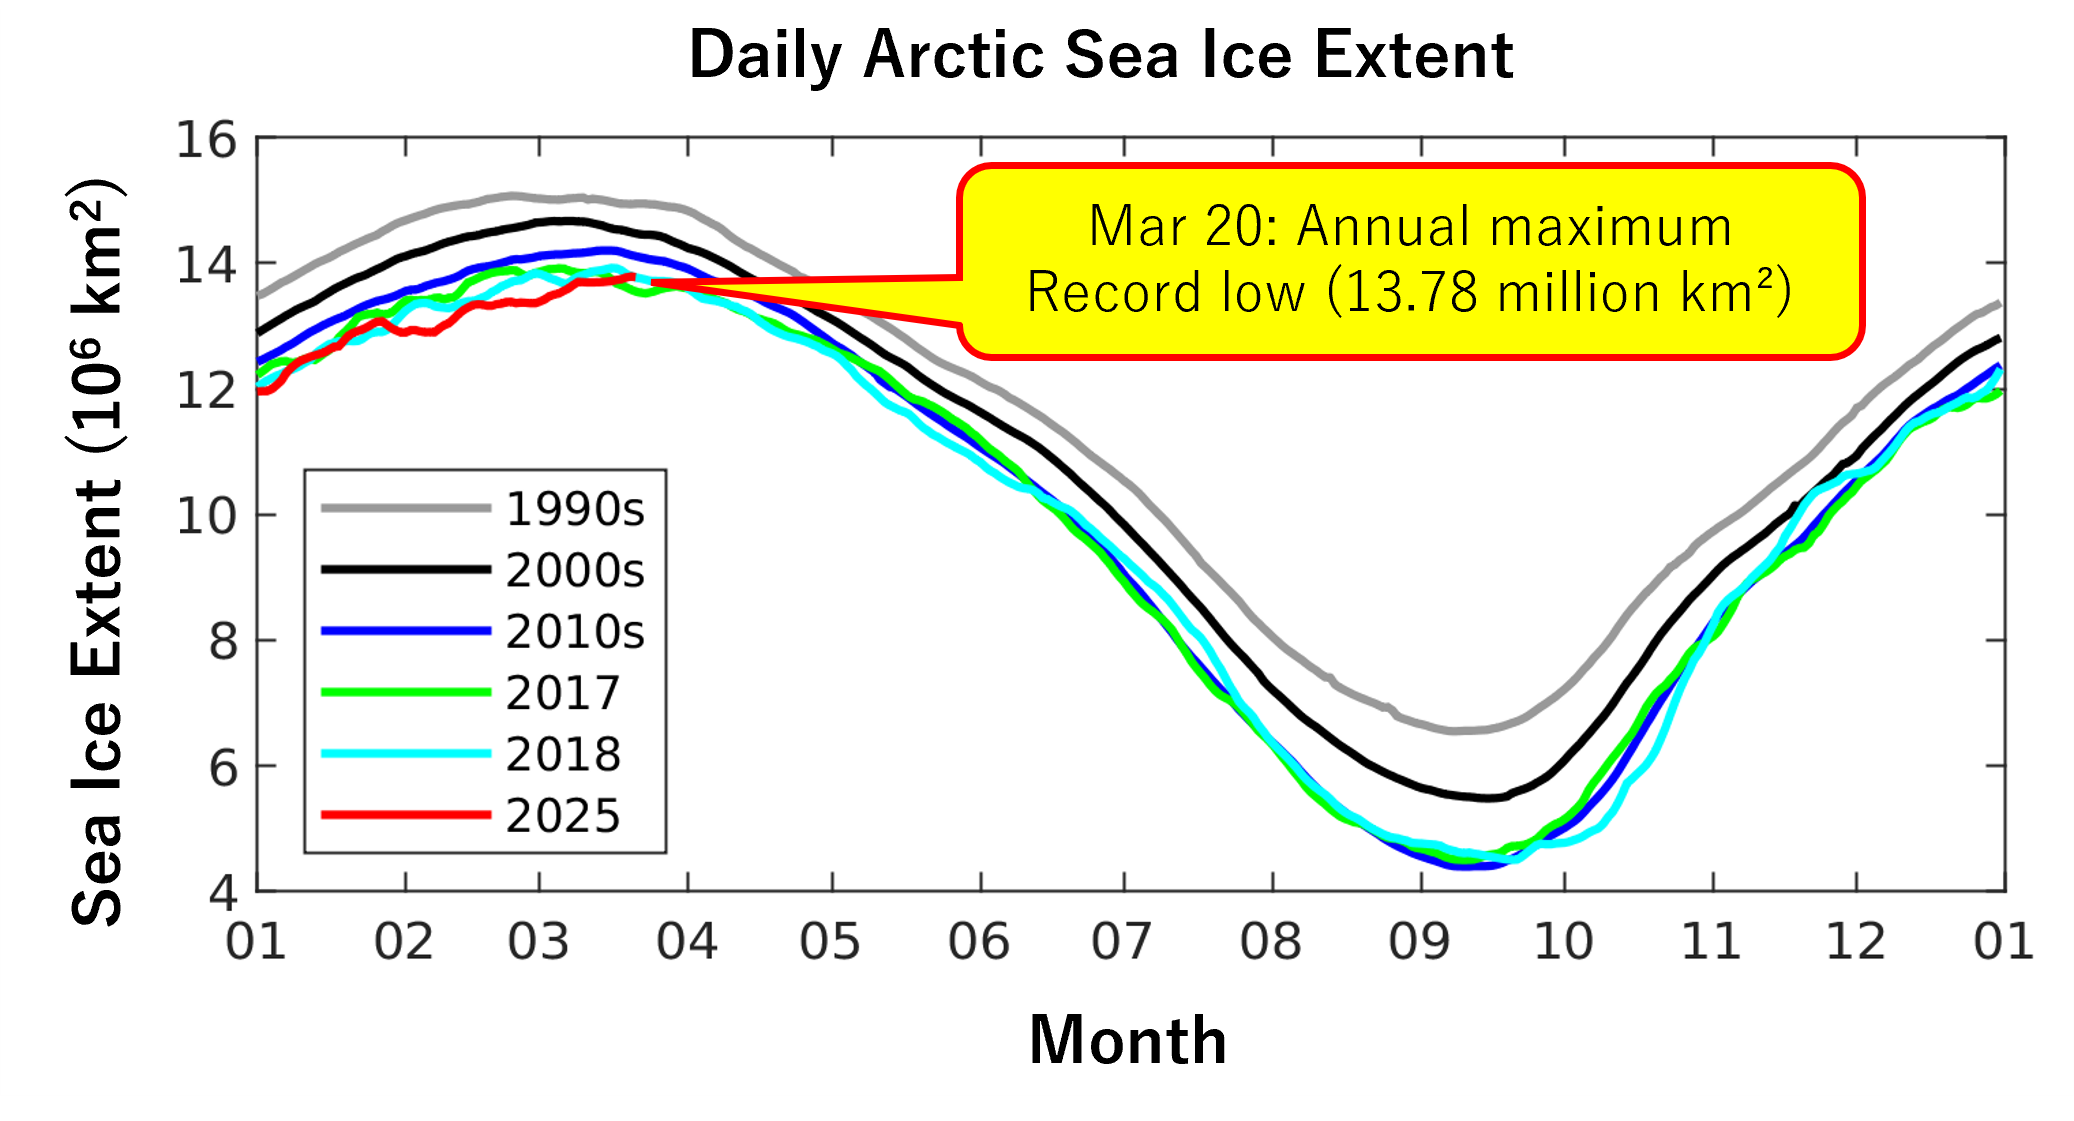
The red, light blue, and green lines indicate the years when the annual maximum extent of Arctic sea ice was among the three lowest in the history of satellite observations.
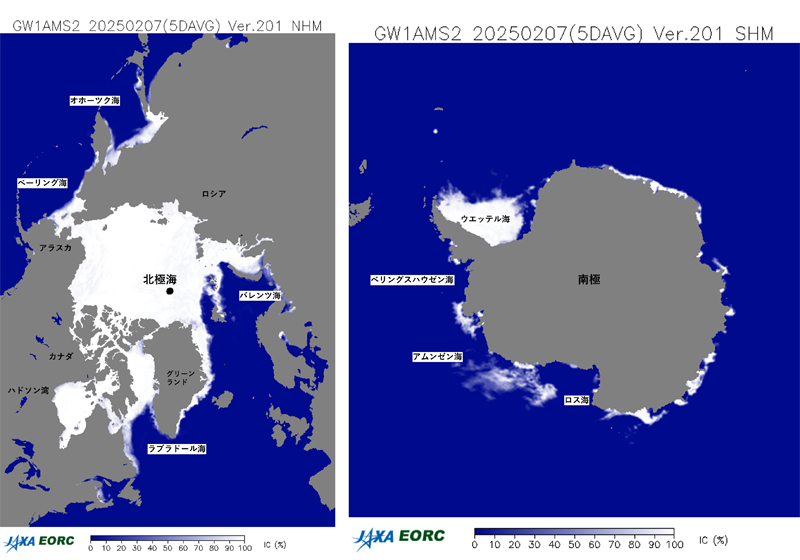
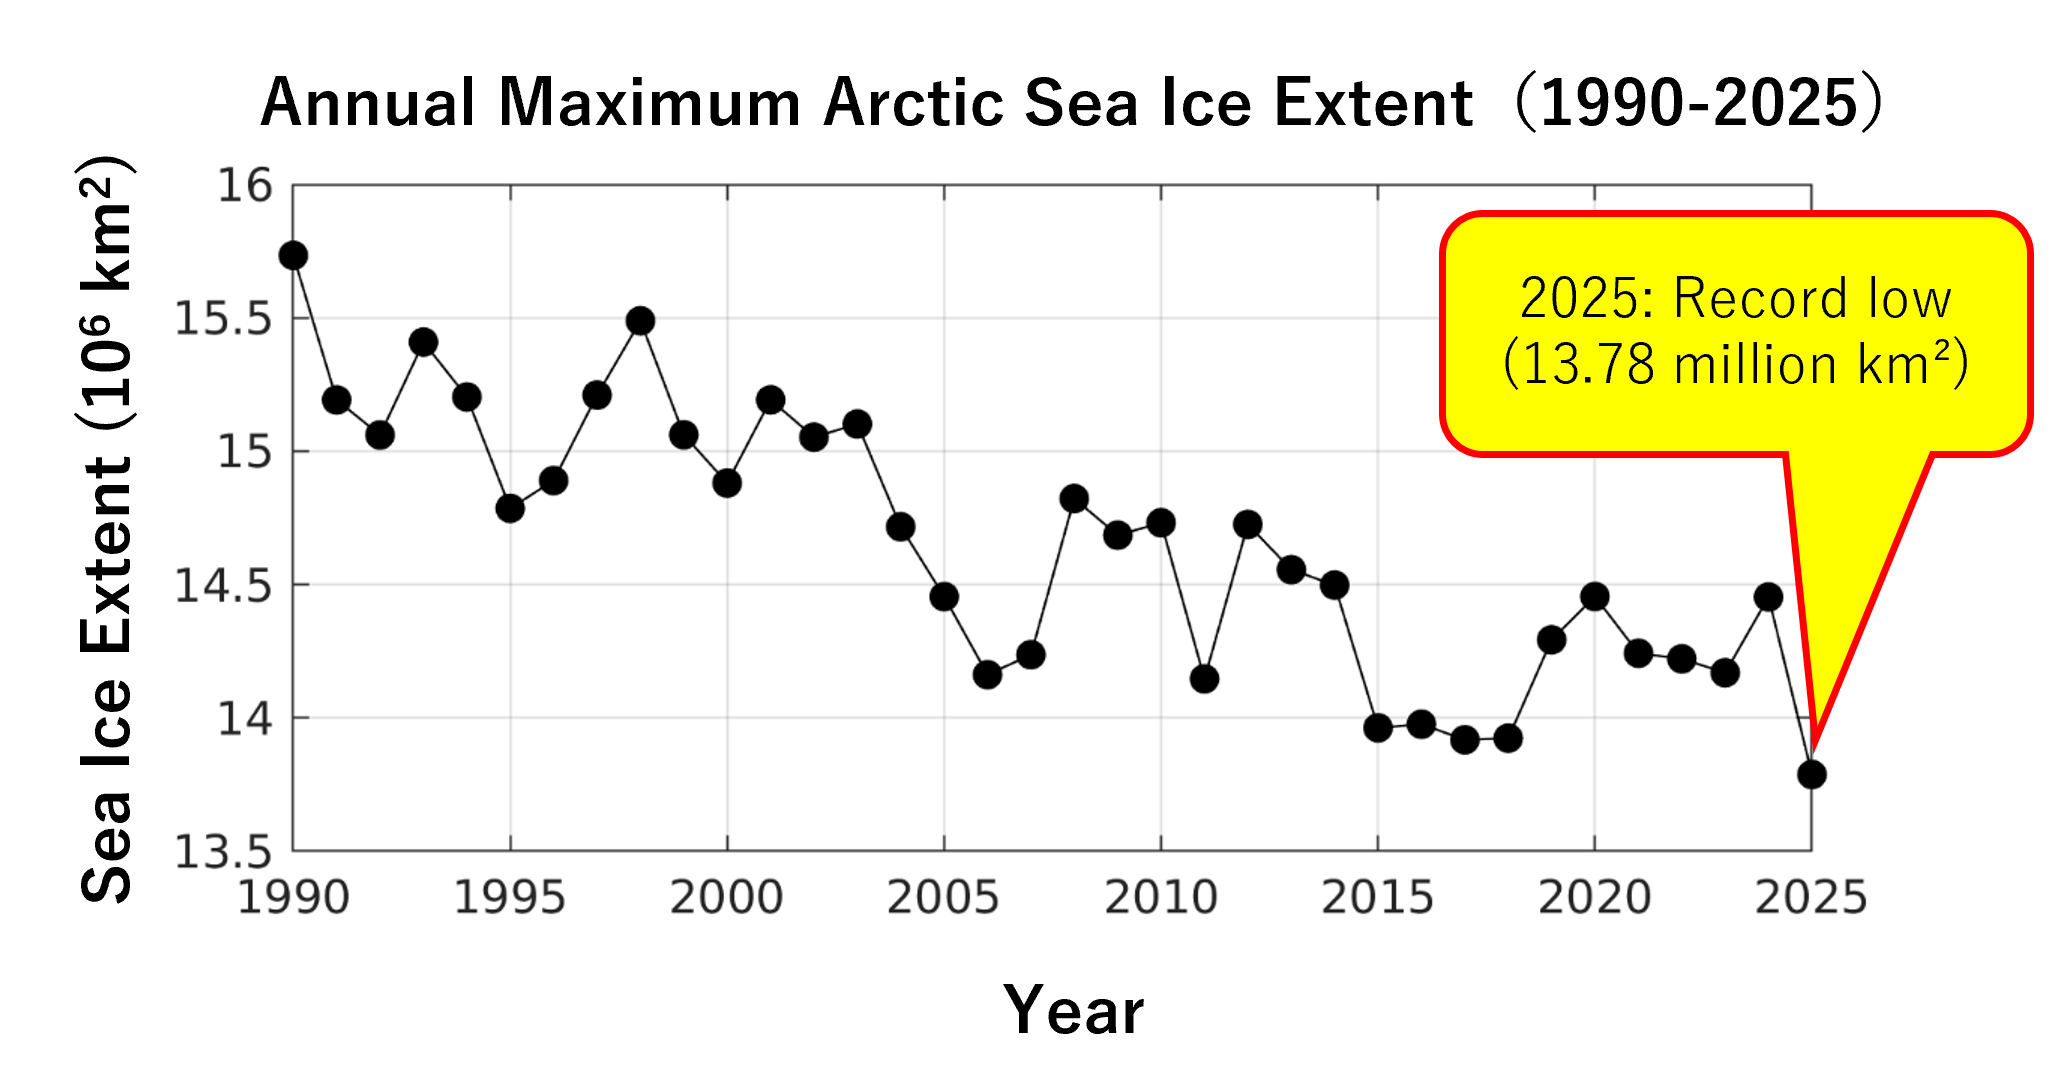
As shown in Figure 2, March is generally the month when the Arctic sea ice extent is at its annual maximum. In 2025, the Arctic sea ice extent reached its annual maximum of 13,787,800 square kilometers on March 20. As shown in Figure 3, this is the lowest Arctic winter sea ice extent (annual maximum) ever recorded by satellite observations.
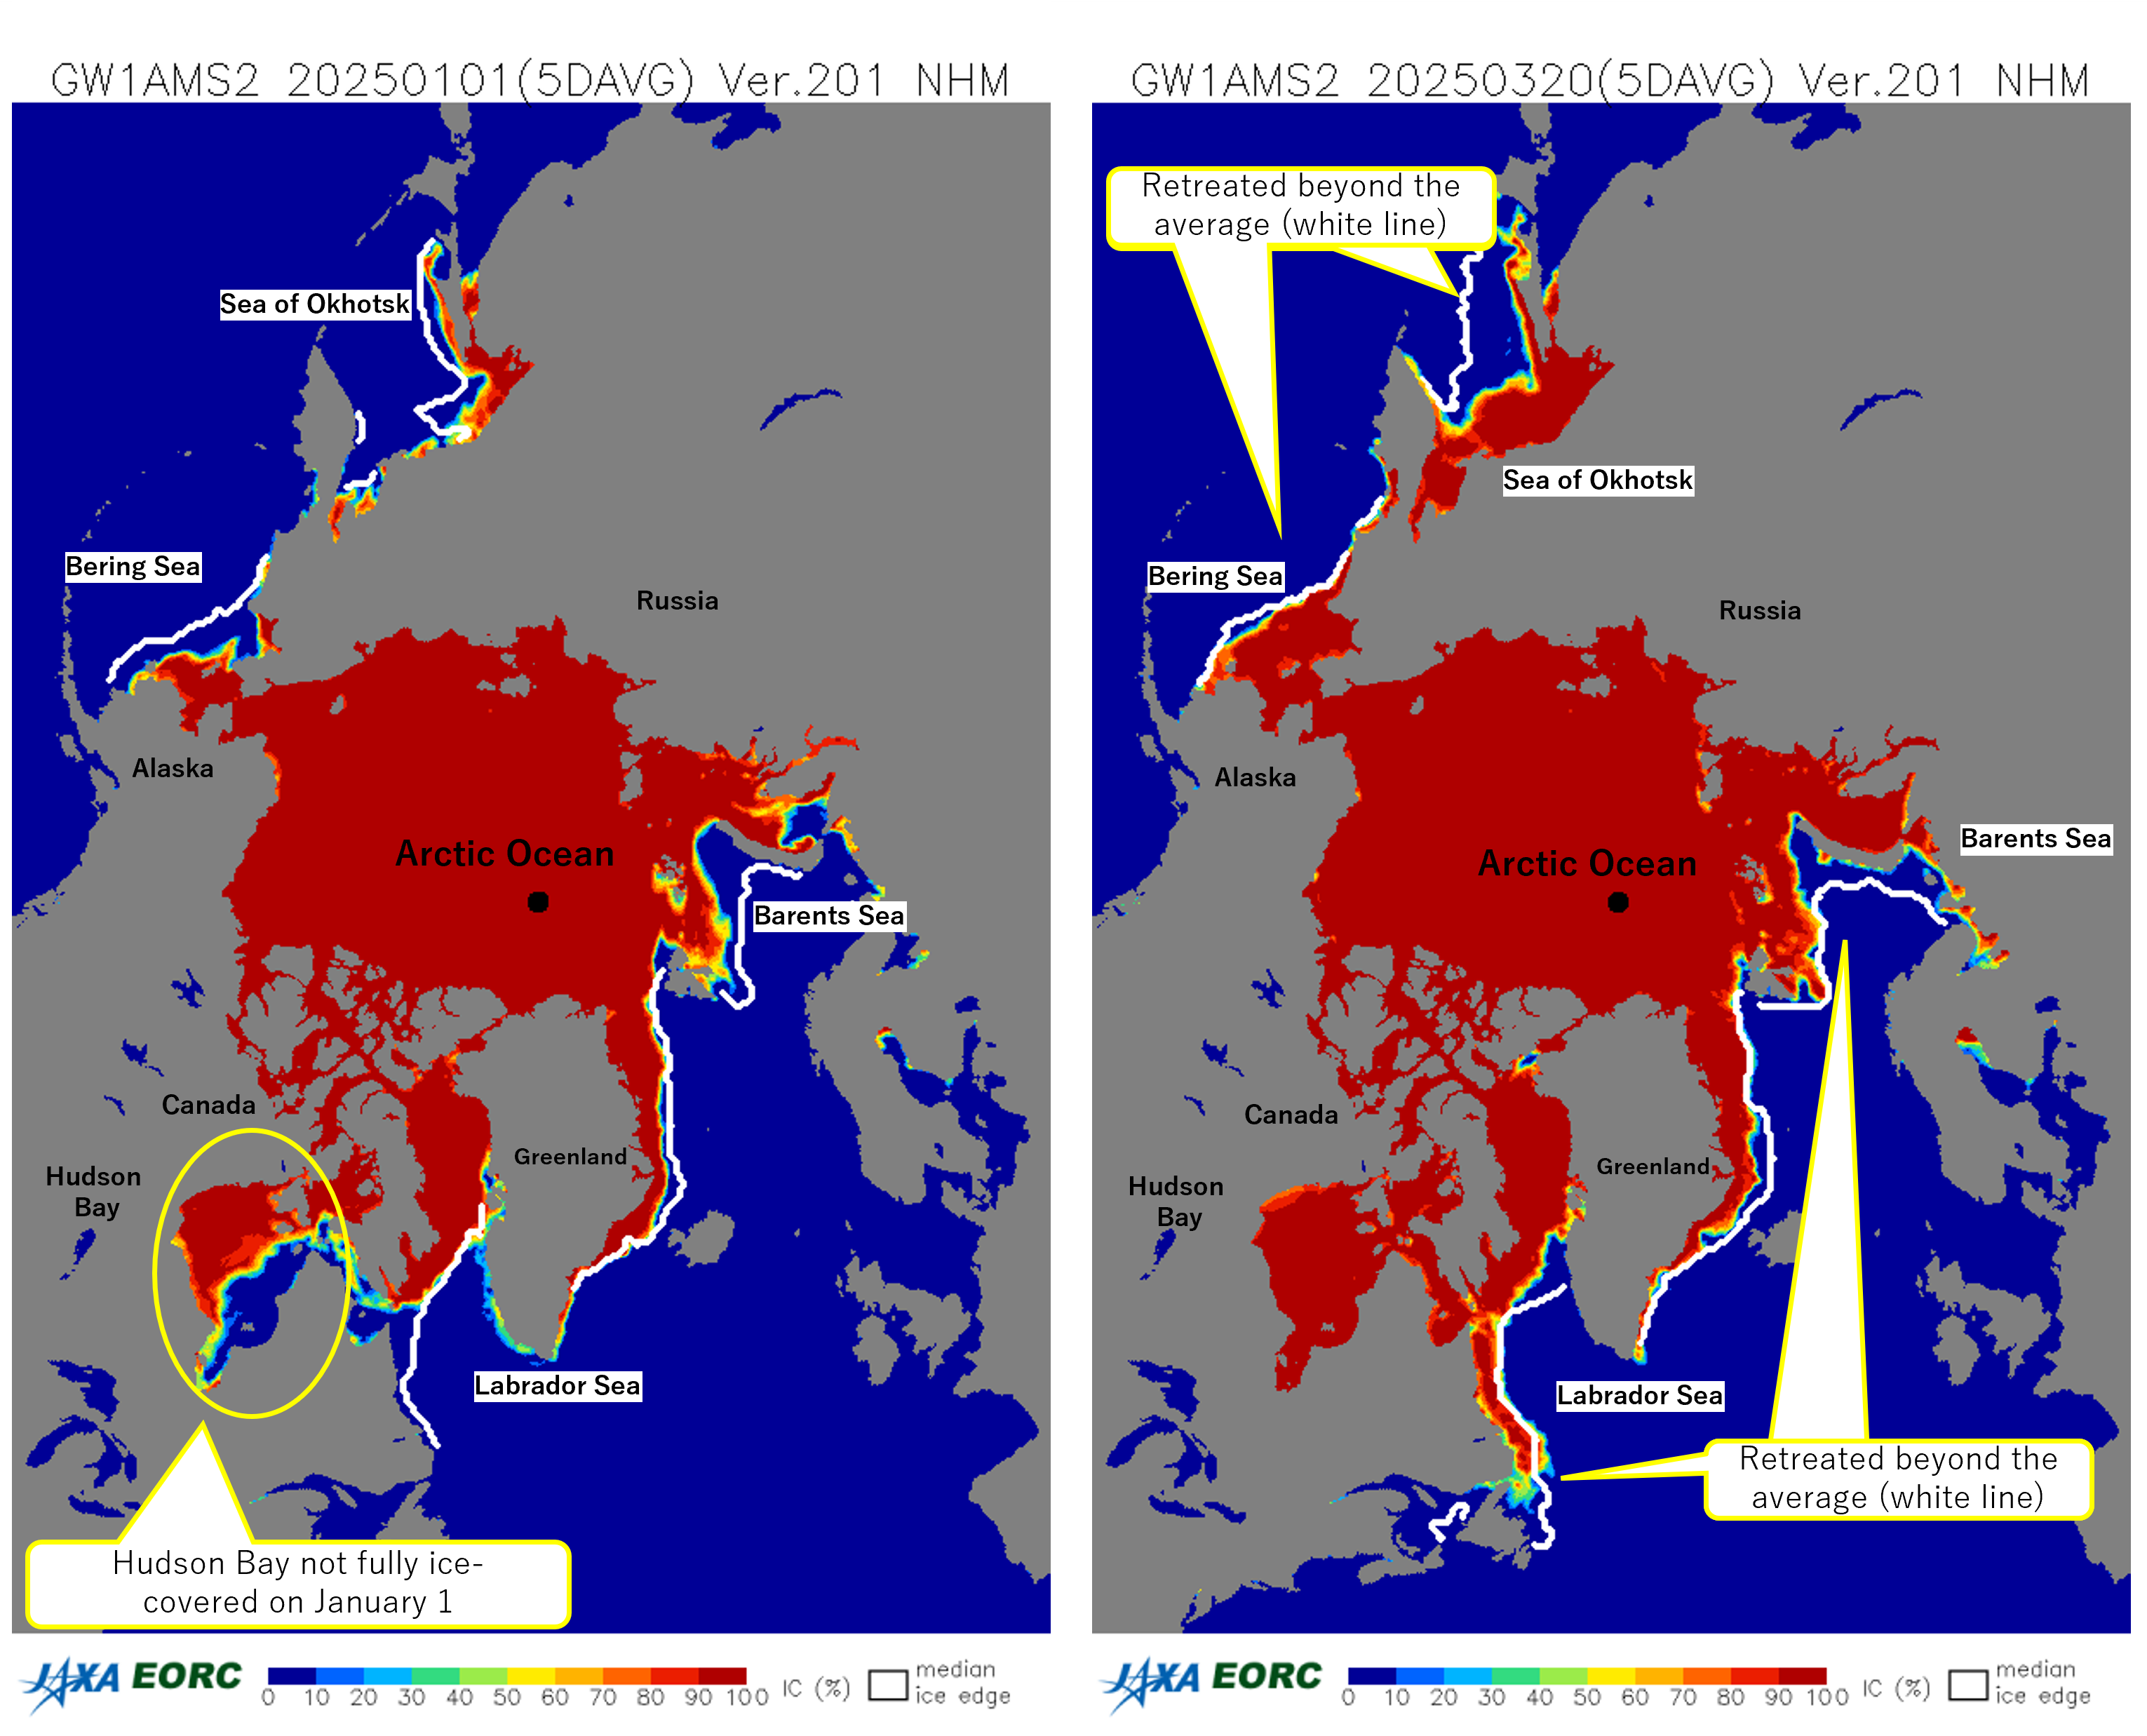
(Left) Freezing delayed over Hudson Bay on January 1, 2025
(Right) The annual maximum value on March 20, 2025
(Sea ice concentration: the percentage of sea ice cover within a pixel)
Examining the distribution of sea ice separately for each ocean reveals that, while Hudson Bay is usually entirely covered by sea ice between December and January, freezing was significantly delayed this year (Figure 4, left). From late January to early February, Hudson Bay eventually became completely covered in sea ice. However, due to the delayed expansion of sea ice in the Sea of Okhotsk, Bering Sea, Barents Sea, and Labrador Sea, the winter sea ice extent remained lower than average even after February (Figure 4, right). For more information on why this year’s Arctic sea ice extent was so low, please refer to the JAXA-NIPR joint press release dated April 18, 2025 (URL: https://www.jaxa.jp/press/2025/04/20250418-1_j.html).
Delayed Arrival of Drift Ice on the Shores of the Sea of Okhotsk
The reduction in sea ice extent in the Sea of Okhotsk affects the arrival of drift ice near the coast of Hokkaido. The Abashiri Local Meteorological Observatory announced the “first date of drift ice in sight”(*2) for 2025 on February 15. This date is 24 days later than average and the latest since records began in 1946 (*3). Additionally, the “first date of drift ice on shore” (*4) was announced on February 17, which was 13 days later than average and the fourth latest observation on record. According to a sea ice researcher who observed drift ice in the Sea of Okhotsk in February of this year, the size of each sea ice floe tended to be smaller than usual(*5).
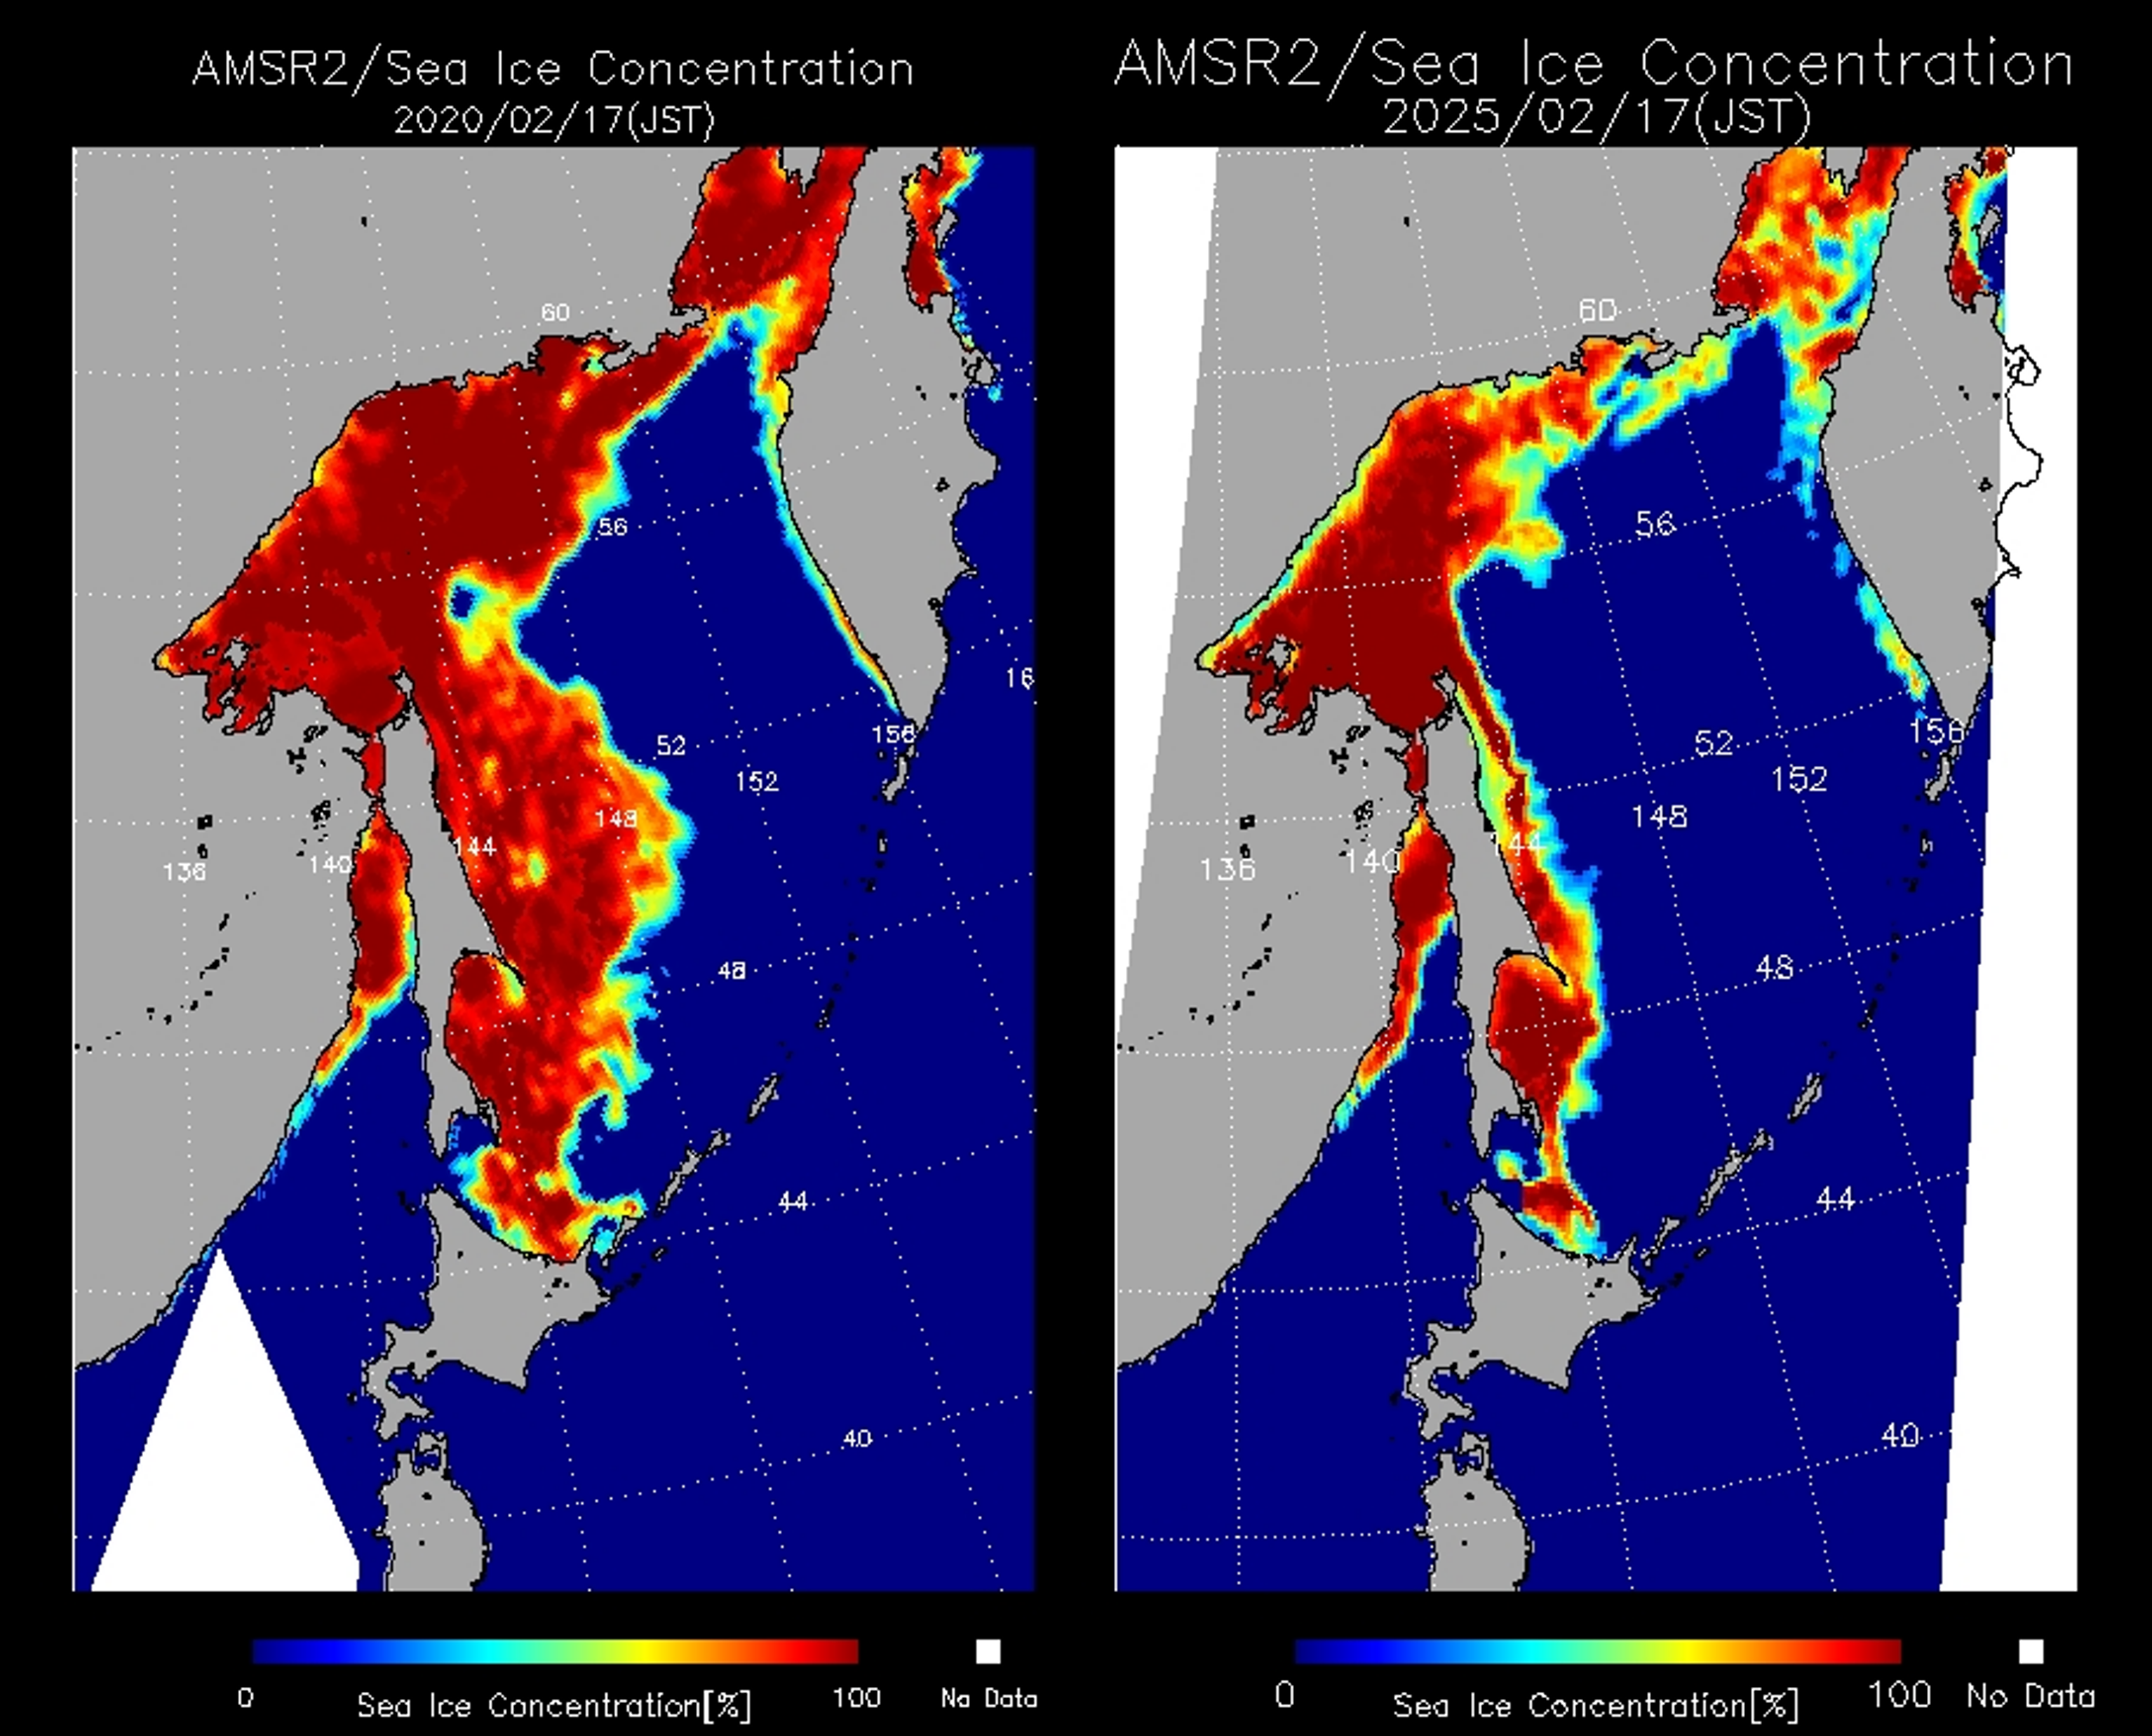
Now, let’s look at the distribution of sea ice in the Sea of Okhotsk on February 17, the first date of drift ice on shore (Figure 5). The distribution of sea ice in the Sea of Okhotsk in 2025 (right) appears to be significantly lower than in 2020 (left), which was a near-average year.
Antarctic Sea Ice Extent Continues to Decline
The red, light blue, and green lines indicate the years when the annual minimum value of Antarctic sea ice extent was among the three lowest in the history of satellite observations.
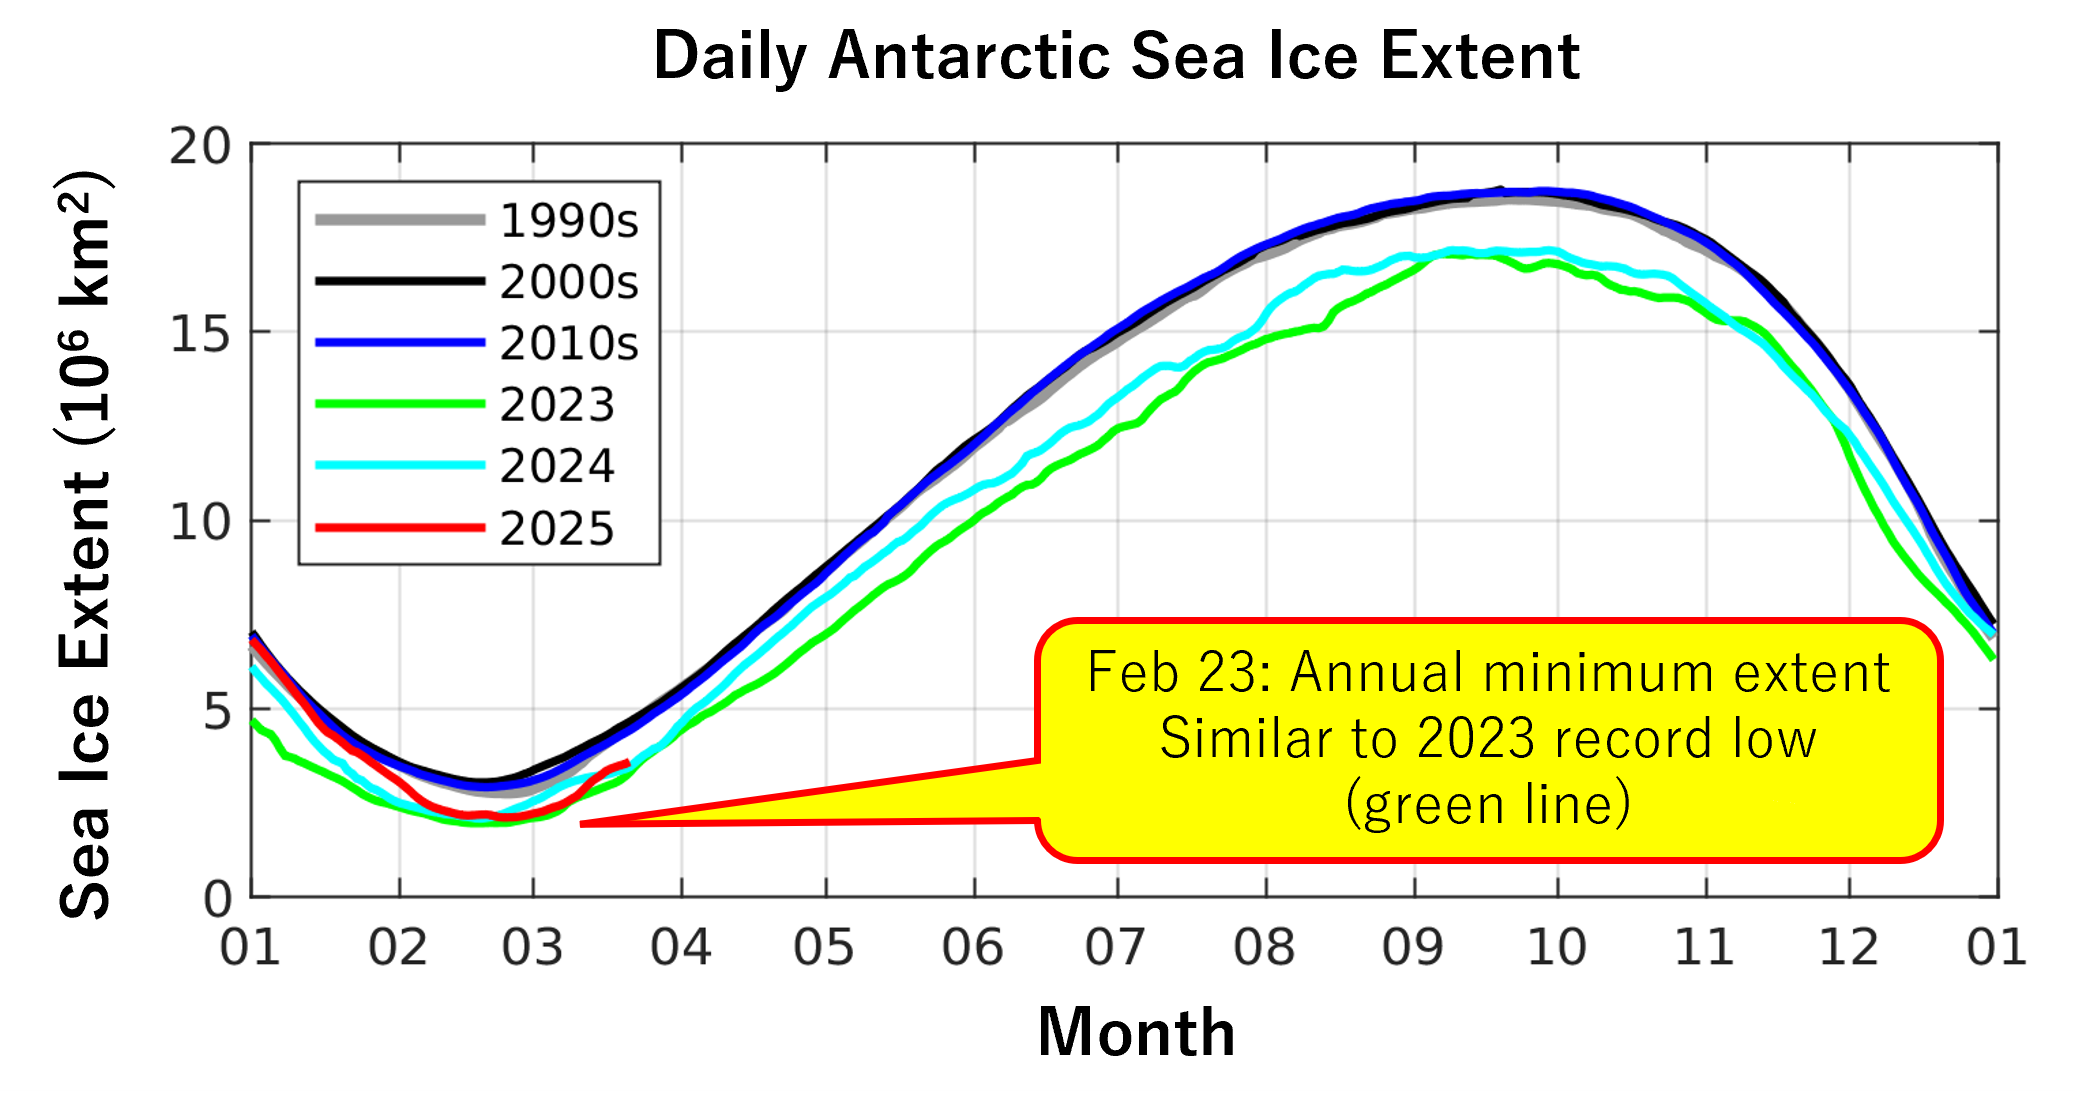
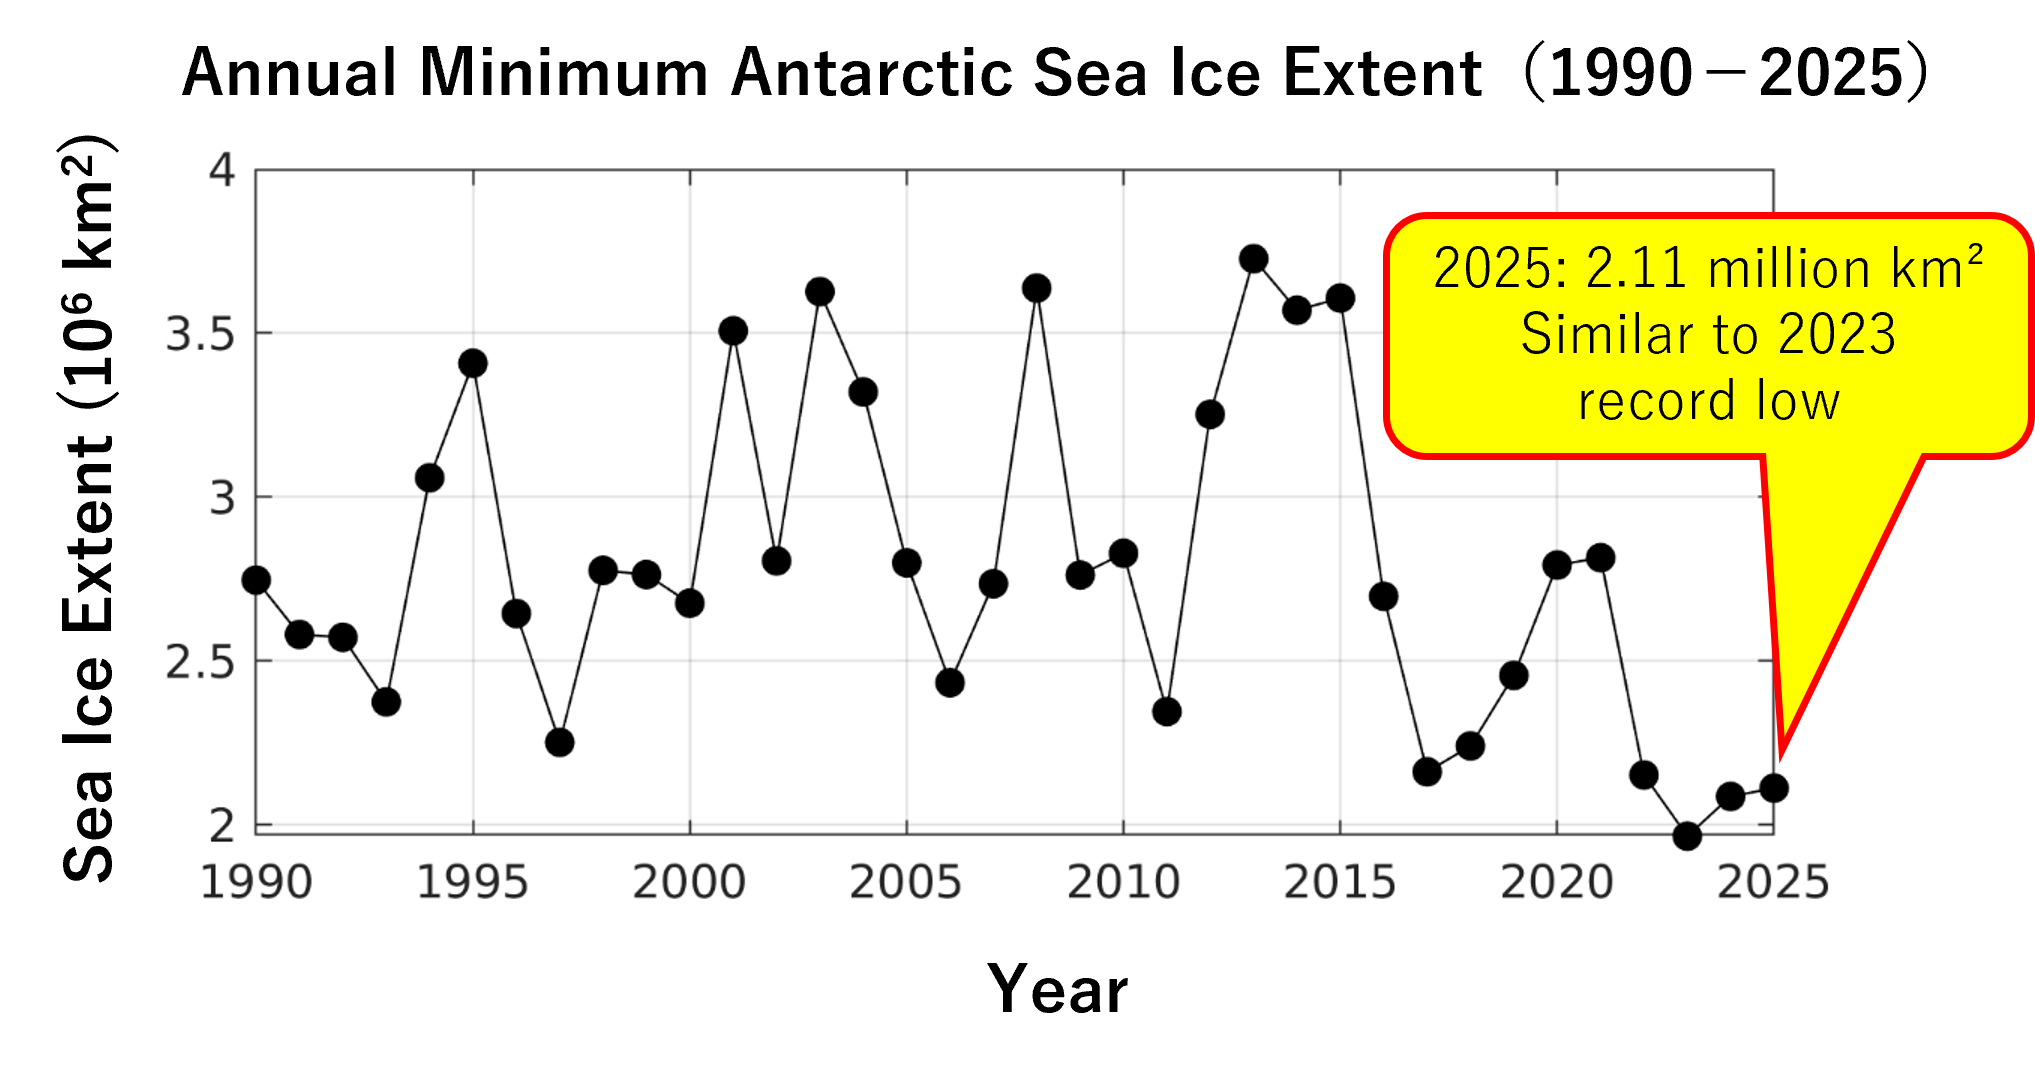
What was the situation in the Antarctic Ocean? The Antarctic summer season is from December to February, when the sea ice melts and retreats (Figure 6). As of mid-January, the extent of Antarctic sea ice in 2025 (red line in Figure 6) has been retreating at rate similar to the 2010s average (blue line in Figure 6). Since then, however, sea ice retreat has accelerated, reaching its annual minimum area of 2,111,700 square kilometers on February 23. This value is at the same level as the lowest Antarctic summer sea ice extent in the history of satellite observations, recorded in 2023 (1.95 million square kilometers) (Figure 7).

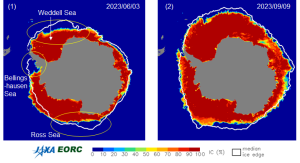
Looking at the sea ice distribution in Antarctica on February 23, 2025 (Figure 8), we can see that compared to the average sea ice edge in 2010s shown by the white line, the sea ice extent tends to be smaller in many oceans, including the Ross Sea, Amundsen Sea, Bellingshausen Sea, and Weddell Sea.
The Global Sea Ice Extent Has Reached its Minimum
The red, light blue, and green lines indicate the years when the annual minimum value of global sea ice extent was among the three lowest in the history of satellite observations.
In 2025, the extent of sea ice at both poles was significantly lower than usual for this time of year. What about the extent of sea ice around the world as a whole? The Arctic Ocean is surrounded by land, which limits the extent of sea ice in winter. In contrast, the Antarctic Ocean is not bounded by land. Therefore, sea ice around Antarctica can expand and contract more freely, leading to greater seasonal variations in its extent than the Arctic Ocean. From spring to summer in particular, Antarctic sea ice retreats significantly due to efficient melting in the marginal ice zone, as the Antarctic has a higher proportion of sea ice located at lower latitudes compared to the Arctic. Because of such seasonal variations in sea ice extent at the poles, global sea ice extent reaches its minimum value around February each year (Figure 9).

On February 7, the global sea ice extent in 2025 reached its annual minimum of 15,343,800 square kilometers. This is also the lowest value ever recorded by satellite observations (Figure 10). Sea ice reflects sunlight more effectively than seawater does, which reduces the amount of sunlight absorbed by the ocean and helps cool the Earth. Therefore, the observed decrease in global sea ice extent is thought to weaken this cooling function and could accelerate global warming.
Future Observations Will Be Important
As shown in Figure 10, extremely low global sea ice extent has occurred frequently since 2016. It is important to continue monitoring this situation to determine whether it is temporary or permanent.
The observation data used this time was obtained by the Advanced Microwave Scanning Radiometer 2 (AMSR2), which is a sensor aboard the Global Change Observation Mission – Water “SHIZUKU” (GCOM-W). AMSR2 detect naturally emitted microwaves to observe various forms of water on Earth.
The Global Observing SATellite for Greenhouse gases and Water cycle (GOSAT-GW), equipped with the Advanced Microwave Scanning Radiometer 3 (AMSR3), is scheduled to launch on June 24, 2025. GCOM-W and GOSAT-GW will continue and expand long-term monitoring efforts.
This article explains changes in sea ice in a variety of regions, including the Arctic and Antarctic. The Arctic Sea Ice Information Center of the National Institute of Polar Research published an article summarizing detailed research results from each ocean region. If you are interested, please click here.
*1: sea ice extent
For information on how sea ice extent is calculated, please see the JASMES website.
https://kuroshio.eorc.jaxa.jp/JASMES/climate/index_j.html
The Arctic sea ice extent mentioned in this article refers to the extent of the entire Northern Hemisphere, including the Sea of Okhotsk and the Bering Sea.
*2 first date of drift ice in sight:The day when the drifting ice, which had come from beyond the line of sight, was first seen on the sea surface within sight.
*3 https://www.jma-net.go.jp/abashiri/shosai/seaice_report/seaice_report2025-1.pdf
*4 first date of drift ice on shore: The first day that drift ice came ashore or joined fast ice, closing off coastal waterways and making it impossible for ships to navigate
*5 The Asahi Shimbun
(February 23, 2025) https://www.asahi.com/articles/AST2Q41JXT2QIIPE015M.html
<Related Sites>
The GCOM-W observation data used in this article is updated daily on the following website.
Sea Ice Distribution in the Sea of Okhotsk
https://sharaku.eorc.jaxa.jp/cgi-bin/adeos2/seaice/seaice_v3.cgi?lang=e&mode=large&y=2025&m=05&d=31&sen=W1AM2&area=okh&pro=IC0
Images of the distribution of sea ice in the Sea of Okhotsk, as observed by GCOM-W and GCOM-C, have been made public.
JASMES for sea ice
https://kuroshio.eorc.jaxa.jp/JASMES/climate/index_j.html
This site shows images and time series graphs of sea ice extent and sea ice concentration.
Search by Year
Search by Categories


Tags
-
#Earthquake
-
#Land
-
#Satellite Data
-
#Aerosol
-
#Public Health
-
#GCOM-C
-
#Sea
-
#Atmosphere
-
#Ice
-
#Today's Earth
-
#Flood
-
#Water Cycle
-
#AW3D
-
#G-Portal
-
#EarthCARE
-
#Volcano
-
#Agriculture
-
#Himawari
-
#GHG
-
#GPM
-
#GOSAT
-
#Simulation
-
#GCOM-W
-
#Drought
-
#Fire
-
#Forest
-
#Cooperation
-
#Precipitation
-
#Typhoon
-
#DPR
-
#NEXRA
-
#ALOS
-
#GSMaP
-
#Climate Change
-
#Carbon Cycle
-
#API
-
#Humanities Sociology
-
#AMSR
-
#Land Use Land Cover
-
#Environmental issues
-
#Quick Report
-
#GOSAT-GW
Related Resources


Related Tags
Meteorology and the Environment Related Articles
-
 Meteorology and the Environment 2025.11.05 Wed The Breakup of the World’s Largest Iceberg, “A23a”: The Trajectory of Iceberg A23a Observed by “GCOM-W”, “ALOS-2”, “ALOS-4” and the Latest Satellite, “GOSAT-GW”
 -
 Meteorology and the Environment 2025.10.02 Thu Satellite Observations and Flood Forecasts for Line-shaped Rainbands in August 2025
 -
 Meteorology and the Environment 2023.10.11 Wed Climate Change 2023 (2) : Antarctic Winter Sea Ice Extent Lowest Ever Recorded
 -
 Meteorology and the Environment 2023.08.31 Thu Climate Change 2023 (1) : Sea Surface Temperature Rise and El Niño Event
Stay Connected
