


Research and Development
2018.11.14 Wed
Launch of “JAXA Realtime weather watch” and the cutting-edge technology to make it possible
JAXA provides various useful data by observing the Earth using satellites. By combining (integrating) the observation data obtained from satellites with numerical models, continuous data can be created and physical quantities can be provided that cannot be obtained by satellites. JAXA collaborates with domestic research institutes to develop analysis methods and simulation systems using abundant observation data.
In this article, we introduce NEXRA (NICAM-LETKF JAXA Research Analysis), a fusion of satellite data and meteorological models that JAXA recently started, and the “JAXA Realtime weather watch” website that visualizes it. NEXRA not only allows users to monitor and view various meteorological data in real time but also allows them to conduct experiments to reproduce and predict significant phenomena. This article presents the results of weather prediction for the heavy rains of July 2018.
In numerical weather prediction, simulated atmospheric conditions are modified based on satellite and ground-based observations. This method is called data assimilation, and research is being conducted worldwide to improve weather prediction through data assimilation methods. NEXRA data is calculated using a meteorological data assimilation system that takes advantage of the large-scale computing power of JAXA’s supercomputer and assimilates Global Satellite Mapping of Precipitation (GSMaP), which has the advantage of improving the accuracy of weather prediction. The NEXRA product can provide weather information that cannot be obtained by satellites, and can also be used for weather prediction experiments. The research results of such data assimilation and weather prediction experiments will be useful for technological development for the operational use of satellite data.
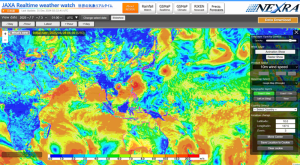
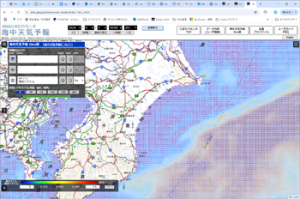
EORC has launched a website called “JAXA Realtime weather watch” that visualizes images obtained by the NEXRA system so that people can easily view global weather information (Figure 1). On this homepage, users can view current weather data, surface wind direction and speed, surface air temperature, surface water vapor amount, accumulated water vapor amount, surface pressure, accumulated precipitation amount, and Outgoing Longwave Radiation (OLR) images.
NEXRA data is currently being used to support an intensive observation project of the Japan Agency for Marine-Earth Science and Technology (YMC-BSM), as well as for the Global Terrestrial Hydrological Simulation System, Today’s Earth, which EORC is developing in collaboration with the University of Tokyo.
This article was written in collaboration with Prof. Masaki Satoh and Dr. Kaya Kanemaru of the Atmosphere and Ocean Research Institute, the University of Tokyo, and JAXA/EORC.
NEXRA system with cutting-edge technologies
Daily weather forecasts use a variety of observational data, such as data from Earth observation satellites launched by JAXA (GPM core observatory DPR/GMI, GCOM-W, AMSR2, etc.). To make a weather forecast, initial forecast values are necessary, and the accuracy of the initial forecast values is directly linked to the accuracy of the weather forecast itself. Specifically, the initial forecast values are created in the following steps. The atmospheric conditions at a given time estimated by the numerical weather forecast model are combined with the certainty of each observation data to calculate the most likely state (analytical value). Based on that result, the conditions at the next time step are predicted using the numerical weather forecast model. As new observation data is available at that time, the analytical values are calculated in the same manner. This process is repeated at each time step, and initial forecast values are created. This sequence of events is called a data assimilation cycle. The data assimilation cycle makes satellite observation data immediately useful for forecasting tomorrow’s weather, but to do so, we need both a numerical weather forecast model and a data assimilation system that can plausibly incorporate observational data. As a result, know-how about data assimilation cycles has until now been limited to organizations such as the Japan Meteorological Agency.
However, recent advances in computer performance and data assimilation technology have been remarkable. In addition, JAXA has conducted collaborative research with the University of Tokyo and the RIKEN using a numerical weather prediction model (Nonhydrostatic Icosahedral Atmospheric Model; NICAM, Satoh et al. 2014) and a data assimilation system (Local Ensemble Transform Kalman Filter; LETKF, Kotsuki et al. 2017a, 2017b; Terasaki and Misyohi, 2017, Kotsuki et al. 2018), which has enabled the development of cutting-edge technology for the fusion of satellite data and meteorological models. The meteorological data assimilation system that utilizes the large-scale computing performance of the JAXA Supercomputer System Generation 2 (JSS2) and the product calculated using this system are NICAM-LETKF JAXA Research Analysis (NEXRA). NEXRA is currently calculated four times a day and operates routinely about eight hours behind real-time.
NEXRA’s features that combine satellite data and weather models
NEXRA is still under development, but even at this time it has several unique features. One is that it assimilates the Global Satellite Mapping of Precipitation (GSMaP) as observation data. Precipitation has greater spatial and temporal fluctuations than water vapor or wind, and there is also a large discrepancy between the precipitation predicted by numerical forecast models and the observed precipitation itself. Therefore, if precipitation that has a large discrepancy between observations and a numerical model is assimilated as is, it is known that even if the accuracy of the precipitation is improved, the accuracy of the atmospheric conditions that cause the precipitation will deteriorate. Since the purpose of data assimilation is to improve the accuracy of atmospheric conditions for weather forecasting, precipitation data was not considered to be suitable information for assimilation. Therefore, NEXRA has succeeded in improving the accuracy of the analysis by assimilating GSMaP precipitation data by assimilating “the likelihood of precipitation occurring based on the past precipitation frequency distribution”, rather than the “amount of precipitation” itself (Kotsuki et al., 2017a).
One of the unique aspects of NEXRA is that it outputs global ensemble data. The word ensemble seems to have French origins and means a set in mathematics. The set here is a bit of a parallel world. Just as the lengths we measure with a ruler vary under different measurement conditions, there are measurement errors in the observed values. The observations tend to vary around the true value of the atmospheric conditions we really want to know. Similarly, numerical model forecasts also vary around the true value, so the variation itself, created by a good combination of observation and numerical model errors, is the parallel world, or ensemble data. Ensemble data is created each time a data assimilation cycle is performed, and NEXRA uses 100 members to calculate the data.
Since the ensemble data is corrected using the observation data at that time, the variability is not so large. However, when weather predictions are made using ensemble data as the initial forecast values, small differences in the initial values are amplified over time, and the location of low-pressure systems several days later can differ significantly. By using the similarities and differences in the results of forecasts using ensemble data (ensemble forecasting), it is possible to investigate the certainty of the predictability of the target phenomenon and the uniqueness of the phenomenon.
Weather forecast results for the heavy rains of July 2018
This article introduces the results of a high-resolution ensemble forecast using NEXRA ensemble data for the heavy rains that occurred in western Japan in early July 2018 (the heavy rains of July 2018). The heavy rains of July 2018 caused severe damage in western Japan, as described in analyses of the heavy rains by the Global Precipitation Measurement (GPM) Core observatory and Global Satellite Mapping of Precipitation (GSMaP), analyses of flooded areas by Advanced Land Observing Satellite-2 “DAICHI-2” (ALOS-2), and experiments reproducing river flooding and inundation using a land surface simulation model jointly developed by the University of Tokyo and JAXA/EORC.
Figure 2 shows the distribution of precipitation observed from the ground, based on the 24-hour average precipitation amount (mm/hr) from 7/6 09 JST to 7/7 09 JST. The areas with high precipitation observed on the ground correspond to Hiroshima, Ehime, and Gifu prefectures, indicating that line-shaped precipitation systems occurred simultaneously in multiple locations.
Why did the precipitation area shown in Figure 2 occur? What was the cause? To answer this question, we conducted ensemble forecast experiments using NEXRA data. Using NEXRA’s slightly different ensemble of 100 data as initial forecast values, Figure 3 shows the results of 100 different forecasts with a grid spacing of 14 km. The 100 forecast results roughly reproduce the distribution of precipitation areas from the bottom left to the top right of the figure, but a closer look reveals that they vary from forecast to forecast. In this forecast experiment, some precipitation areas were distributed from Kyushu to the Shikoku and Chugoku regions, and some were distributed over the Tsushima Strait.
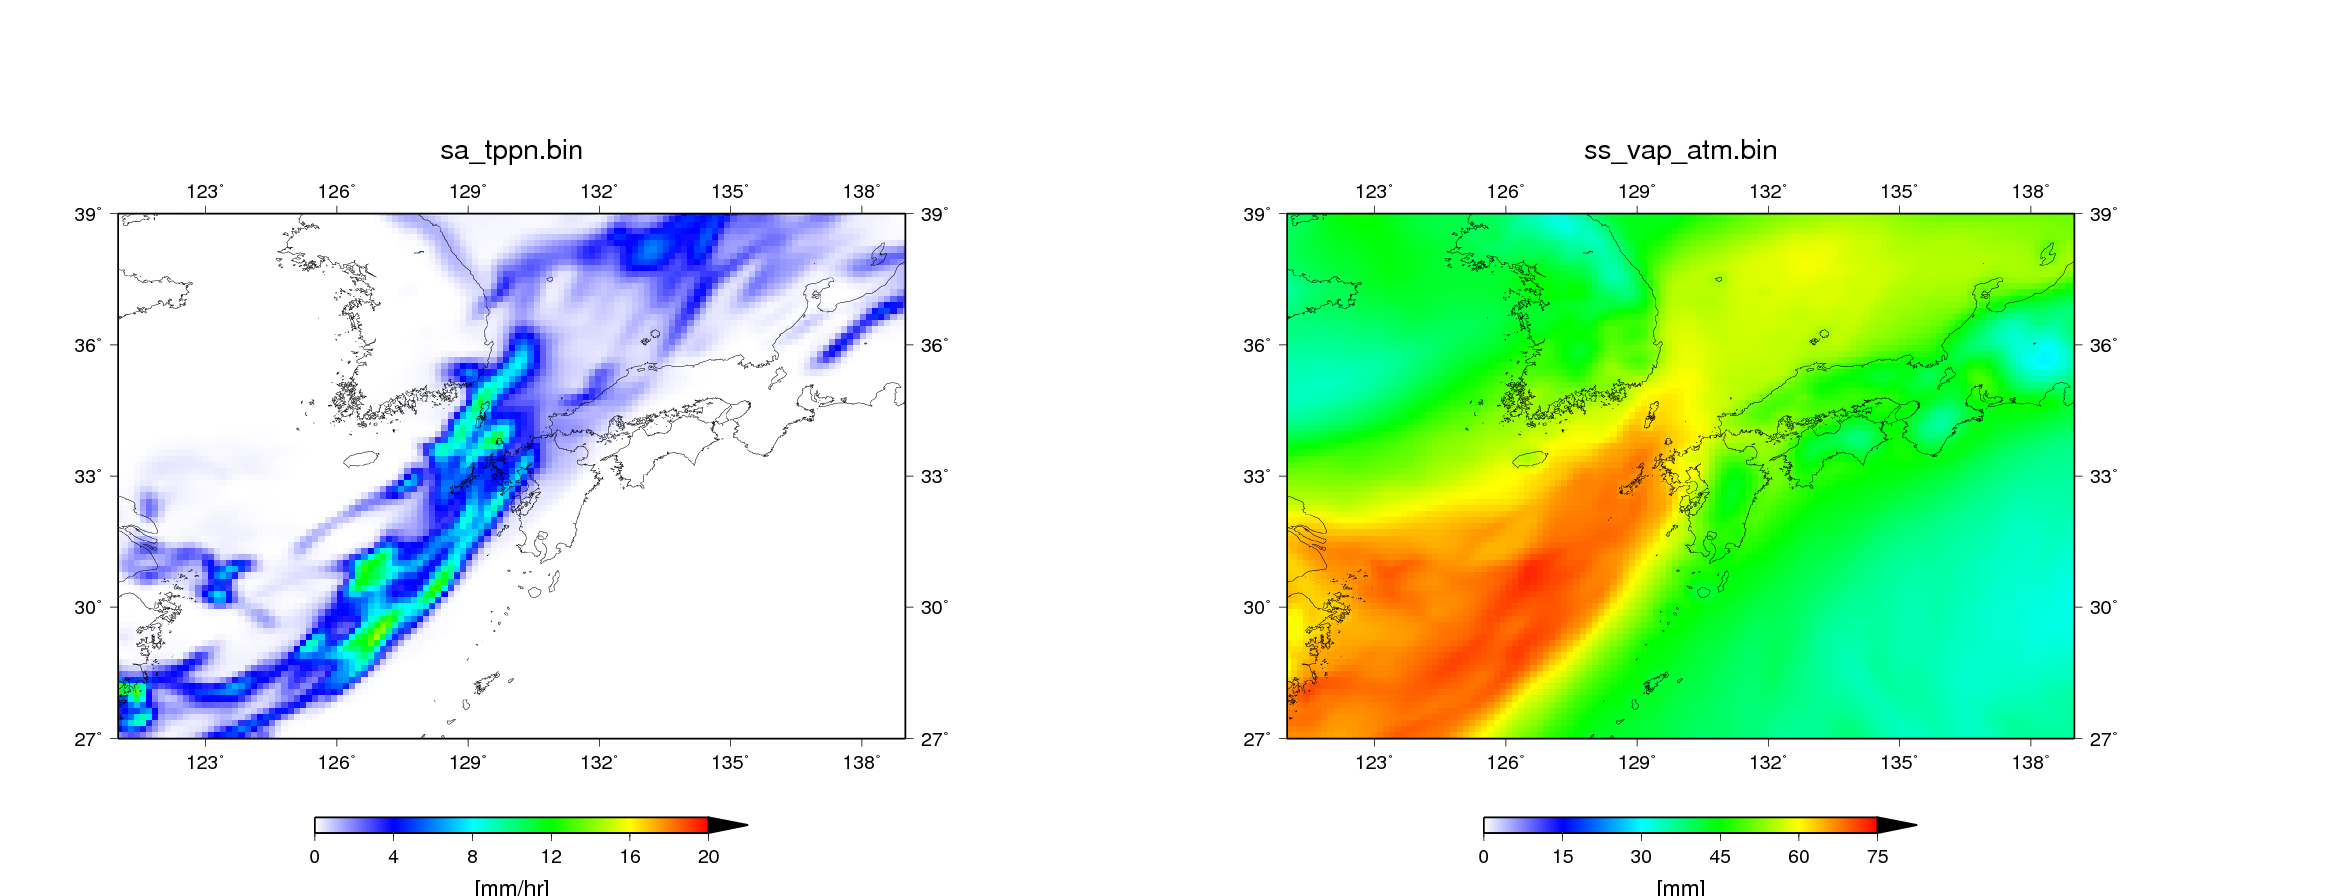
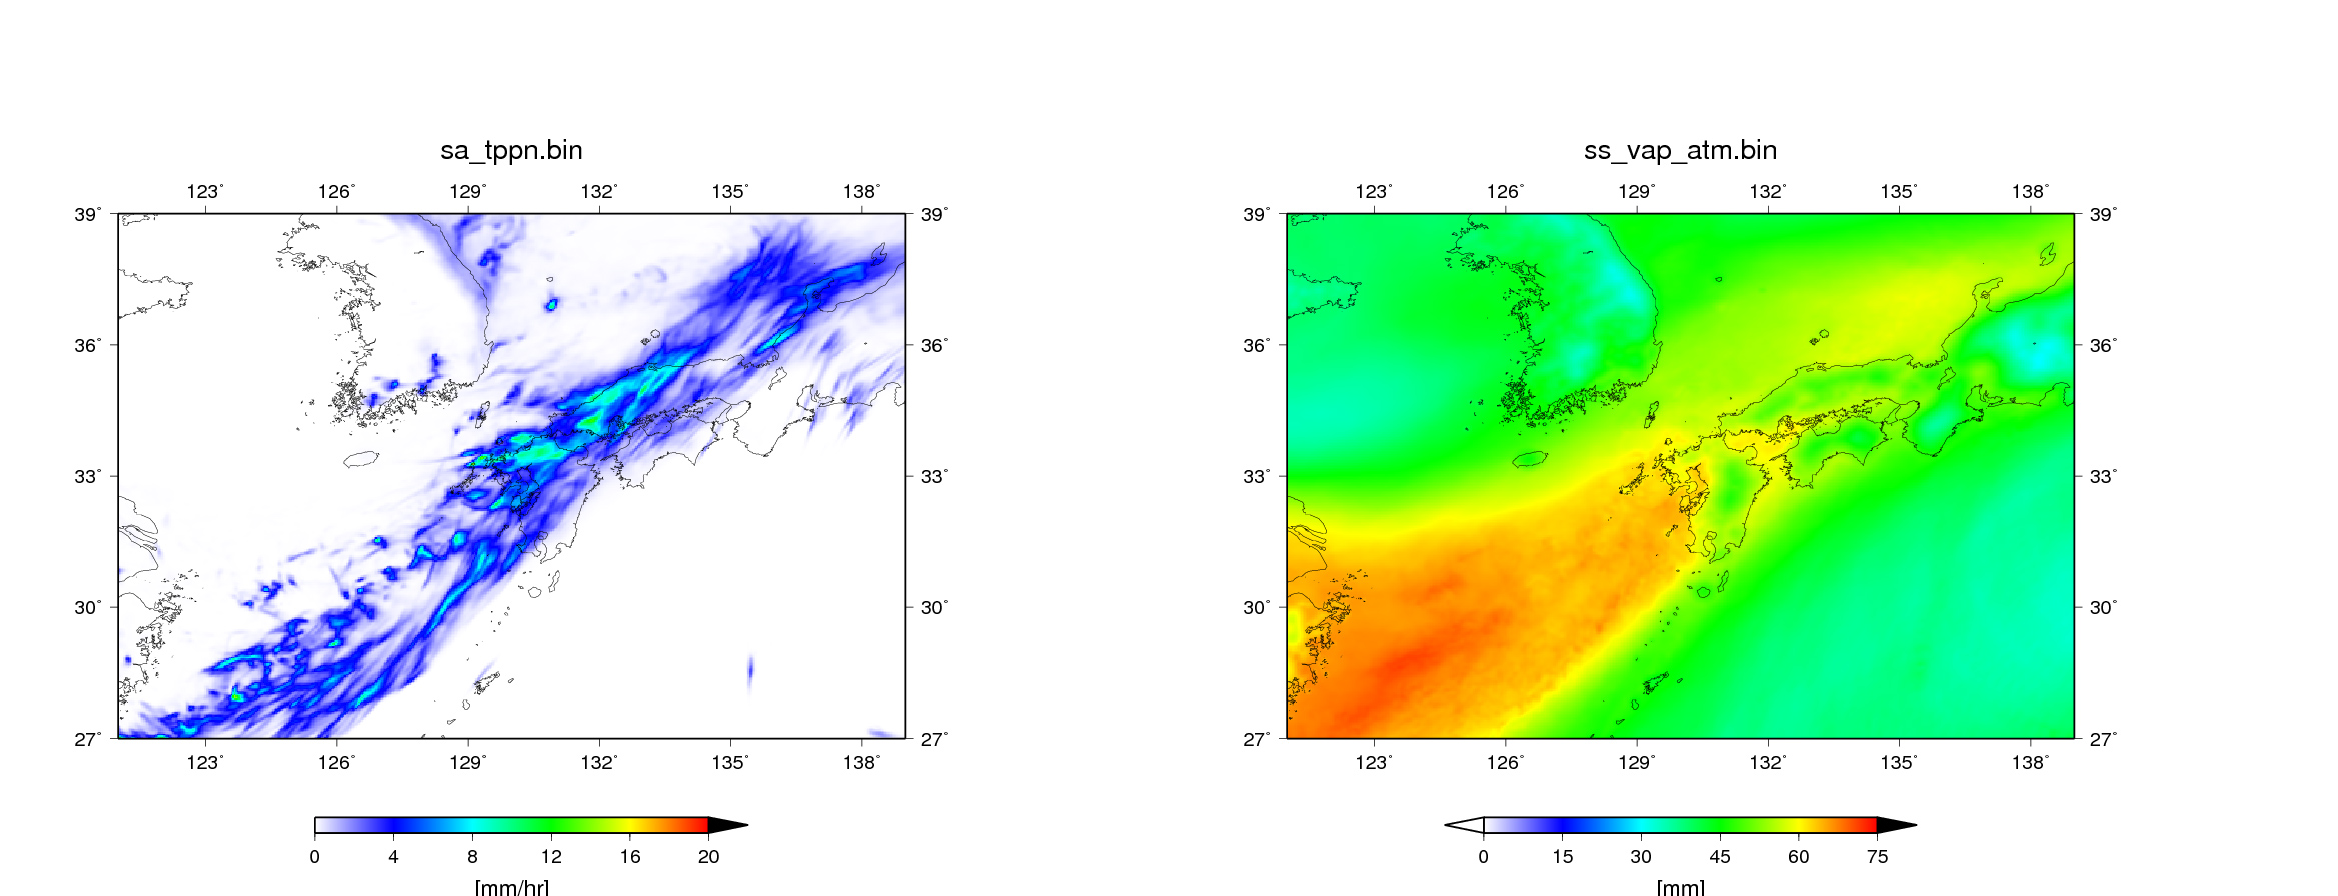
Figure 4 shows the results of these 100 forecast experiments in which the precipitation areas were similar to the actual conditions. The results in Figure 4 show that precipitation area is distributed slightly to the northwest compared to the actual situation, but it can be seen that the precipitation area is distributed from Kyushu to the Chugoku-Shikoku region. This distribution is caused by the large amount of water vapor flowing in from the East China Sea. It is suggested that the large and prolonged influx of water vapor was one of the factors behind the record-breaking rainfall. For comparison, Figure 5 shows the experimental results in which the precipitation area distribution was more accurately reproduced. The precipitation area in this experiment was not in western Japan but in the Tsushima Strait, and this distribution corresponds well with the inflow of water vapor. This shows that differences in the initial values of wind and water vapor change the inflow of water vapor and strongly determine the reproducibility of the distribution of precipitation areas.
Finally, Figure 6 shows the results of a re-forecast with a grid spacing of 3.5 km using the initial forecast values (NEXRA data used in Figure 4) that showed the best reproduction of the distribution of precipitation areas. By using a narrower grid spacing in the calculation, it is expected to more accurately represent fine variations in clouds and precipitation. The distribution of precipitation areas and water vapor is roughly similar to the experimental results for the 14 km grid (Figure 4), but the differences in the detailed distribution of precipitation areas are particularly clear.
That’s all for this article, but what determined the slight difference in the initial values? In the future, investigating the differences and similarities between the 100 parallel worlds created by NEXRA should provide clues to finding out the mystery. If we can understand the cause of this heavy rain, we will be able to take measures before the heavy rain occurs. We look forward to future research using NEXRA.
Reference
- Kotsuki, S., K. Terasaki, K. Kanemaru, M. Satoh, T. Kubota and T. Miyoshi, 2019: Predictability of Record-Breaking Rainfall in Japan in July 2018: Ensemble Forecast Experiments with the Near-real-time Global Atmospheric Data Assimilation System NEXRA. SOLA, 15A, 1-7. doi:10.2151/sola.15A-001
- Kotsuki, S., T. Miyoshi, K. Terasaki, G.-Y. Lien, and E. Kalnay, 2017a: Assimilating the Global Satellite Mapping of Precipitation Data with the Nonhydrostatic Icosahedral Atmospheric Model NICAM. J. Geophys.Res. Atmos., 122, 1-20. doi:10.1002/2016JD025355
- Kotsuki, S., Y. Ota, T. Miyoshi, 2017b: Adaptive covariance relaxation methods for ensemble data assimilation: Experiments in the real atmosphere. Quart. J. Roy. Meteorol. Soc., 143, 2001-2015. doi:10.1002/qj.3060
- Satoh, M., Tomita, H., Yashiro, H., Miura, H., Kodama, C., Seiki, T., Noda, A. T., Yamada, Y., Goto, D., Sawada, M., Miyoshi, T., Niwa, Y., Hara, M., Ohno, Y., Iga, S., Arakawa, T., Inoue, T., Kubokawa, H., 2014: The Non-hydrostatic Icosahedral Atmospheric Model: Description and development. Progress in Earth and Planetary Science. 1, 18. doi:10.1186/s40645-014-0018-1.
- Terasaki, K., and T. Miyoshi, 2017: Assimilating AMSU-A radiances with the NICAM-LETKF. Journal of the Meteorological Society of Japan, Vol. 95, No. 6, pp. 433-446, 2017 doi:10.2151/jmsj.2017-028
- Terasaki, K., M. Sawada, and T. Miyoshi, 2015: Local Ensemble Transform Kalman Filter Experiments with the Nonhydrostatic Icosahedral Atmospheric Model NICAM. SOLA, 11, 23-26. doi:10.2151/sola.2015-006
Search by Year
Search by Categories


Tags
-
#Earthquake
-
#Land
-
#Satellite Data
-
#Aerosol
-
#Public Health
-
#GCOM-C
-
#Sea
-
#Atmosphere
-
#Ice
-
#Today's Earth
-
#Flood
-
#Water Cycle
-
#AW3D
-
#G-Portal
-
#EarthCARE
-
#Volcano
-
#Agriculture
-
#Himawari
-
#GHG
-
#GPM
-
#GOSAT
-
#Simulation
-
#GCOM-W
-
#Drought
-
#Fire
-
#Forest
-
#Cooperation
-
#Precipitation
-
#Typhoon
-
#DPR
-
#NEXRA
-
#ALOS
-
#GSMaP
-
#Climate Change
-
#Carbon Cycle
-
#API
-
#Humanities Sociology
-
#AMSR
-
#Land Use Land Cover
-
#Environmental issues
-
#Quick Report
-
#GOSAT-GW
Related Resources


Related Tags
Research and Development Related Articles
-
 Research and Development 2026.03.09 Mon High-Resolution Predictions of Global Terrestrial Water Cycle:
Today’s Earth – Global Updated -
 Research and Development 2025.06.18 Wed Advancing Space-Based Weather Analysis and Forecasting – Renewal of JAXA’s Realtime Weather Watch ‘NEXRA3’ and Performance Evaluation with the previous system (Overview Article)
 -
 Research and Development 2025.03.27 Thu Launch of Ocean Weather Forecasts 1km resolution
 -
 Research and Development 2024.05.27 Mon The Use of Earth Observation Satellite Data in the Humanities and Social Sciences (3)
Stay Connected
