


Latest Observation
2011.11.30 Wed
Rich repository of lithium resources—Atacama salt lake
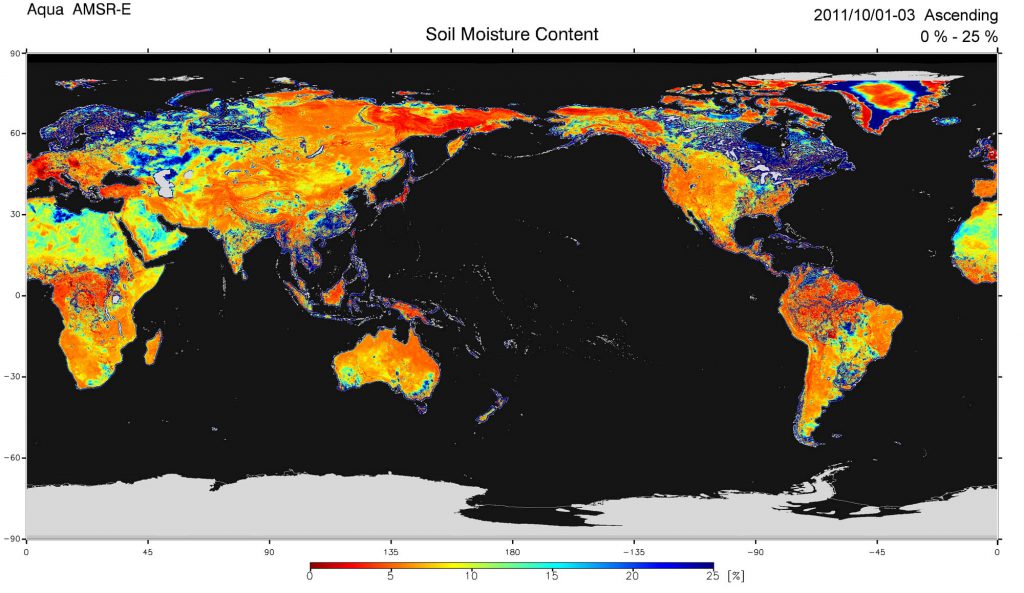
Figure 1 shows the global soil moisture content*1 distribution observed by the Advanced Microwave Scanning Radiometer for Earth Observing System (AMSR-E)*2. AMSR-E was developed by the Japanese Aerospace Exploration Agency (JAXA) and placed on board NASA’s Earth-Observing Satellite, Aqua. It was launched in 2002 and began collecting data. The operation of AMSR-E halted on October 4, 2011 because the rotating friction limit was reached. Figure 1 shows an image of AMSR-E data taken from October 1 to October 3, 2011, just before the operation was halted.
*1) The soil moisture content represents the percentage volume of moisture in a unit volume of soil. When the soil absorbs moisture and reaches saturation, its moisture content is around 50%. The observed values would be affected by the distribution of vegetation (colors red to yellow show arid areas, blue shows wet areas). Soil moisture is observed over all land areas except on ice beds and in high-density forest areas.
*2) AMSR-E was developed by JAXA and placed on board Aqua, NASA’s Earth-Observing Satellite. It was a high-performance microwave radiometer. It was launched in 2002 and since then had collected data on ocean surface temperature, precipitation, soil moisture, and sea ice caps in the Arctic Ocean. The AMSR-E reached its limit to maintain the rotation speed necessary for regular observations (40 rotations per minute), and the radiometer automatically halted its observations and rotation.
caption on
caption off
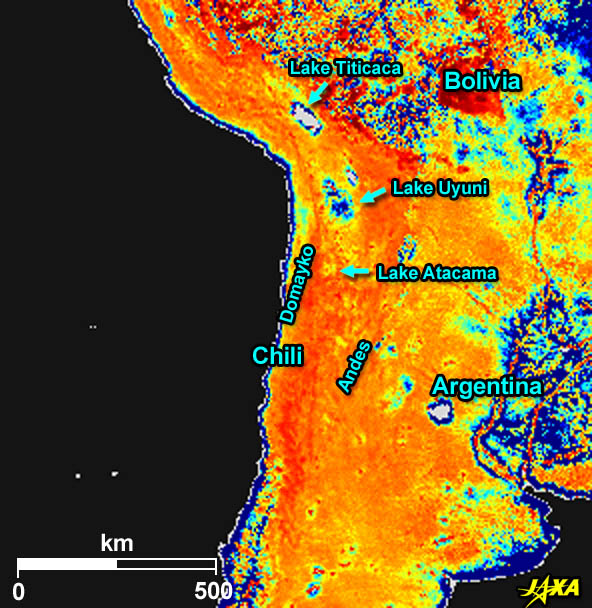
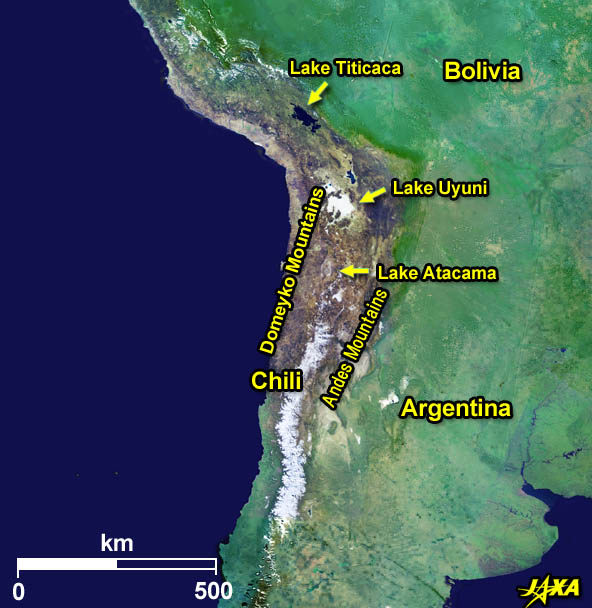
(left: soil moisture content image from AMSR-E; right: cloud-free image from Global Imager (GLI) on board ADEOS-II)
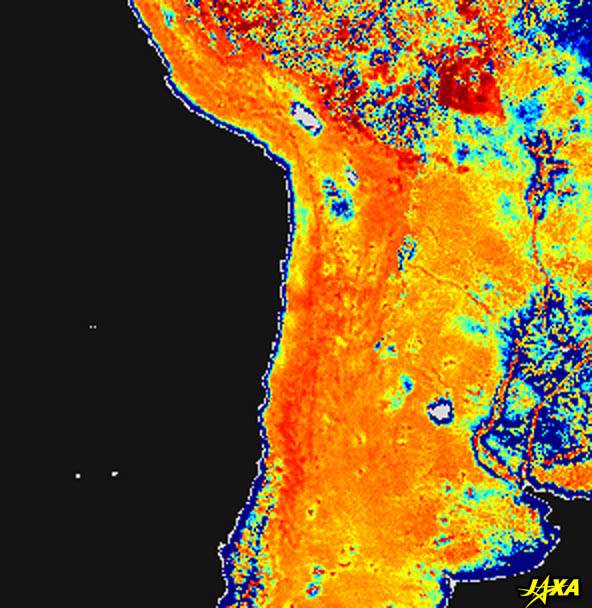
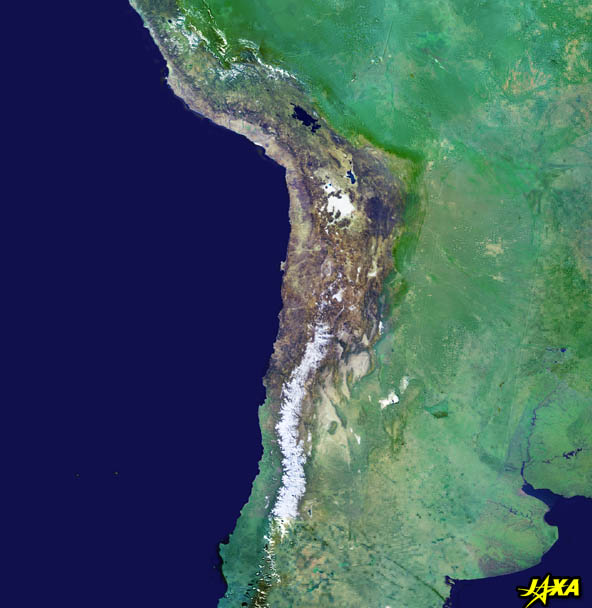
The left-hand image in Figure 2 is an enlarged image of the global soil moisture content in the Andes, Chile. The upper-center white portion is Lake Titicaca. The blue portion below Lake Titicaca is Lake Uyuni, the largest salt lake in South America. The Atacama plateau can be seen below Lake Uyuni. The Atacama highland is located between the Andes and the Domeyko. The Atacama plateau is the driest area in the world. Its altitude is high and the air is dry. Telescopes have been built here because of the favorable conditions.
The Atacama plateau looks like the surface of the Moon. Lake Atacama is situated on the plateau. It is the second-largest salt lake in the world. Lake Uyuni looks white. In contrast, Lake Atacama looks brown. The left-hand image in Figure 2 shows that Lake Uyuni contains more moisture than Lake Atacama does.
caption on
caption off
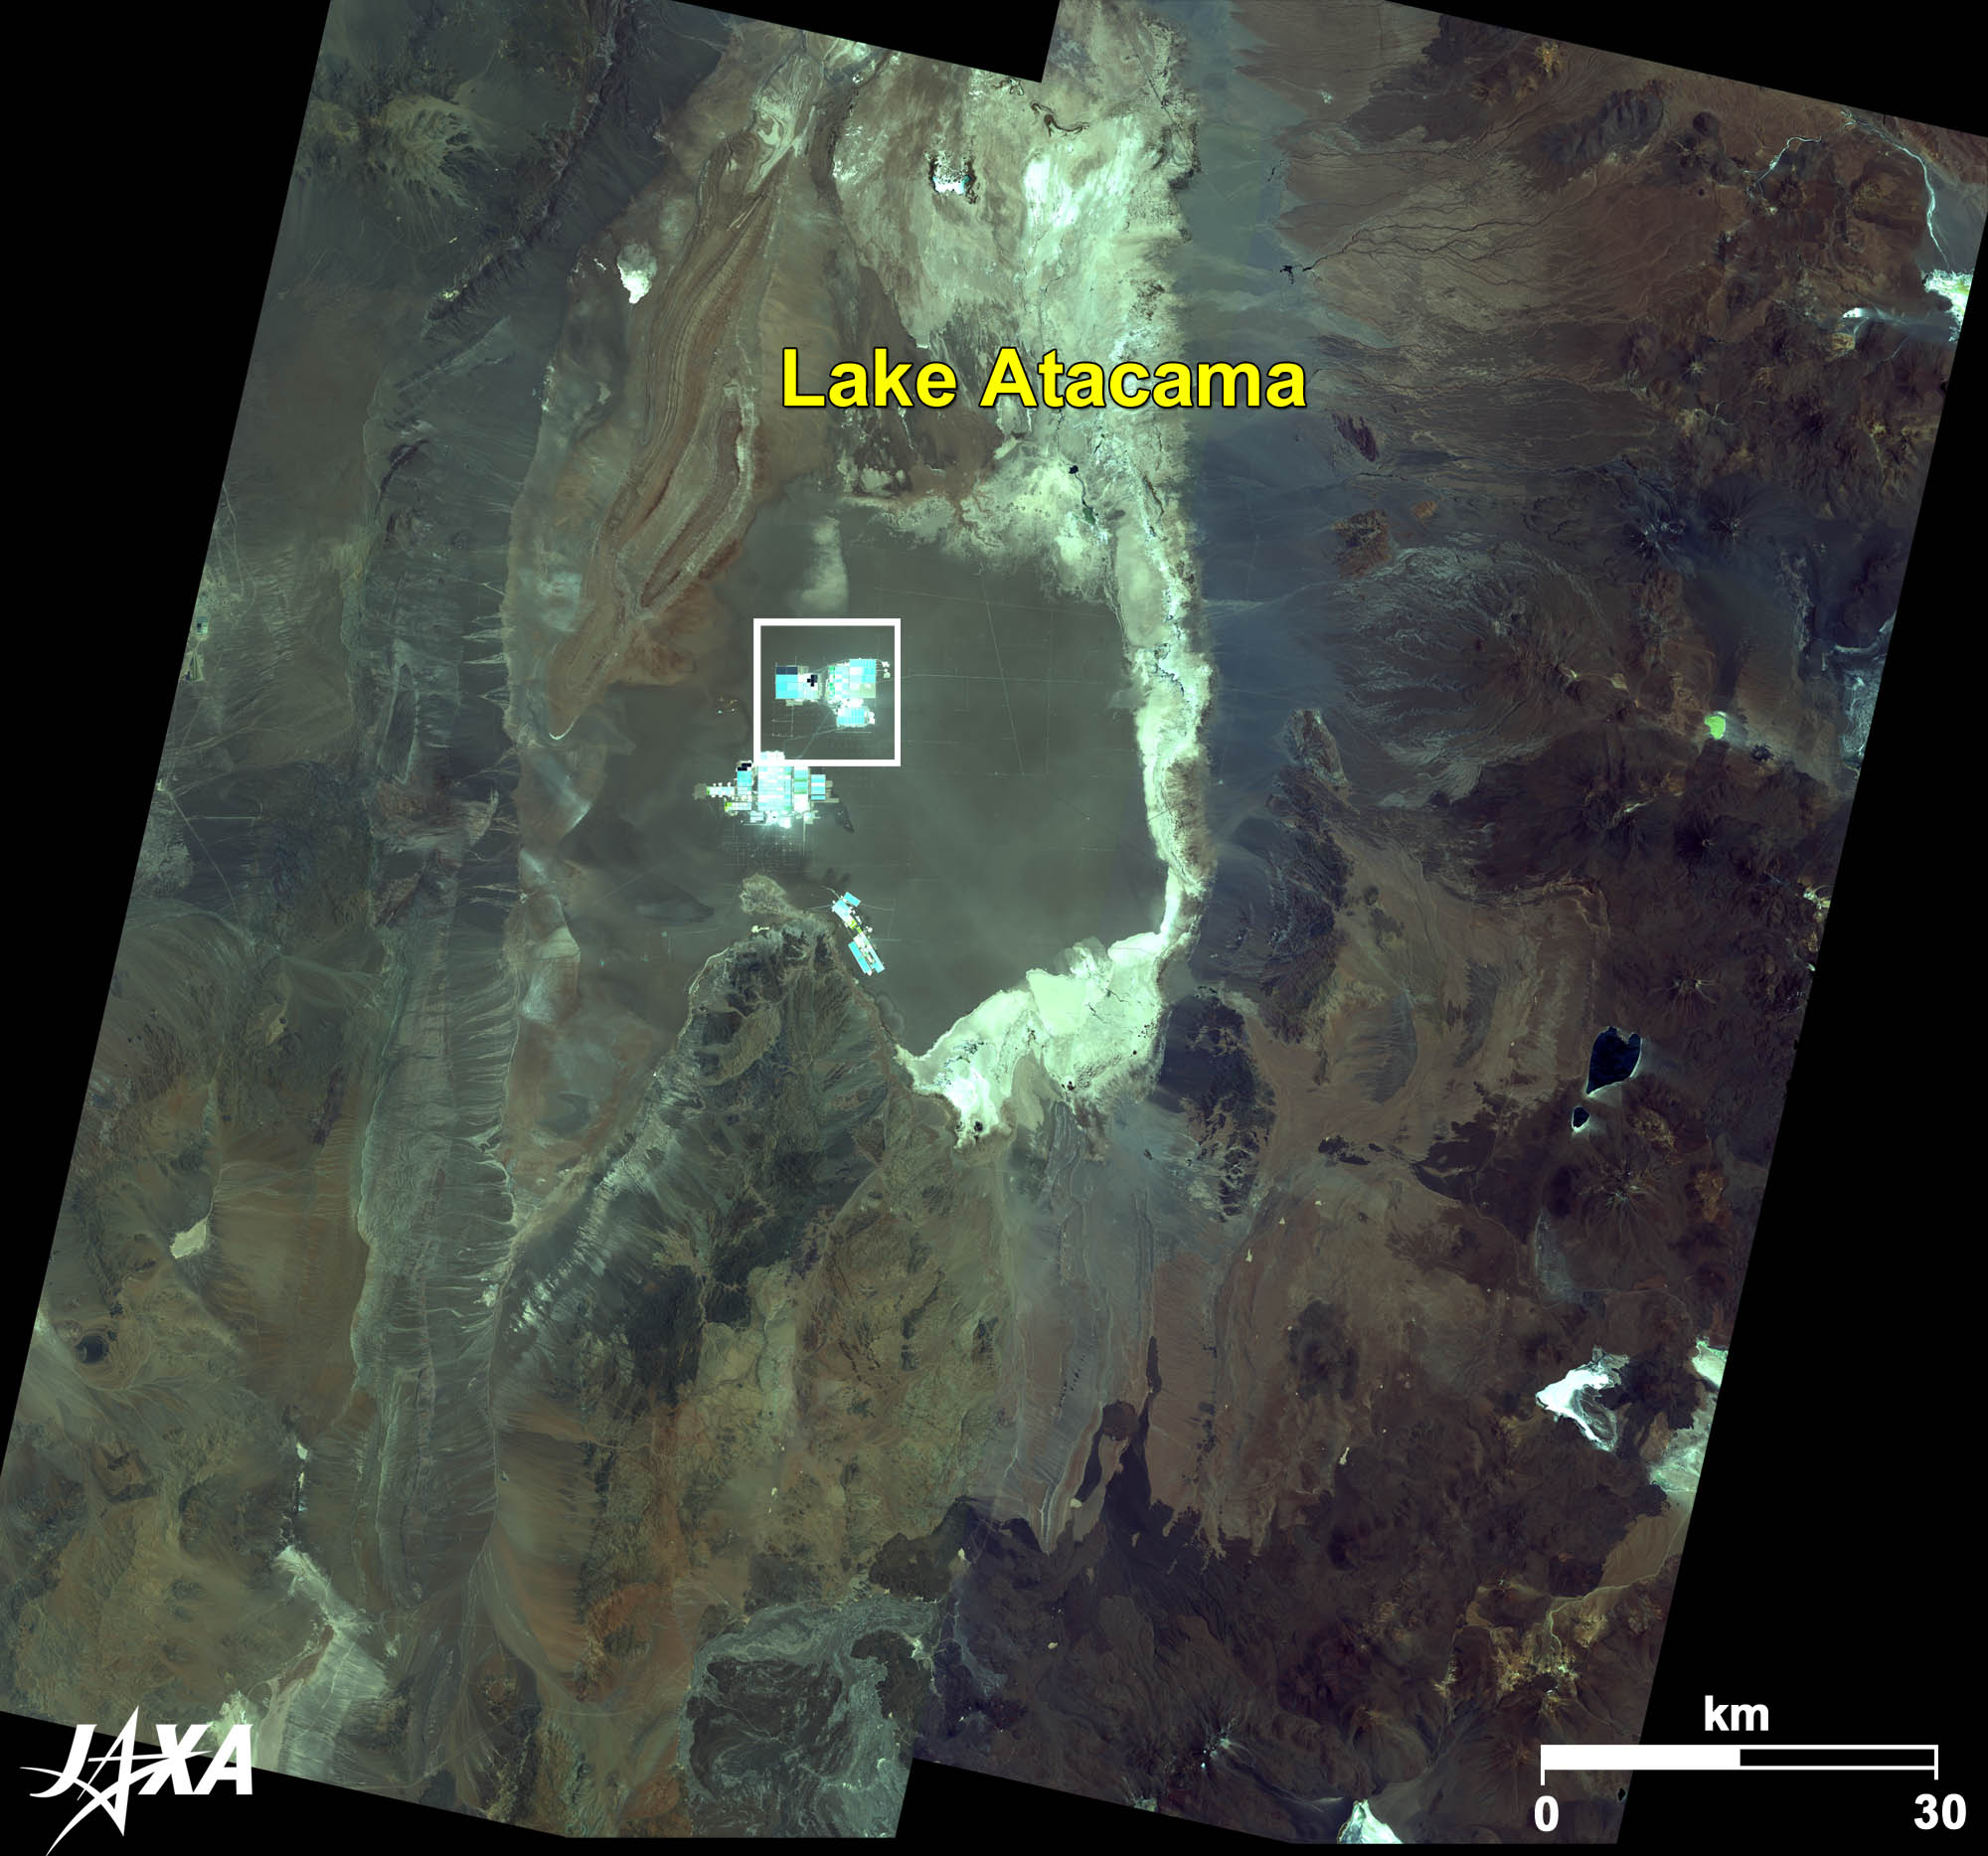
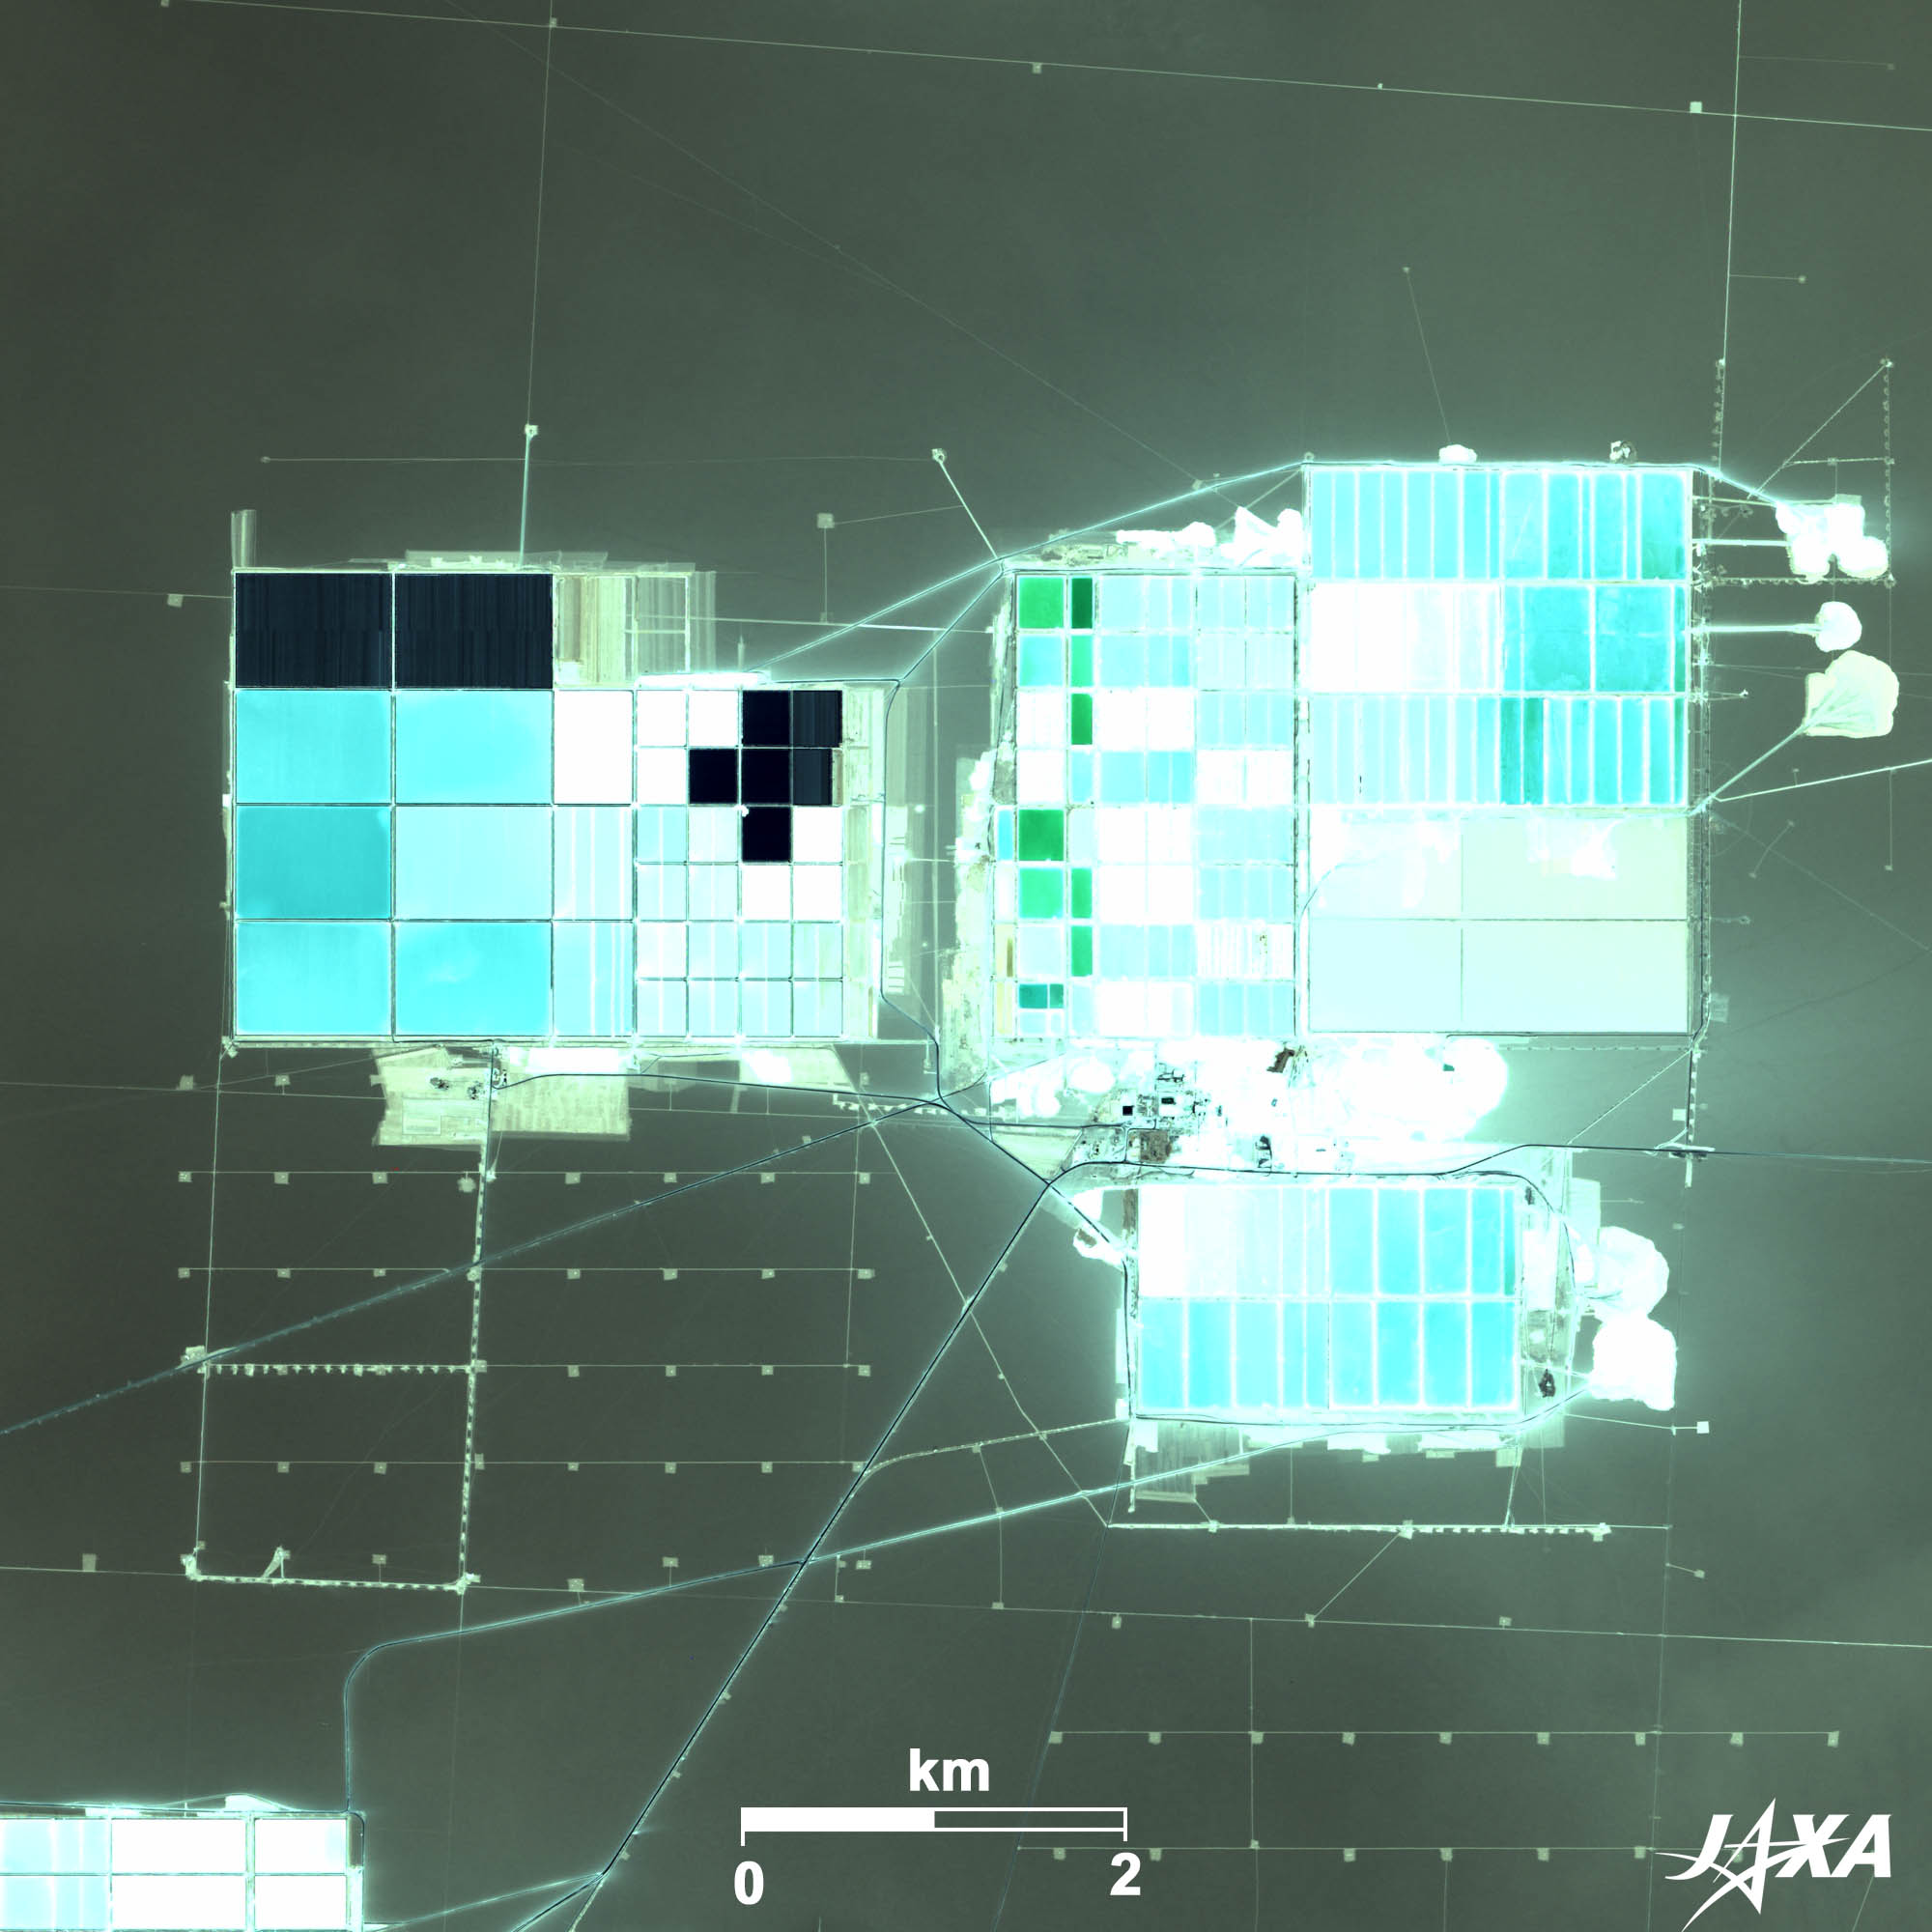
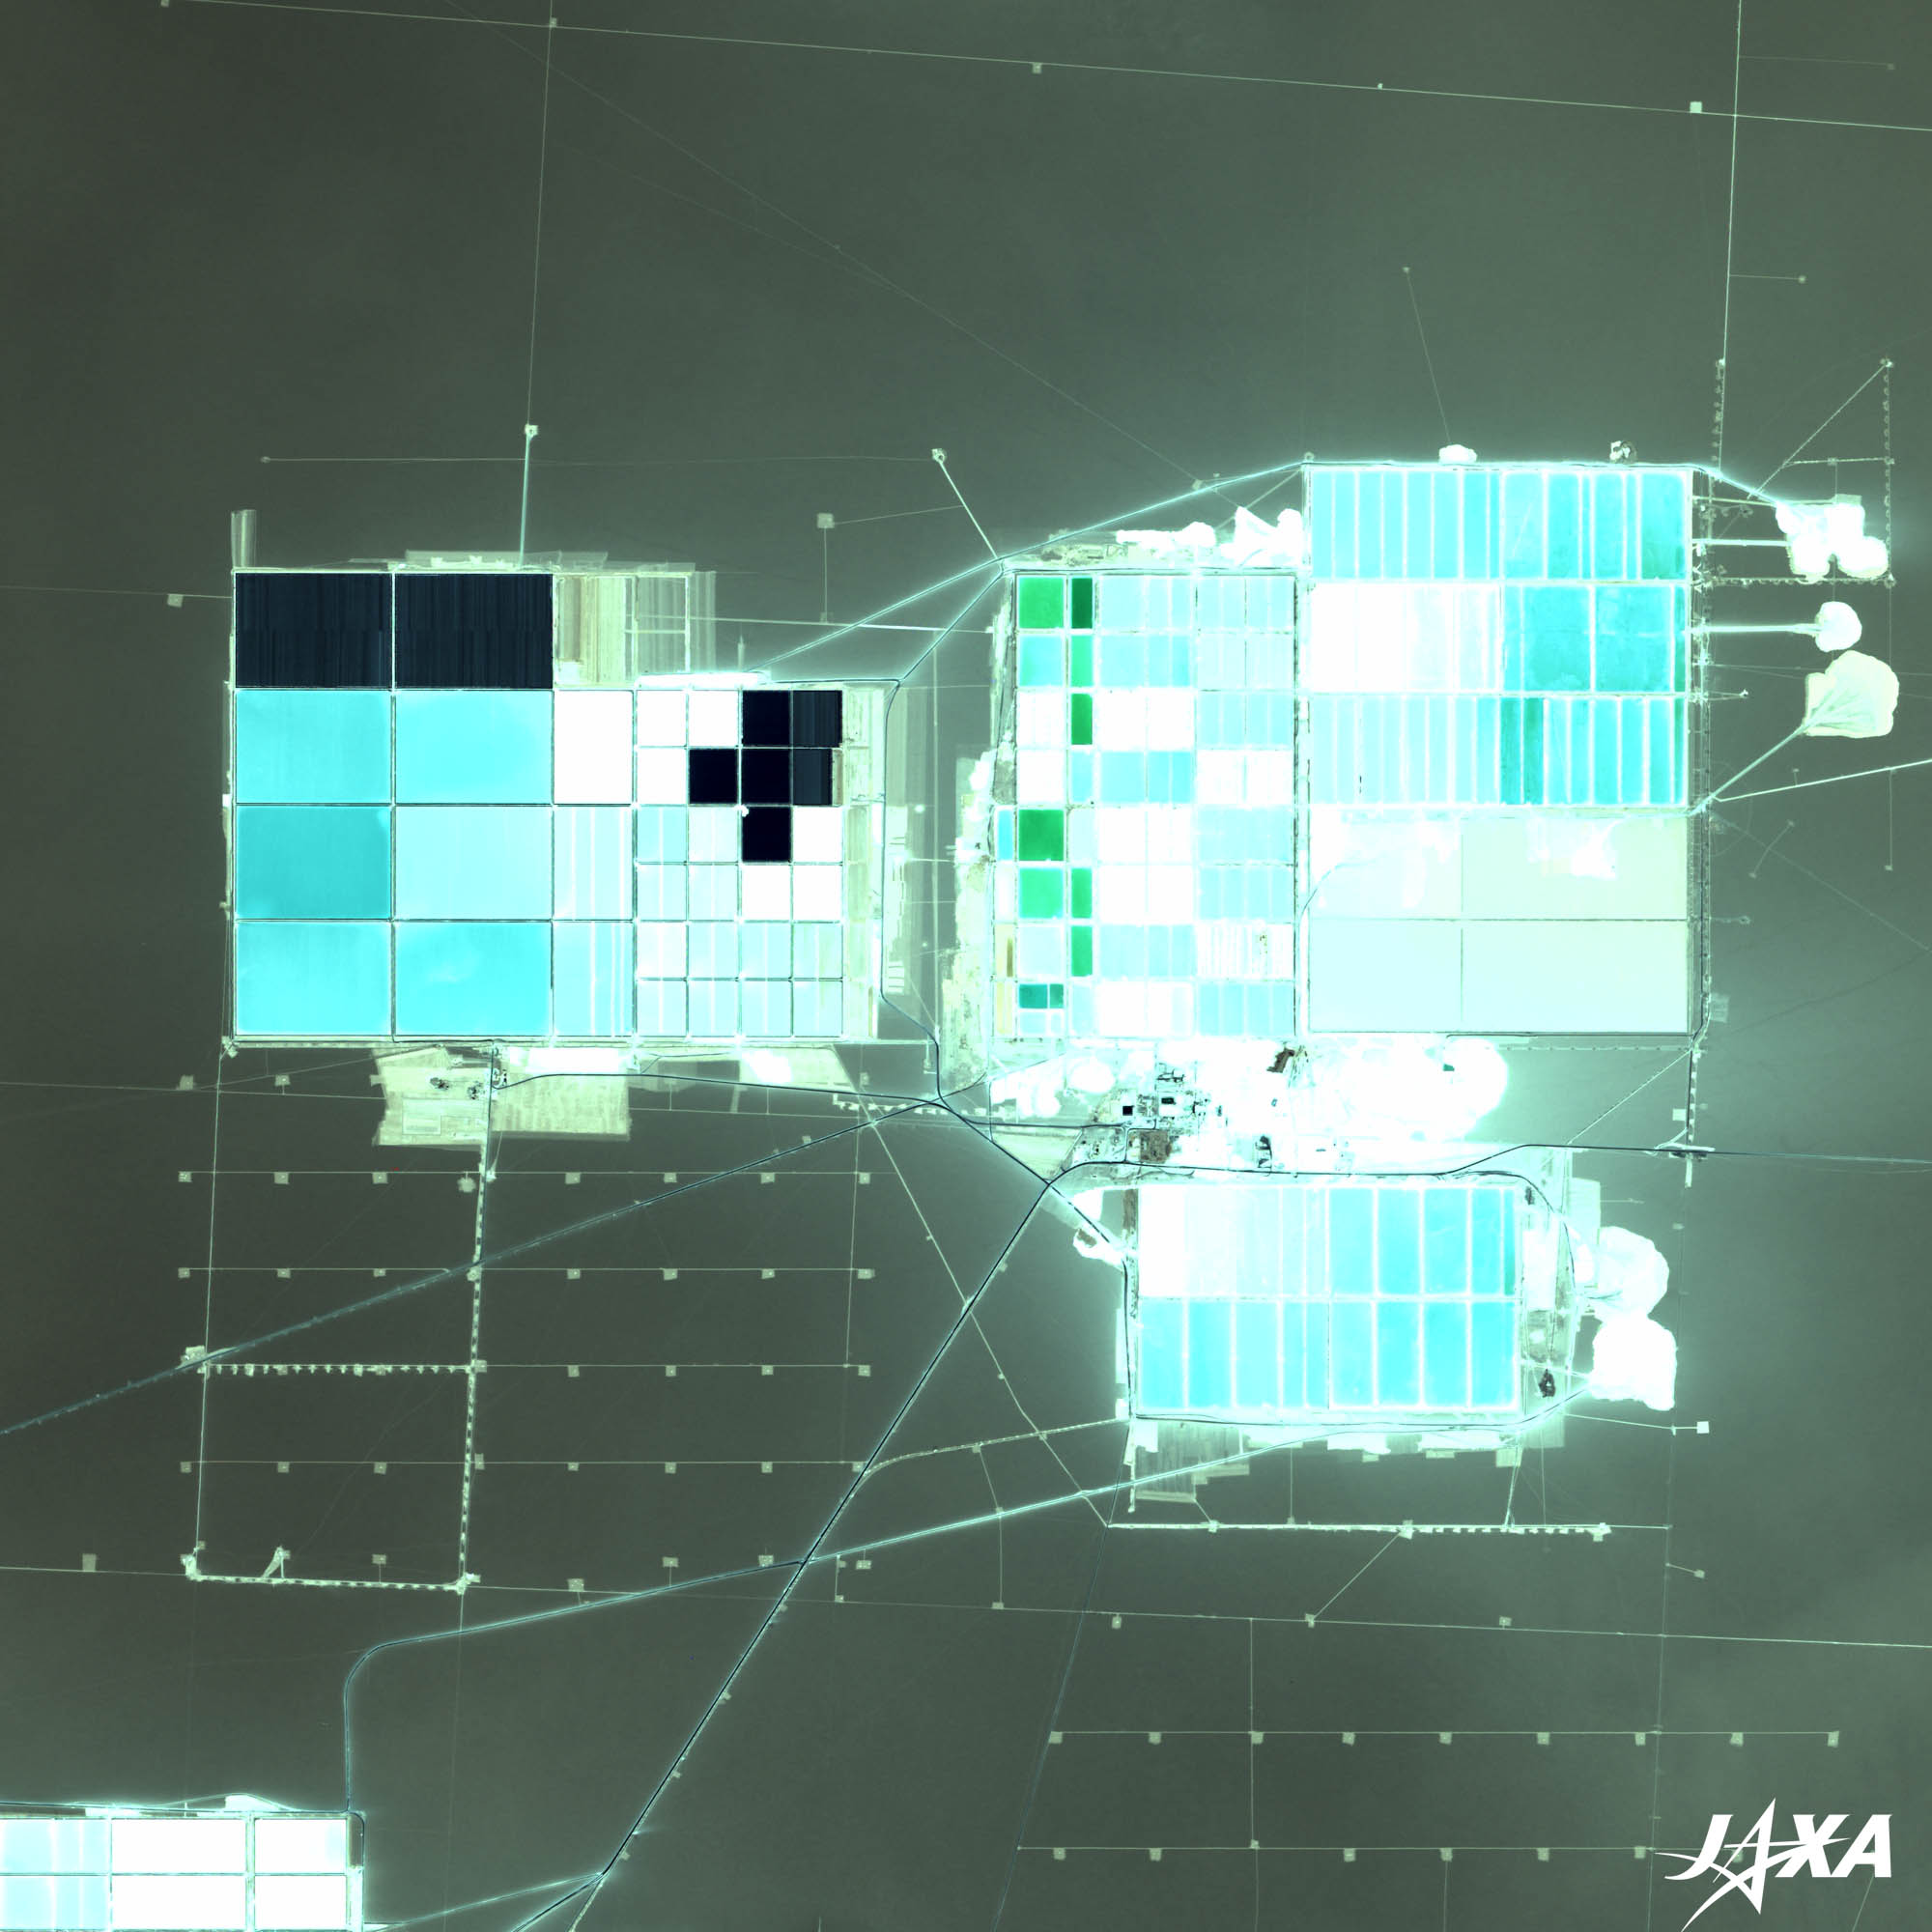
Fig. 3. Atacama salt lake and lithium-production facilities:
Lake Atacama(kmz, 2.95 MB, low resolution) as seen on Google Earth;
Lithium production facilities(kmz, 2.53 MB, low resolution) as seen on Google Earth
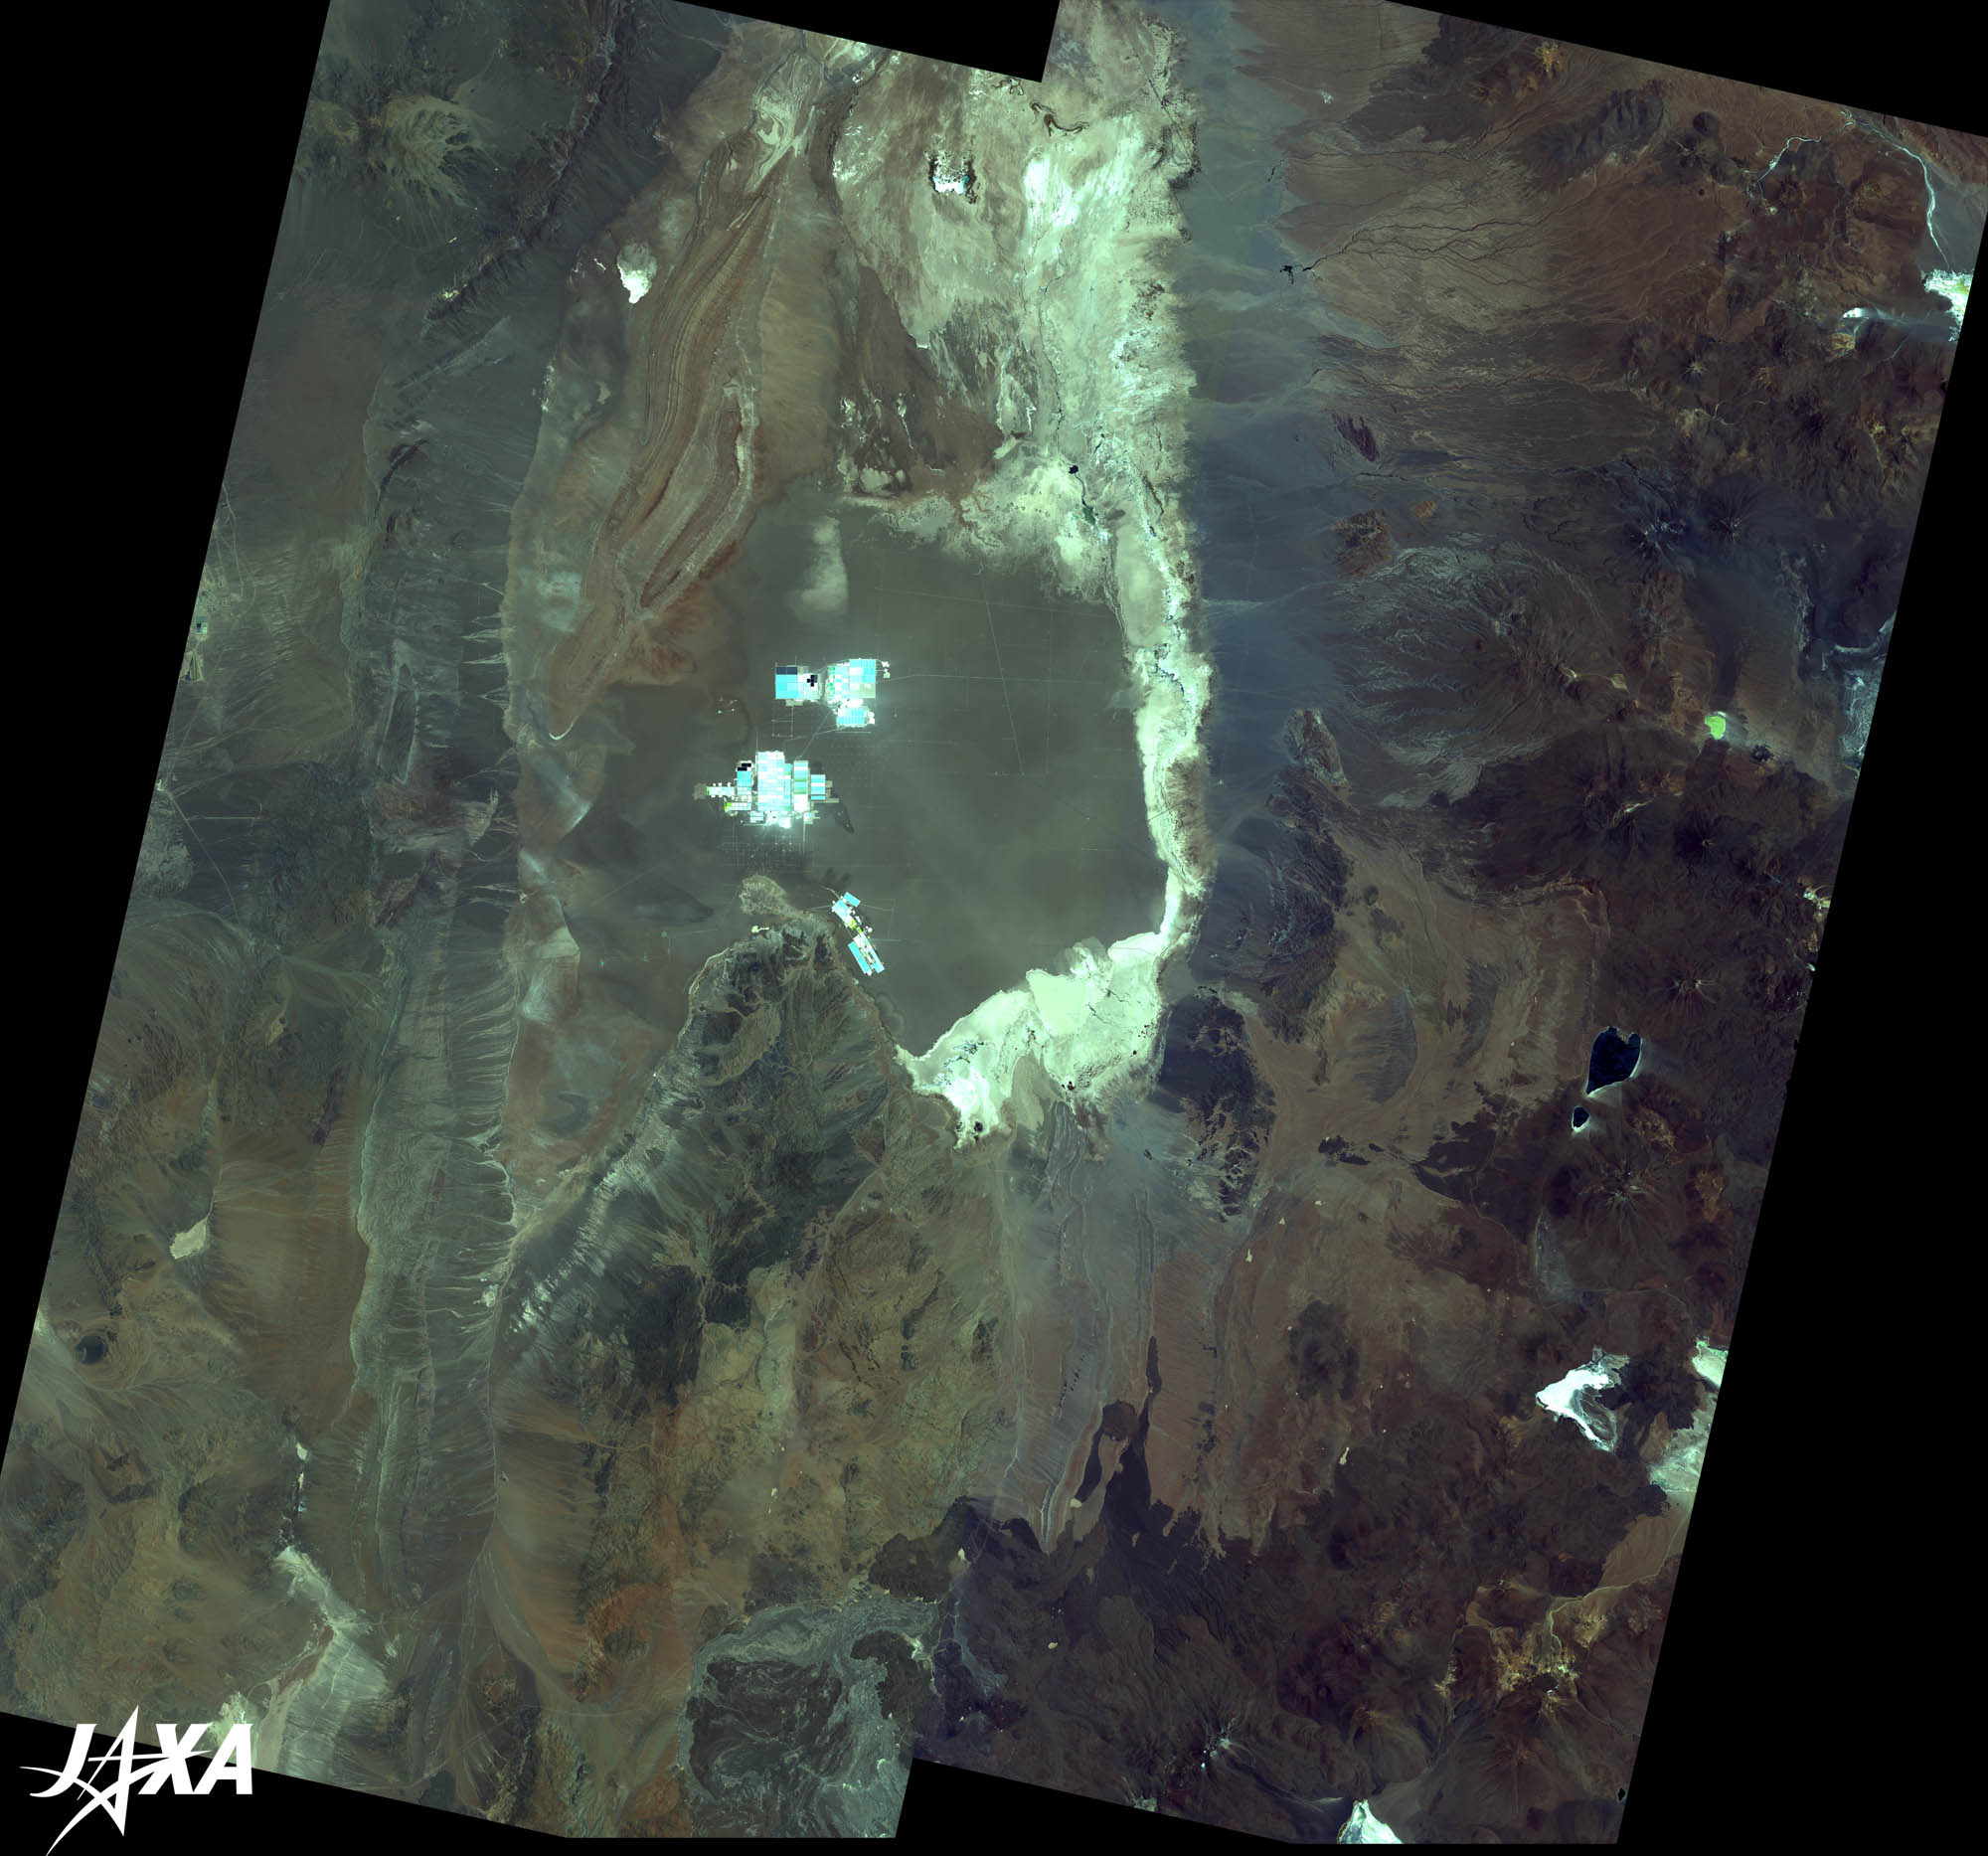
Figure 3 presents an image of Lake Atacama taken by ALOS (“Daichi”)*3 in 2010. Lake Atacama and Lake Uyuni were both formed by tectonic movements. The lakes were once sea beds and were created by a crust lift. These lakes are rich repositories of lithium, which is used in lithium-ion batteries for electric and hybrid cars. Production facilities such as salt pans can be seen in the image. Ground water under the lake is pumped up and evaporated in the sun. The lithium is condensed and sent to production facilities. It is interesting that a material used in electric cars is mined and produced in this way.
*3) The operation of ALOS ended on May 12, 2011. ALOS accumulated 6.5 million images globally in five years and contributed to emergency disaster observations. ALOS obtained over 400 images of the Great East Japan Earthquake (March 11, 2011), and its images were made available to ten governmental agencies. Archived images obtained by ALOS will be used in the REDD+ project.
Explanation of the Images:
| Satellite: | Earth Observing System, Aqua, NASA |
| Sensor: | Advanced Microwave Scanning Radiometer for EOS (AMSR-E) |
| Date: | October 1, 2011 to October 3, 2011 (Figure 1 and Figure 2, right) |
| Satellite: | Advanced Earth-Observing Satellite II (ADEOS-II) (Midori II) |
| Sensor: | GLI: Global Imager |
| Date: | April 15, 2003 to October 24, 2003 (193 days) (Figure 2, left) |
The color composition is obtained using GLI 1-km-resolution channels, assigning red to visible channel 13 (678 nm), green to visible channel 8 (545 nm), and blue to visible channel 5 (460 nm). The resulting image has a natural color, as if seen by the naked eye. Snow, ice, and cloud are white or gray, soil or sparse vegetation is brown, and water surfaces are black. Most areas of sea water surfaces are masked by dark blue.
| Satellite: | Advanced Land Observing Satellite (ALOS) (Daichi) |
| Sensor: | Advanced Visible and Near Infrared Radiometer-2 (AVNIR-2) Panchromatic Remote-sensing Instrument for Stereo Mapping (PRISM) |
| Date: |
14:46 (UTC) on November 30, 2010 (AVNIR-2) (Fig. 3, left) 14:48 (UTC) on December 17, 2010 (AVNIR-2 and PRISM) (Fig. 3) |
| Ground resolution: | 10m (AVNIR-2) and 2.5m (PRISM) |
| Map Projection: | Universal Transversal Mercator (UTM) |
AVNIR-2 has four observation bands. The color composite images are produced by assigning red to band 3 (610–690 nm), green to band 2 (520–600 nm), and blue to band 1 (420–500 nm). The resulting images have natural coloring, as if seen by the naked eye. Each color indicates the following ground objects;
| Red-brown, brown, black: | Bare soil, rocks |
| White: | Salt, cloud |
| Bluish-green: | Water surface |
(Fig. 3)
PRISM is an optical sensor for observing ground surfaces with visible and near-infrared signals in the 520–770-nm (one-billionth of a meter) band. The image is monochromatic but has a high resolution. PRISM has three independent optical systems for simultaneously acquiring images showing nadir, forward, and backward views. The nadir image is used in the figure.
The above AVNIR-2 color composite image is decomposed into hue, saturation, and intensity. The intensity portion is replaced by PRISM data. The hue, saturation, and intensity data are then reversed into a color image. This color image has a virtual 2.5-m resolution. A color image composed by combining a higher-resolution monochromatic image and a lower-resolution color image is called a pan-sharpened image.
Related Sites
Radio Astronomical Observatories on Atacama Plateau
What color is the Earth’s surface? – Cloud-free global land-surface images from GLI–
Search by Year
Search by Categories


Tags
-
#Earthquake
-
#Land
-
#Satellite Data
-
#Aerosol
-
#Public Health
-
#GCOM-C
-
#Sea
-
#Atmosphere
-
#Ice
-
#Today's Earth
-
#Flood
-
#Water Cycle
-
#AW3D
-
#G-Portal
-
#EarthCARE
-
#Volcano
-
#Agriculture
-
#Himawari
-
#GHG
-
#GPM
-
#GOSAT
-
#Simulation
-
#GCOM-W
-
#Drought
-
#Fire
-
#Forest
-
#Cooperation
-
#Precipitation
-
#Typhoon
-
#DPR
-
#NEXRA
-
#ALOS
-
#GSMaP
-
#Climate Change
-
#Carbon Cycle
-
#API
-
#Humanities Sociology
-
#AMSR
-
#Land Use Land Cover
-
#Environmental issues
-
#Quick Report
-
#GOSAT-GW
Related Resources


Related Tags
Latest Observation Related Articles
-
 Latest Observation 2026.06.05 Fri [Quick Report] Typhoon No. 6, “JANGMI”, brought heavy rain to Japan. – Results of satellite data analysis –
 -
 Latest Observation 2026.04.16 Thu [Quick Report] EarthCARE Captured the Eye of Typhoon Sinlaku
 -
 Latest Observation 2025.12.03 Wed [Quick Report] Analysis results from satellite precipitation data on the record-breaking heavy rainfall occurring in Southeast Asia in late November 2025
 -
 Latest Observation 2025.10.01 Wed [Quick Report] Hurricane Humberto “Eye” captured by EarthCARE satellite (Hakuryu)
Stay Connected
