
Latest Observation
2024.11.06 Wed
[Quick Report] Heavy rainfalls in eastern Spain, as seen by the Global Satellite Mapping of Precipitation (GSMaP)
On October 29, 2024, record rainfall occurred in the Valencian region of eastern Spain. It has been reported that a year’s worth of rain fell in just eight hours in a town in the western region of Valencia (The State Meteorological Agency, AEMET), causing flooding in many areas. JAXA monitors the precipitation from space through the Global Satellite Mapping of Precipitation (GSMaP). This time, we analyzed the precipitation in eastern Spain.
Figure 1 shows the hourly precipitation observed by GSMaP from October 28 to 29, 2024. Rainfall observations from space also showed heavy precipitation occurring in eastern Spain from the early hours of the 29th.
Figure 2 shows the precipitation observed by GSMaP as the accumulated precipitation from 0:00 (UTC) on October 28, 2024. Rain continues to fall in fixed areas of eastern Spain, and at 18:00 on October 29, 2024, we can see that some areas have received more than 500 mm of rain in total since 0:00 on October 28.
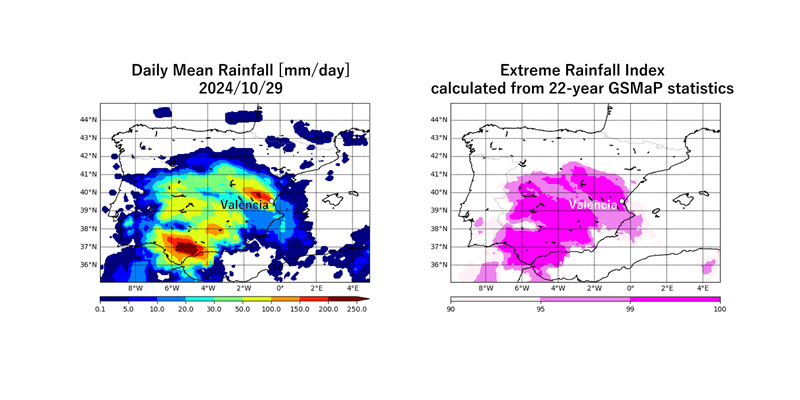
Figure 3 (left) shows the daily mean precipitation on October 29, 2024 calculated from GSMaP statistical data. More than 100 mm of rain in a single day was captured as it spread across the western side of Valencia. The normal amount of precipitation in the region calculated from GSMaP data for the past 22 years is 2.0 mm/day, and recent heavy rain, which exceeded 100 mm/day, was significantly heavier than past examples. As shown in Figure 3 right, when compared with the extreme rainfall index (Note 1) calculated from statistical values over the past 22 years, it can be seen that extreme rainfall occurred with a rare frequency compared to past statistics.

Note 1:The extreme rainfall index indicates areas that experienced precipitation equivalent to the top 10% or more compared to the average precipitation amount for the same period over the past 22 years (April 2000 to March 2022).
Related Websites
JAXA Global Rainfall Watch
JAXA Climate Rainfall Watch
JAXA GPM website
Search by Year
Search by Categories
Tags
-
#Earthquake
-
#Land
-
#Satellite Data
-
#Aerosol
-
#Public Health
-
#GCOM-C
-
#Sea
-
#Atmosphere
-
#Ice
-
#Today's Earth
-
#Flood
-
#Water Cycle
-
#AW3D
-
#G-Portal
-
#EarthCARE
-
#Volcano
-
#Agriculture
-
#Himawari
-
#GHG
-
#GPM
-
#GOSAT
-
#Simulation
-
#GCOM-W
-
#Drought
-
#Fire
-
#Forest
-
#Cooperation
-
#Precipitation
-
#Typhoon
-
#DPR
-
#NEXRA
-
#ALOS
-
#GSMaP
-
#Climate Change
-
#Carbon Cycle
-
#API
-
#Humanities Sociology
-
#AMSR
-
#Land Use Land Cover
-
#Environmental issues
-
#Quick Report
Related Resources
Related Tags
Latest Observation Related Articles
-
 Latest Observation 2025.12.03 Wed [Quick Report] Analysis results from satellite precipitation data on the record-breaking heavy rainfall occurring in Southeast Asia in late November 2025
 -
 Latest Observation 2025.10.01 Wed [Quick Report] Hurricane Humberto “Eye” captured by EarthCARE satellite (Hakuryu)
 -
 Latest Observation 2025.02.28 Fri The world’s largest iceberg, A23a, may have run aground on the continental shelf of South Georgia:
The trajectory of iceberg A23a observed by “GCOM-W”, “ALOS-2” and “ALOS-4” -
 Latest Observation 2024.10.11 Fri Antarctic Winter Sea Ice Extent Second lowest in Satellite History


