


Meteorology and the Environment
2025.10.02 Thu
Satellite Observations and Flood Forecasts for Line-shaped Rainbands in August 2025
In the summer of 2025, Japan experienced record-high temperatures. According to the Japan Meteorological Agency (JMA), the average summer temperature in Japan set a new record as the highest since records began in 1898 (JMA press release, Reiwa 7). Meanwhile, some areas experienced record-breaking rainfall during the first half of August. From August 8 to 11, 2025, the Kyushu region saw heavy rain due to a weather front. In particular, line-shaped rainbands (Senjo-Kousuitai) developed over the Fukuoka and Kitakyushu areas on the night of August 10, prompting the JMA to issue a “Bulletin on Significant Heavy Rain.” A heavy rain emergency warning was issued in Kumamoto Prefecture in the early hours of August 11, causing severe flooding and landslides, primarily in Kumamoto City, Tamana City, Yatsushiro City, and Kosa Town. We wish to extend our deepest sympathy to all those who have suffered hardship from the disasters.
In order to contribute to the monitoring and prediction of such disasters, JAXA is engaged in multifaceted technological development and the provision of information based on satellite observations. This time, we will introduce one example.
Monitoring rain from both space and the ground
The Global Satellite Mapping of Precipitation (GSMaP) calculates global precipitation distributions from data of the GPM Core Observatory and multiple constellation satellites (groups of satellites from each country or agency participating in GPM) including Advanced Microwave Scanning Radiometer 2 (AMSR2) onboard the Global Change Observation Mission – Water “SHIZUKU” (GCOM-W). Although Japan has set up a network of rain gauges and weather radars to monitor rainfall, GSMaP is highly effective for understanding conditions in areas not covered by these systems, including the open sea and countries with limited observation stations.
Figure 1 shows moving images of hourly precipitation changes and accumulated precipitation around Japan from August 9, 2025, as observed by GSMaP. We can see that heavy precipitation persisted continuously, particularly over the Kyushu region.
Since 1998, GSMaP has been providing global precipitation data. We can statistically estimate how rare this rainfall event was compared to past rains by accumulating long-term observation data and using an extreme heavy rainfall index. Figure 2 shows the distribution of the extreme heavy rainfall index for August 10, as calculated based on GSMaP data. The extreme heavy rainfall index is calculated as the area where the daily precipitation on the target day corresponds to the top several percentiles compared to the daily average rainfall at a given location over the past 20 years or more. As shown in Figure 2, a dark pink area extends from central-northern Kyushu to the Chugoku and Shikoku regions, indicating extremely heavy rainfall with a frequency that is rare compared to historical statistics. This extreme heavy rainfall index is available for anyone to view on the “JAXA Climate Rainfall Watch” page.
To utilize satellite observation data to elucidate and predict the mechanisms of line-shaped rainbands, which have occurred frequently in recent years, JAXA joined the “agreement regarding the promotion of research to contribute to the elucidation of the mechanism of line-shaped rainbands and the improvement of forecasting technology” of the Japan Meteorological Agency’s Meteorological Research Institute (hereinafter referred to as the “MRI”) in May 2022. By providing data from various Earth observation satellites (GPM, GCOM-W, GCOM-C, etc.) and ground-based precipitation observation instruments used for their validation to the linear rainband database operated by the MRI, they are helping researchers at the partner institutions involved in the agreement. This data is also available on the “JAXA Line-shaped Rainband Intensive Observation Monitor.” Of these, the ground precipitation observation instruments were installed at two locations — Tokai University Kumamoto Campus and Nagasaki University — through joint research “Research on the elucidation of the mechanism of line-shaped rainbands using satellite data such as the Global Precipitation Measurement (GPM) and ground-based observation instruments” by JAXA, MRI, and Tokai University, and with cooperation from Nagasaki University and JAXA. Observations are still ongoing.
Figure 3 summarizes the observation results for this case obtained using ground precipitation observation instruments. For details on each instrument, please refer to this article. The top two rows show the results of observations of precipitation intensity and raindrop diameter, as measured by a disdrometer. During the evening of August 10, a rain zone moving southward (see Figure 1, top) brought extremely heavy rainfall, exceeding 140 mm/h in Kumamoto and 110 mm/h in Nagasaki shortly after the rain began. Large raindrops, exceeding 5 mm in diameter, were also observed. The third row shows the time–height section of precipitation from the micro rain radar, indicating that there were already visible precipitation echoes in the sky before the heavy rain began. It has been confirmed that, particularly during the first half of the period, the intensity of the rainfall near the ground was so great that the precipitation became invisible due to attenuation. During the latter part of the period, a “bright band” appears at an altitude of around 5 km when radar waves are strongly reflected in a “melting layer”, where falling snow turns to rain at high altitudes. This suggests that the characteristics of the precipitation system are changing. Detailed observational data on such precipitation systems has been used to help elucidate the mechanisms behind line-shaped rainbands.

Flood conditions observed by satellite data and simulations
JAXA not only observes precipitation but also contributes to understanding disaster situations such as flooding. The phased array L-band synthetic aperture radar, PALSAR-2, aboard ALOS-2 can monitor flood damage conditions at night and in poor weather, such as cloud cover. In response to requests from disaster management agencies, JAXA conducts disaster observations using ALOS-2 and provides rapid information. In this case, observations were conducted at around 11:00 p.m. on August 12, and information was provided. The black frame shown in Figure 4 indicates the observation area captured by ALOS-2, and the blue polygon inside the frame shows the observed inundated areas. In particular, we can see that extensive flooding has been observed over a wide area in the lower reaches of the Midorikawa River and Chikugo River.
Such observational information is promptly shared with relevant organizations and utilized for the post-disaster response. Also, research and development to estimate increasing flood risk in advance and connect it to disaster prevention and mitigation are important. JAXA is jointly researching and developing “Today’s Earth,” a global terrestrial hydrological simulation system, with the University of Tokyo. “Today’s Earth – Japan (TE-Japan)” performs land simulations based on forecasts of atmospheric physical parameters such as rainfall, snowfall, temperature, and wind speed, predicting river flow and water levels, flood area, soil moisture, and other quantities more than 30 hours in advance.
Figure 4 shows the forecast results (maximum values for each grid cell) of the “flood fraction (the ratio of the flooded area to the simulation grid area)” estimated by TE-Japan from 0:00 on August 11 to 39 hours ahead, overlaid on ALOS-2 observations and displayed as a red gradient. Looking at this, in the lower reaches of the Midorikawa River, Kikuchi River, and Chikugo River where ALOS-2 has observed inundated areas, TE-Japan also estimates large values, confirming that the results are generally consistent.

Figure 5 shows the river flow forecasts from TE-Japan starting at 18:00 on August 10, and it can be seen that the model predicts increased flows for the Midorikawa River and Chikugo River, which experienced flooding. Based on these forecast data, we also perform a statistical analysis to present the information as an easier-to-understand hazard level by comparing the forecast results with past estimates and converting the forecasted water levels and flows at a given time into a “return period” that indicates how frequently such an extreme event would occur (for example, once every N years).
Now, let’s take a look at the Jonan gauge station on the Kikuchi River, which was established by the Ministry of Land, Infrastructure, Transport and Tourism. On August 11, at 5:00, the observed water level at this station exceeded the “hazardous water level,” which triggers evacuation orders. Figure 6 shows the observed water level at the Jonan gauge station, as well as the temporal changes in the predicted river water levels at each initial time, as calculated by TE-Japan. Examining this, it can be seen that the initial predictions made at 12:00 on 10 August indicated water levels corresponding to a return period of 50 years or more — in other words, a high water level that occurs roughly once every 50 years — and this shows that a dangerous situation had been forecasted 17 hours earlier. In practice, processing the data takes several hours from the initial time, but even taking this into account, the dangerous state could have been predicted about 12 hours in advance. TE-Japan provides future forecast results only to partner research organizations under the Meteorological Service Act. However, the estimated results for the return period from the past up to the present are available to anyone on the Today’s Earth website.

Reducing the risk of water-related disasters
In collaboration with relevant organizations, JAXA will continue to advance research and development to mitigate water-related disaster risks. Furthermore, in addition to providing information during water disasters using satellite data itself, we aim to contribute to faster situation assessment, water disaster risk prediction, and seamless information provision by developing technologies that integrate satellite observations with numerical simulations.
Search by Year
Search by Categories


Tags
-
#Earthquake
-
#Land
-
#Satellite Data
-
#Aerosol
-
#Public Health
-
#GCOM-C
-
#Sea
-
#Atmosphere
-
#Ice
-
#Today's Earth
-
#Flood
-
#Water Cycle
-
#AW3D
-
#G-Portal
-
#EarthCARE
-
#Volcano
-
#Agriculture
-
#Himawari
-
#GHG
-
#GPM
-
#GOSAT
-
#Simulation
-
#GCOM-W
-
#Drought
-
#Fire
-
#Forest
-
#Cooperation
-
#Precipitation
-
#Typhoon
-
#DPR
-
#NEXRA
-
#ALOS
-
#GSMaP
-
#Climate Change
-
#Carbon Cycle
-
#API
-
#Humanities Sociology
-
#AMSR
-
#Land Use Land Cover
-
#Environmental issues
-
#Quick Report
-
#GOSAT-GW
Related Resources


Related Tags
Meteorology and the Environment Related Articles
-
 Meteorology and the Environment 2025.11.05 Wed The Breakup of the World’s Largest Iceberg, “A23a”: The Trajectory of Iceberg A23a Observed by “GCOM-W”, “ALOS-2”, “ALOS-4” and the Latest Satellite, “GOSAT-GW”
 -
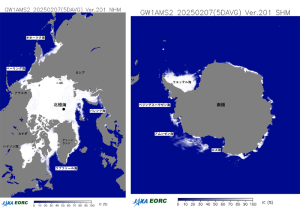 Meteorology and the Environment 2025.05.20 Tue February 2025: Global Sea Ice Extent Reaches its Lowest in the History of Satellite Observations
 -
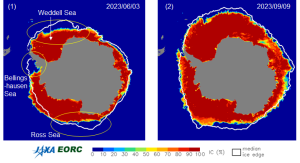 Meteorology and the Environment 2023.10.11 Wed Climate Change 2023 (2) : Antarctic Winter Sea Ice Extent Lowest Ever Recorded
 -
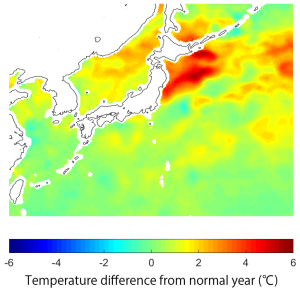 Meteorology and the Environment 2023.08.31 Thu Climate Change 2023 (1) : Sea Surface Temperature Rise and El Niño Event
Stay Connected
