
Latest Observation
2024.08.15 Thu
Monitoring and forecasting damage from heavy rainfall in the Tohoku region by combining satellite data and simulations
From July 25 to the early morning of July 26, 2024, the Tohoku region experienced record-breaking heavy rainfall, especially in Yamagata and Akita prefectures. We wish to extend our deepest sympathy to all those who have suffered hardship from the disasters. JAXA monitors precipitation conditions using the Global Precipitation Measurement (GPM) core observatory and the Global Satellite Mapping of Precipitation (GSMaP), estimates flood risks on the ground using Today’s Earth, a terrestrial hydrological simulation system that combines data from various satellites, and estimates flooded areas using the Advanced Land Observing Satellite-2 “DAICHI-2” (ALOS-2). Here we introduce some preliminary results.
GSMaP observations of heavy rainfall that hit the Tohoku region
GSMaP products calculate global precipitation distribution from GPM core observatory data and data from multiple constellation satellites (satellites from countries and organizations participating in the GPM project) including the AMSR2 onboard the Global Change Observation Mission – Water “SHIZUKU” (GCOM-W). In Japan, an observation network using rain gauges and radar has been established to monitor precipitation. However, GSMaP is extremely effective in understanding the situation over the ocean, which these networks cannot cover, and in countries with few in-situ observations. Figure 1 shows an animation of hourly precipitation changes and accumulated precipitation amounts around Japan using GSMaP from July 24, 2024. This shows that heavy precipitation occurred continuously, mainly in the Tohoku region.
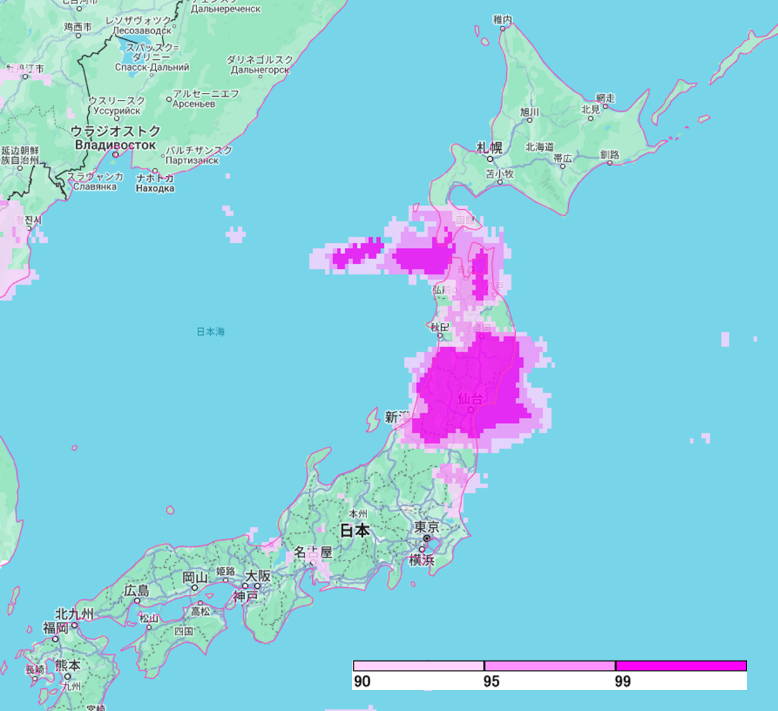
GSMaP provides global precipitation data from 1998 to the present. With the accumulation of such long-term observation data, we can statistically estimate how rare this amount of precipitation was compared to past rains as an extreme heavy rainfall index. Figure 2 shows the extreme heavy rainfall index calculated based on GSMaP on July 25. The extreme heavy rainfall index is calculated as an area where heavy precipitation occurred during a given date and time, with a 24-hour rainfall amount equivalent to the top several percent of the average rainfall over the past 20 years or more at the same location. Figure 2 shows that there is a dark pink area in the Tohoku region, where extremely heavy rainfall occurred that is extremely rare compared to past statistics. Anyone can access these extreme heavy rainfall index on the “JAXA Climate Rainfall Watch” page.

Flood risk estimates by Today’s Earth – Japan
Precipitation information is very important from the perspective of disaster prevention and mitigation, but the locations where heavy rain is falling do not necessarily coincide with the locations where flooding will occur on the ground. This is because the water brought by rain flows, infiltrates, or evaporates depending on the topography and soil conditions. In order to accurately determine where the risk of flooding is actually high, it is necessary to calculate and estimate such water behavior (water cycle) based on physics. JAXA is developing and operating the terrestrial hydrological simulation system “Today’s Earth” in collaboration with the University of Tokyo to gain a detailed understanding of the global water cycle based on satellite observations. “Today’s Earth – Japan (TE-Japan)” allows anyone to view real-time information on water in Japan, such as river flow, evapotranspiration from the ground, and soil moisture content, on a web page. Aiming to estimate the water cycle more accurately, TE-Japan has begun using high-resolution land-use and land-cover maps from observations by the ALOS series and other satellites, as well as solar radiation from the Himawari geostationary meteorological satellite, and is undergoing a major upgrade on July 2, 2024 (see public documentation for details).
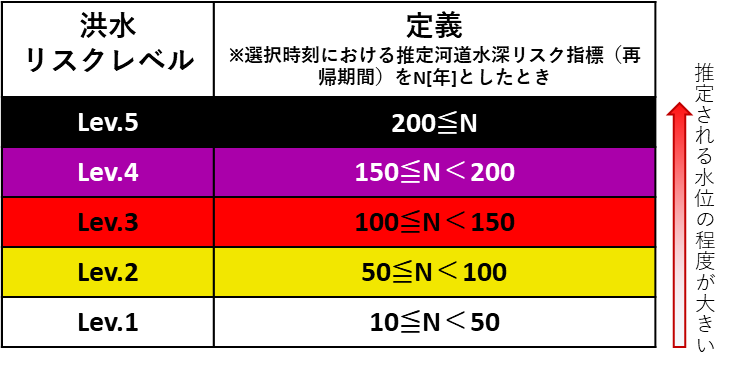
Let’s take a look at the estimation results obtained by inputting the actual observed precipitation (JMA analytical rainfall) into TE-Japan. Figure 3 left shows the temporal change in flood risk levels (*1) estimated by TE-Japan. TE-Japan currently considers flood risk to be extremely high when a river water level that occurs once in 200 years or more is estimated. This time, the black areas corresponding to this value can be seen to be centered around Akita Prefecture (around the Omono River and Koyoshi River) and Yamagata Prefecture (around the Mogami River), where major damage actually occurred (webpage here). The materials released by the Ministry of Land, Infrastructure, Transport and Tourism and the Japan Meteorological Agency (JMA) at that time also indicated a high risk of flood and inundation damage in the area, which suggests that TE-Japan was able to properly estimate flood risk.
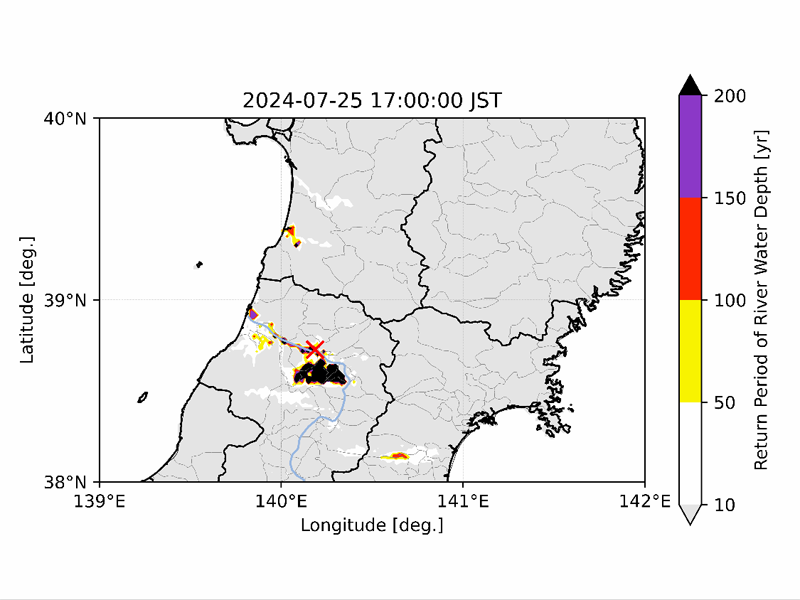
Information like that shown in Figure 3 can be estimated after actual rainfall observations are made and is not available in real time. Then, is it possible to know about these risks in advance? TE-Japan uses weather forecast data from the Japan Meteorological Agency as input to perform forecast simulations for up to 30 hours in advance. In this report, the results of risk predictions were post-verified using the example of Tozawa Village, Yamagata Prefecture (the location indicated by the “X” in Figure 3), where a levee failure actually occurred on the Mogami River.
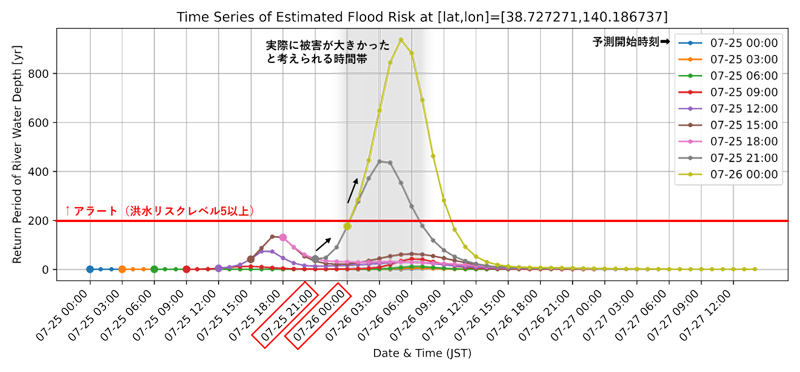
Figure 4 shows the results of a forecast simulation conducted every three hours up to 39 hours in advance, indicating at what times high risk was estimated at the same location. The forecast that began in the morning of July 25 could not estimate a high risk, but in the forecast from the afternoon of the same day, the risk gradually began to appear, and it can be seen that the forecast that started at 21:00 began to estimate a high risk of flood risk level 5 or above for the first time. This time, the lead time between the alert and the actual occurrence of major damage from midnight of the 25th to early morning of the 26th was not so long, but if sufficient time can be secured for preparations, it may contribute to mitigating the damage. The results of these TE-Japan forecasts are regularly provided to and utilized by collaborative research institutions and the ALOS-2 disaster response team, which will be described later (*2).
While improving the flood simulation itself is important for TE-Japan to estimate risk in advance, it is also important to reduce the uncertainty of the weather forecasts that serve as input. Especially for localized heavy rainfall events as this time, the uncertainty of the predicted precipitation for a long time ahead is large, and even a slight deviation of the predicted rainfall location from the actual location of the heavy rainfall can have a significant impact on preliminary flood risk estimation. For this reason, JAXA and the University of Tokyo are also conducting joint research and development into reducing the uncertainty of predicted precipitation amounts using machine learning, aiming to improve the accuracy of risk information (for more information, click here).
Estimation of inundated areas using ALOS-2
Using satellites that image the earth’s surface, it is also possible to estimate the extent of damage caused on the ground by these heavy rains. In response to a request from disaster prevention organizations, JAXA conducted emergency observations using the Advanced Land Observing Satellite-2 “Daichi-2” (ALOS-2) from July 25 to 26, 2024, and estimated the extent of flooding from the observation data, and provided the estimated results to the disaster prevention organizations.
Figure 5 shows the area where JAXA conducted emergency observations using ALOS-2 and estimated flooded areas. The L-band synthetic aperture radar “PALSAR-2” on board ALOS-2 can acquire images of the earth’s surface even at night or in bad weather, contributing to rapid situational understanding during disasters.
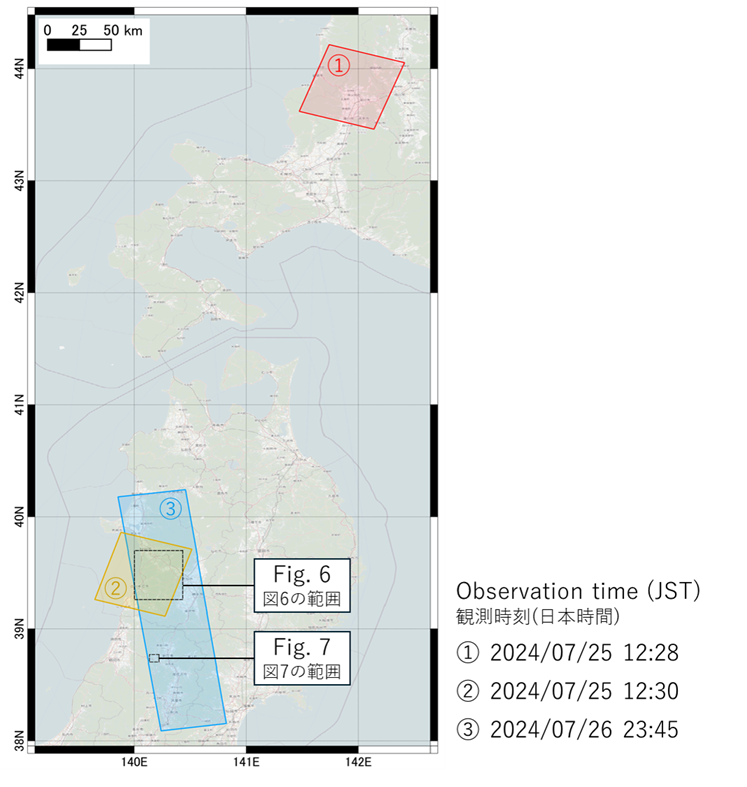
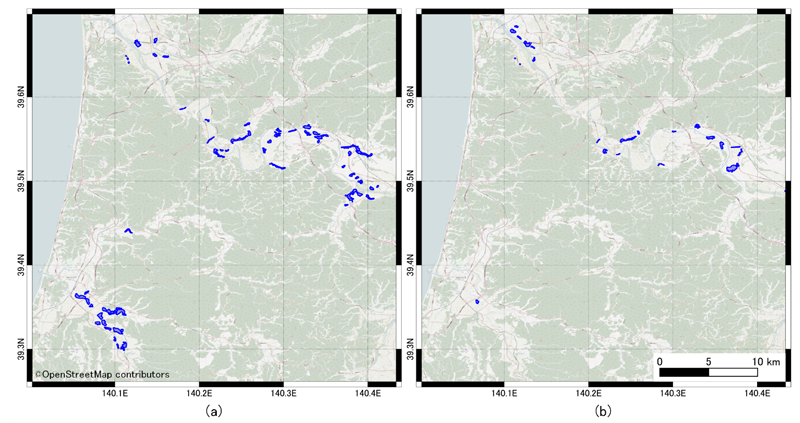
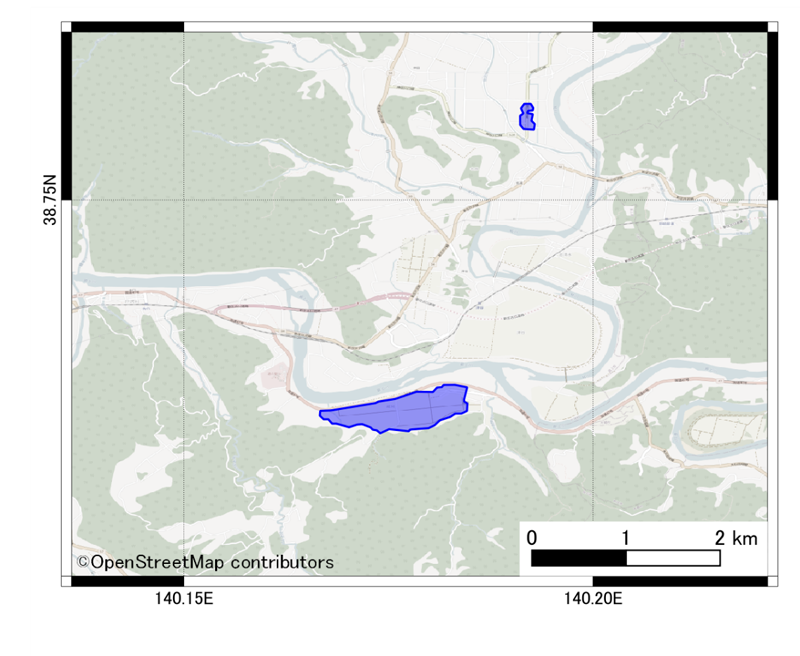
Figure 6 shows the flooded areas near Akita City (around the Omono River) and Yurihonjo City (around the Koyoshi River) in Akita Prefecture, estimated from ALOS-2 data taken (a) at around 12:30 on July 25 and (b) at around 23:45 on July 26. Comparing (a) and (b), the estimated flooded area is decreasing overall, which indicates that the water is receding over time.
Figure 7 shows the flooded area around Tozawa Village, Mogami County, Yamagata Prefecture, estimated from data from ALOS-2 at around 23:45 on July 26. Flooded areas can be seen on the left bank (south side, Kuraoka district) of the Mogami River, which flows east-west near the center of the image. Flooding has been reported in other areas of the Mogami River basin besides this one, but the water was thought to have receded by the time of ALOS-2 observations. ALOS-2 is in orbit so that it can observe all areas of Japan around 12:00 noon or midnight. The flooded area estimated by ALOS-2 is not necessarily the maximum flooded area, but the flooded area at the time of observation. During times when ALOS-2 cannot make observations, it is necessary to estimate the flood risk using methods such as the predictive simulations mentioned above. In addition to data from ALOS-2, data from TE-Japan was also used to estimate the flooded areas mentioned above in order to speed up and improve the accuracy of the estimation. Flooded area estimation was performed automatically(*3), and the estimated results were provided to cooperating disaster prevention organizations within approximately two hours of observation.
Towards providing more advanced risk information
In this way, JAXA provides information during disasters by combining data from satellite observations with information from numerical simulations that utilize this data. Satellite observations and numerical simulations are complementary, and by effectively combining them, it is possible to provide accurate, time- and spatially seamless, four-dimensional information. JAXA will continue to collaborate with collaborative research institutions on research and development to provide more advanced risk information through the more sophisticated fusion of satellite observations and numerical simulations.
*1 The flood risk level is a five-level index calculated based on the “return period” of river water levels estimated by TE-Japan. The “return period” is based on a similar concept to the GSMaP extreme heavy rainfall index mentioned above, and calculates “how many years the scale of this event occurred” based on past long-term simulation statistics.
*2 Currently, prediction data of TE-Japan is provided only to collaborative research institutions in accordance with the Meteorological Service Act. Information up to the current time is available on the public web page.
*3 M. Ohki, K. Yamamoto, T. Tadono, K. Yoshimura “Automated Processing for Flood Area Detection Using ALOS-2 and Hydrodynamic Simulation Data” Remote Sensing 2020, 12 (17), 2709. https://doi.org/10.3390/rs12172709
Search by Year
Search by Categories
Tags
-
#Earthquake
-
#Land
-
#Satellite Data
-
#Aerosol
-
#Public Health
-
#GCOM-C
-
#Sea
-
#Atmosphere
-
#Ice
-
#Today's Earth
-
#Flood
-
#Water Cycle
-
#AW3D
-
#G-Portal
-
#EarthCARE
-
#Volcano
-
#Agriculture
-
#Himawari
-
#GHG
-
#GPM
-
#GOSAT
-
#Simulation
-
#GCOM-W
-
#Drought
-
#Fire
-
#Forest
-
#Cooperation
-
#Precipitation
-
#Typhoon
-
#DPR
-
#NEXRA
-
#ALOS
-
#GSMaP
-
#Climate Change
-
#Carbon Cycle
-
#API
-
#Humanities Sociology
-
#AMSR
-
#Land Use Land Cover
-
#Environmental issues
-
#Quick Report
Related Resources
Latest Observation Related Articles
-
 Latest Observation 2025.10.01 Wed [Quick Report] Hurricane Humberto “Eye” captured by EarthCARE satellite (Hakuryu)
 -
 Latest Observation 2025.02.28 Fri The world’s largest iceberg, A23a, may have run aground on the continental shelf of South Georgia:
The trajectory of iceberg A23a observed by “GCOM-W”, “ALOS-2” and “ALOS-4” -
 Latest Observation 2024.11.06 Wed [Quick Report] Heavy rainfalls in eastern Spain, as seen by the Global Satellite Mapping of Precipitation (GSMaP)
 -
 Latest Observation 2024.10.11 Fri Antarctic Winter Sea Ice Extent Second lowest in Satellite History


