


Research and Development
2023.10.12 Thu
GCOM-C Estimation of Climate Impacts of Aerosols Associated with Extreme Global Wildfires (overview article)
– Introduction –
Wildfires are projected to increase in intensity and frequency by the end of the century due to increased heat waves and droughts associated with global warming. In fact, many parts of the world, including Canada, Greece, and Hawaii, experienced record wildfires in 2023. It is well known that wildfires emit CO2, a greenhouse gas, and also release large amounts of aerosols that block sunlight. To accurately estimate future climate change, the net effect of such wildfire-derived material releases must be properly estimated. In general, however, the cooling or heating effects of aerosols on the Earth are subject to large errors in estimation, and fire aerosols are no exception. In this article, we investigated the impact of fire aerosols on climate by analyzing data from JAXA’s GCOM-C (*1), which provides multi-wavelength optical observations (19 types of light can be observed).
This research result was published in the Journal of Geophysical Research: Atmospheres on August 26, 2023 (*2).

(*1) GCOM-C
GCOM-C (Global Change Observation Mission – Climate) is a climate change observation satellite launched by JAXA on December 23, 2017. It carries an optical radiometer called the Second generation GLobal Imager (SGLI), which performs multi-wavelength observations in the near-ultraviolet to thermal infrared region (380 nm to 12 µm).
(*2) Information of the paper
Title of the paper : Aerosol Optical Properties of Extreme Global Wildfires and Estimated Radiative Forcing With GCOM-C SGLI
Authors: Kazuhisa Tanada1, Hiroshi Murakami1, Tadahiro Hayasaka2, Mayumi Yoshida3 (1 Japan Aerospace Exploration Agency, 2 Center for Atmospheric and Oceanic Studies, Tohoku University, 3 Remote Sensing Technology Center of Japan)
Journal name : Journal of Geophysical Research: Atmospheres
DOI : https://doi.org/10.1029/2022JD037914
Publication date: August 26, 2023 (Japan time) (online release)
URL : https://agupubs.onlinelibrary.wiley.com/doi/10.1029/2022JD037914
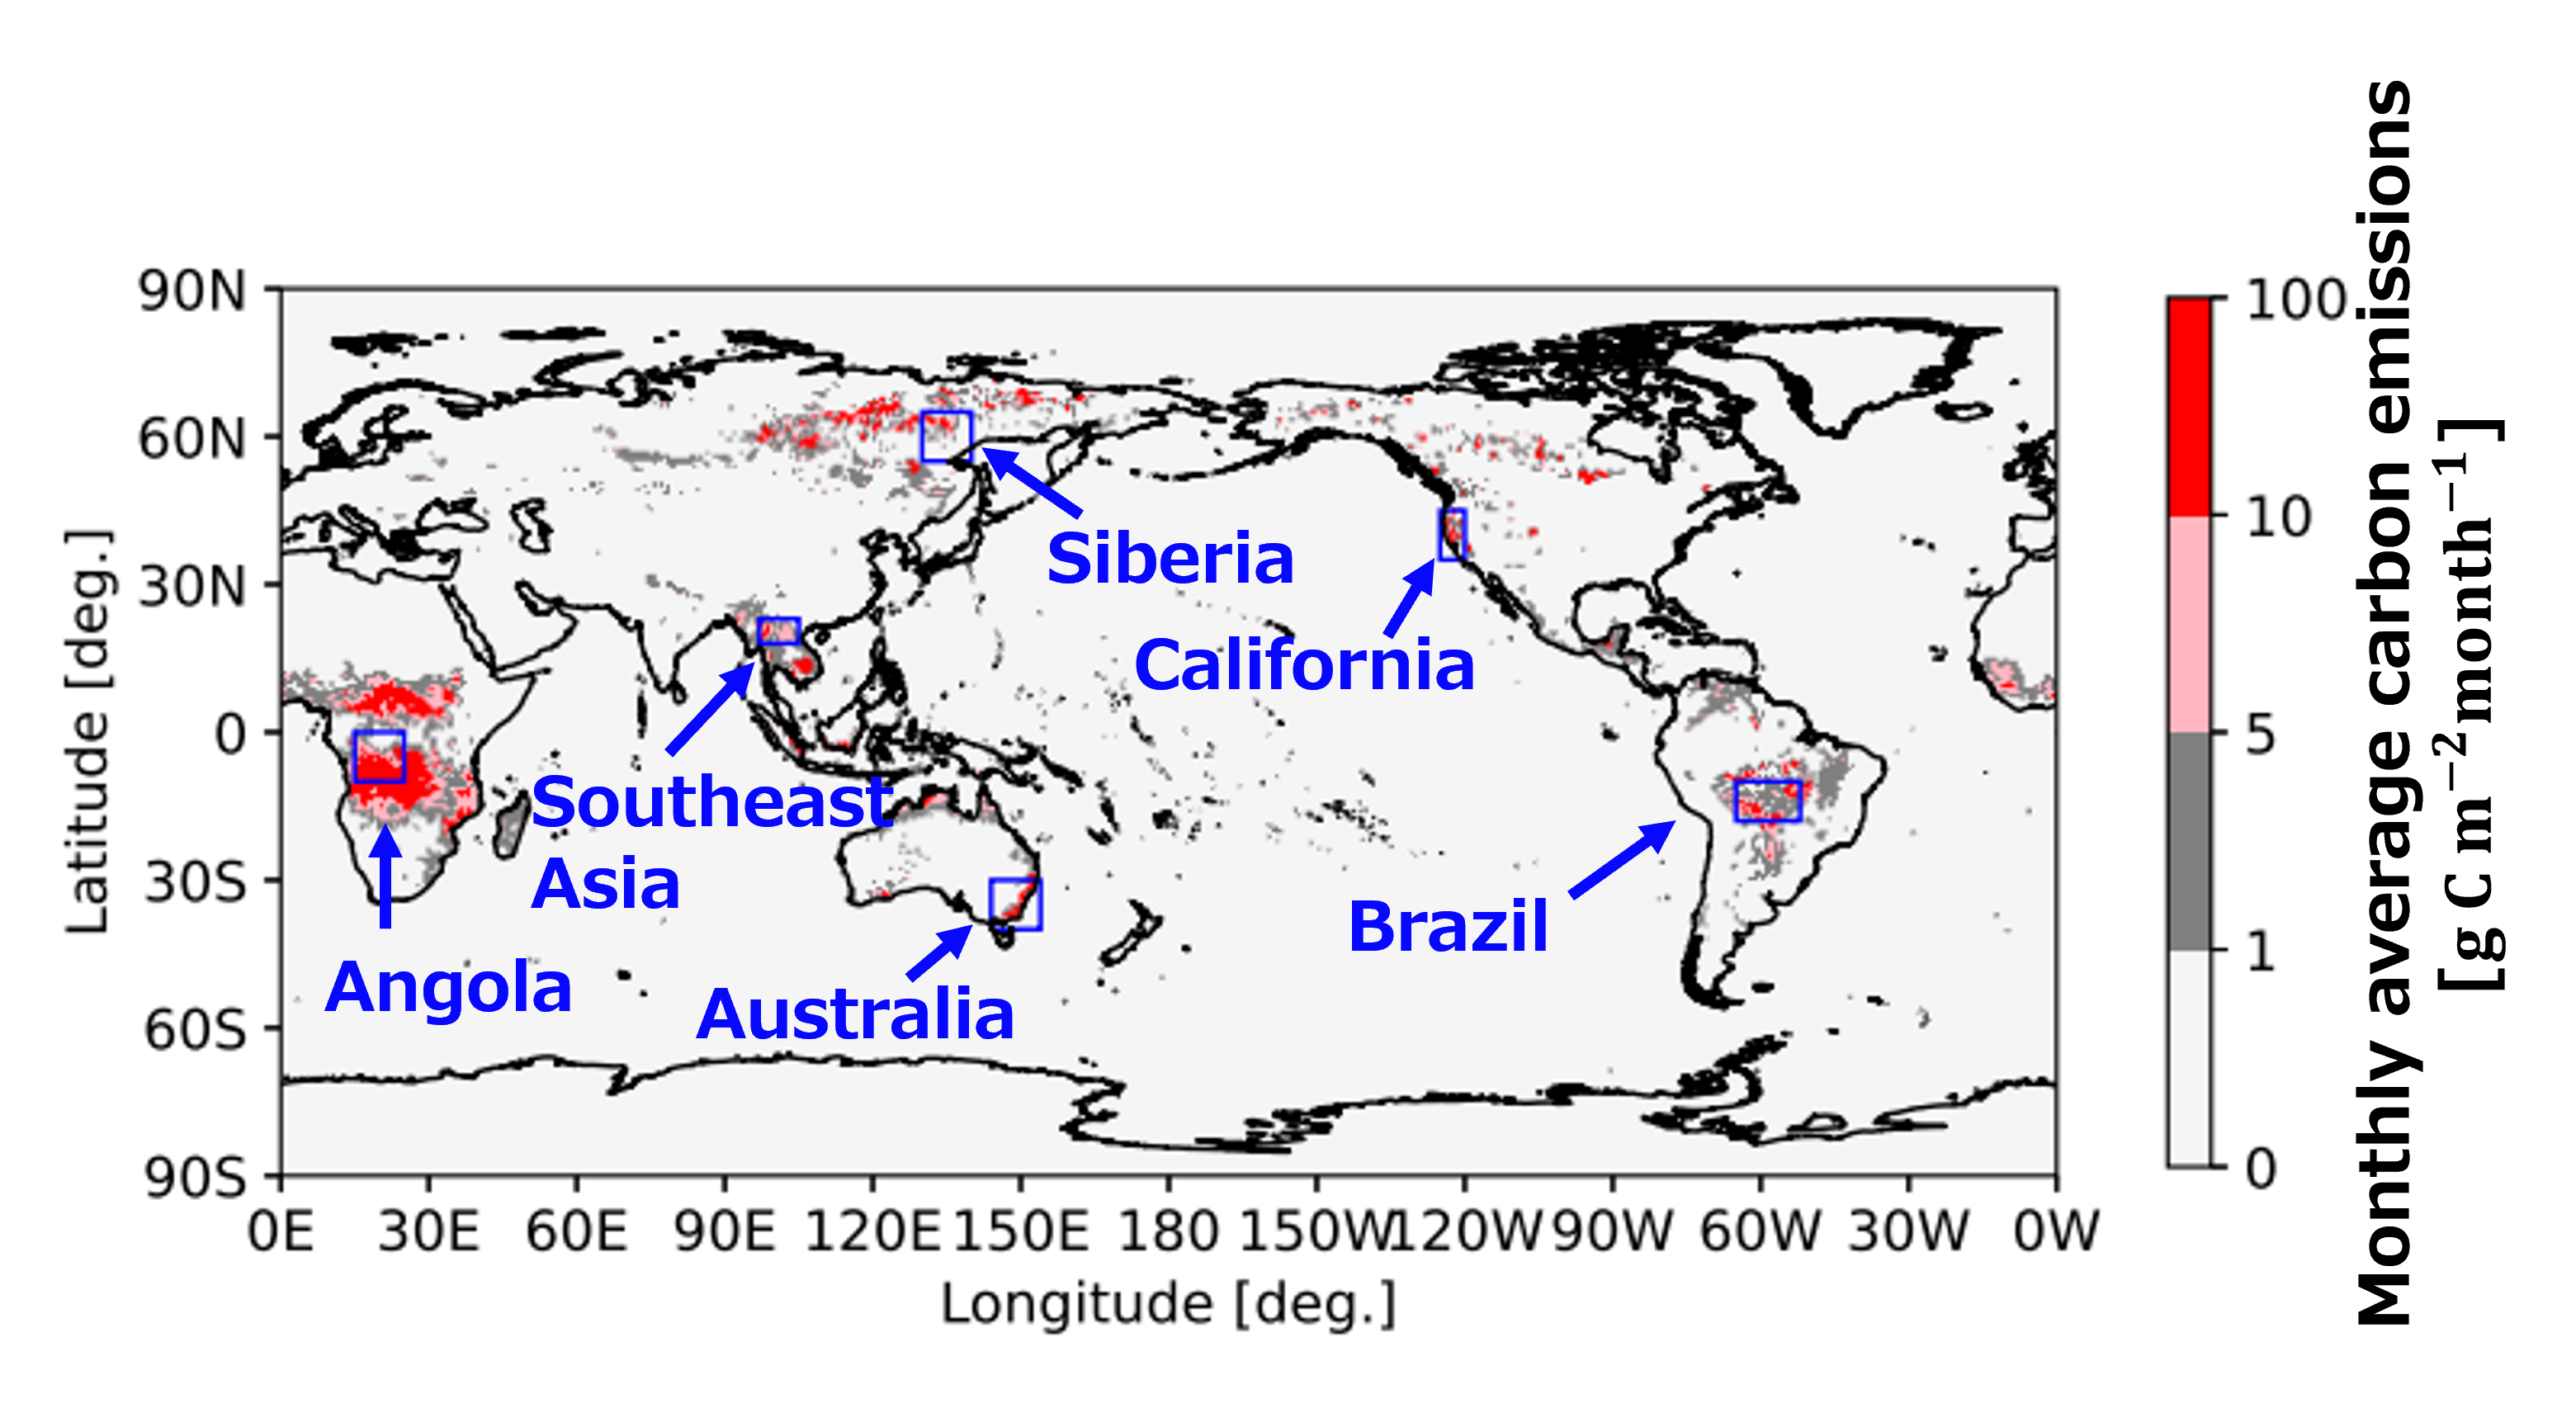
(1) Optical properties of fire aerosols in six regions of the world
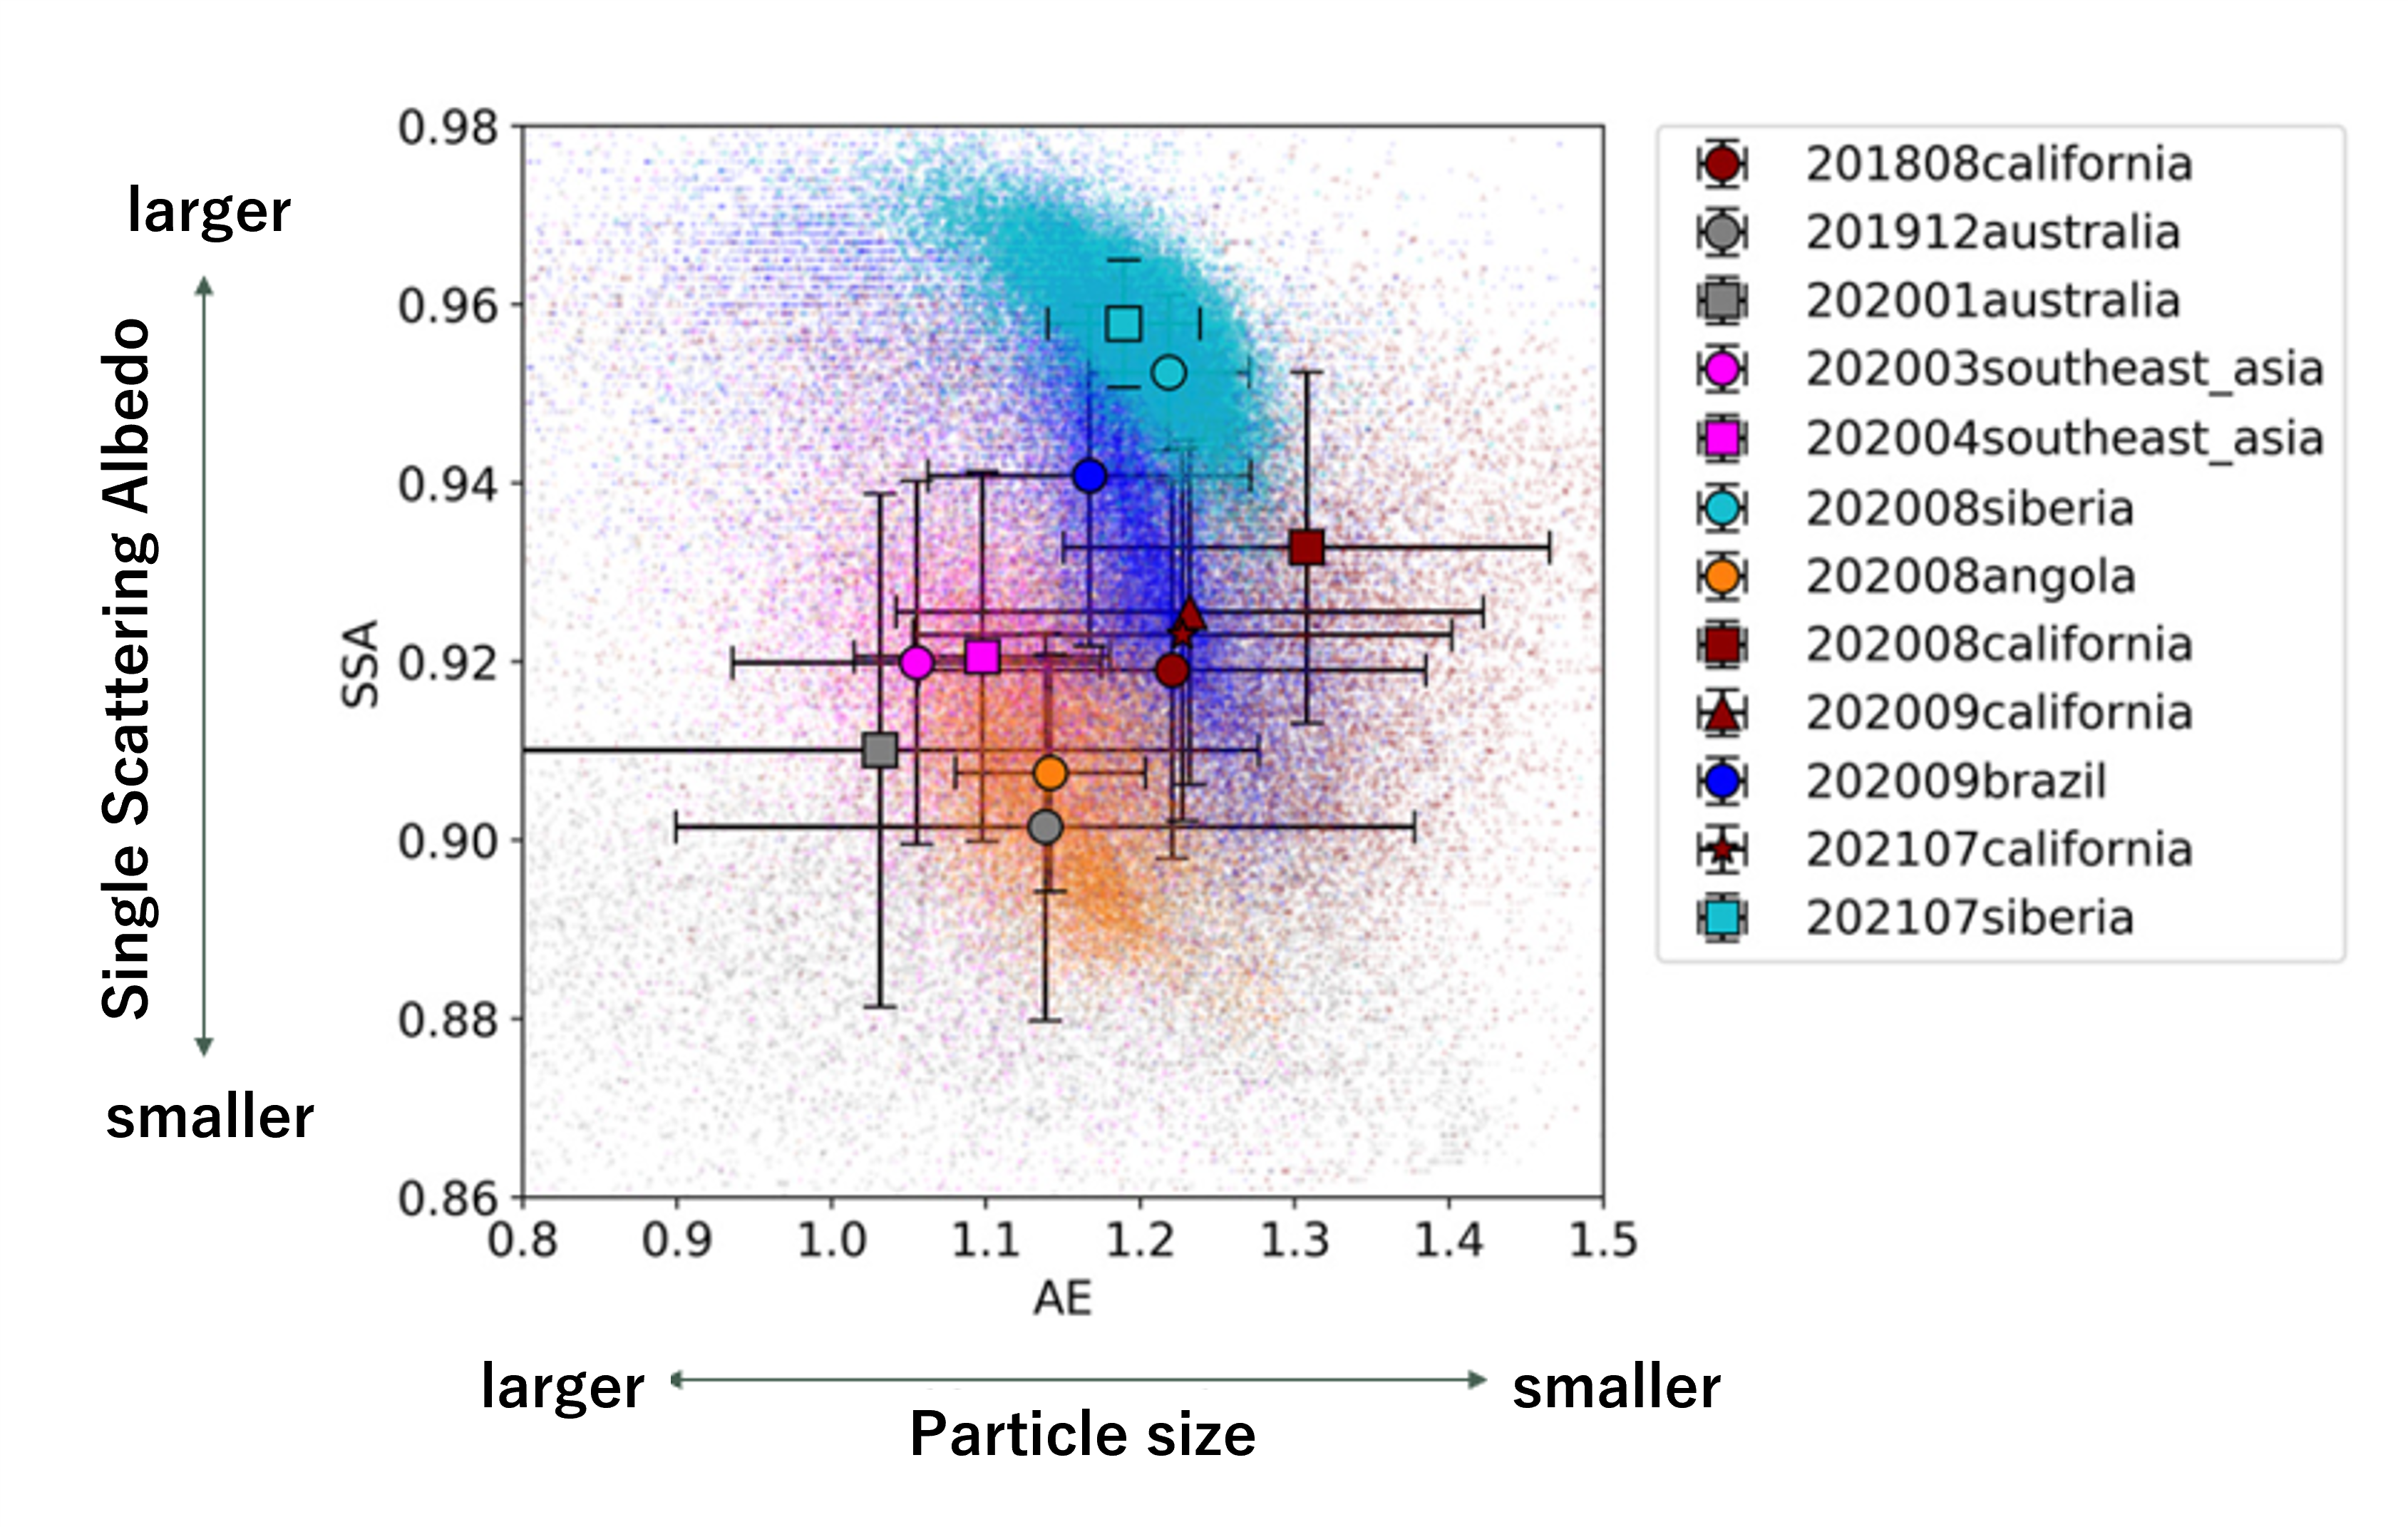
In this study, we first analyzed aerosol optical properties (*3) associated with extreme global wildfires since 2018 by using GCOM-C data. Figure 1 shows the average monthly carbon emissions from wildfires. Six regions of the world (Brazil, Angola, Australia, California, Siberia, and Southeast Asia) with particularly high carbon emissions (i.e., frequent fires) were selected for this study. As for GCOM-C, aerosol optical properties can be determined by using multi-wavelength observations, including the near-ultraviolet band (0.38 µm). Figure 2 shows the differences in the characteristics of the fire aerosols in each region by plotting the Single Scattering Albedo (SSA), which indicates the percentage of light scattered, and the Ångström Exponent (AE), which indicates the aerosol particle size, on a scatter plot. The analysis was also performed with information on relative humidity and land cover in each region. As a result, we found that particle size and SSA increased with increasing relative humidity, and that the relationship may change depending on the type of vegetation burned (i.e., the origin of the aerosol).
(*3) aerosol optical properties
Light is dissipated (scattered or absorbed) in the presence of aerosols. The indicator that expresses how much light is attenuated as a result of this dissipation is called aerosol optical thickness. The indicator of the wavelength dependence of this optical thickness is called AE (Ångström Exponent), and in general, the smaller the AE, the larger the particle size. The Single Scattering Albedo (SSA) is the ratio of scattering to dissipation (scattering + absorption). For example, black carbon (soot) is considered to have a low SSA because it absorbs light well. These indicators related to light dissipation are called aerosol optical properties.
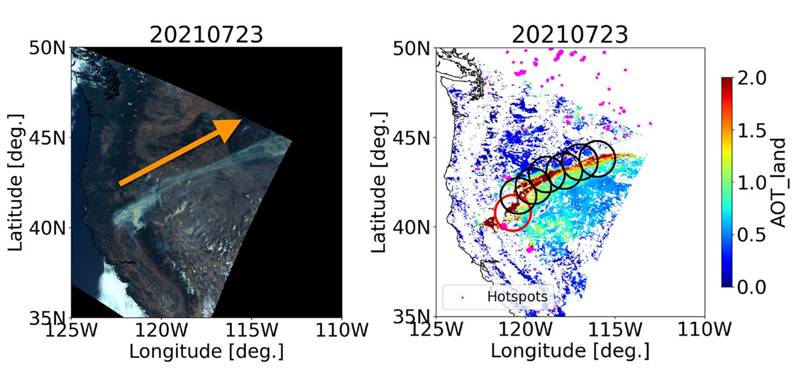
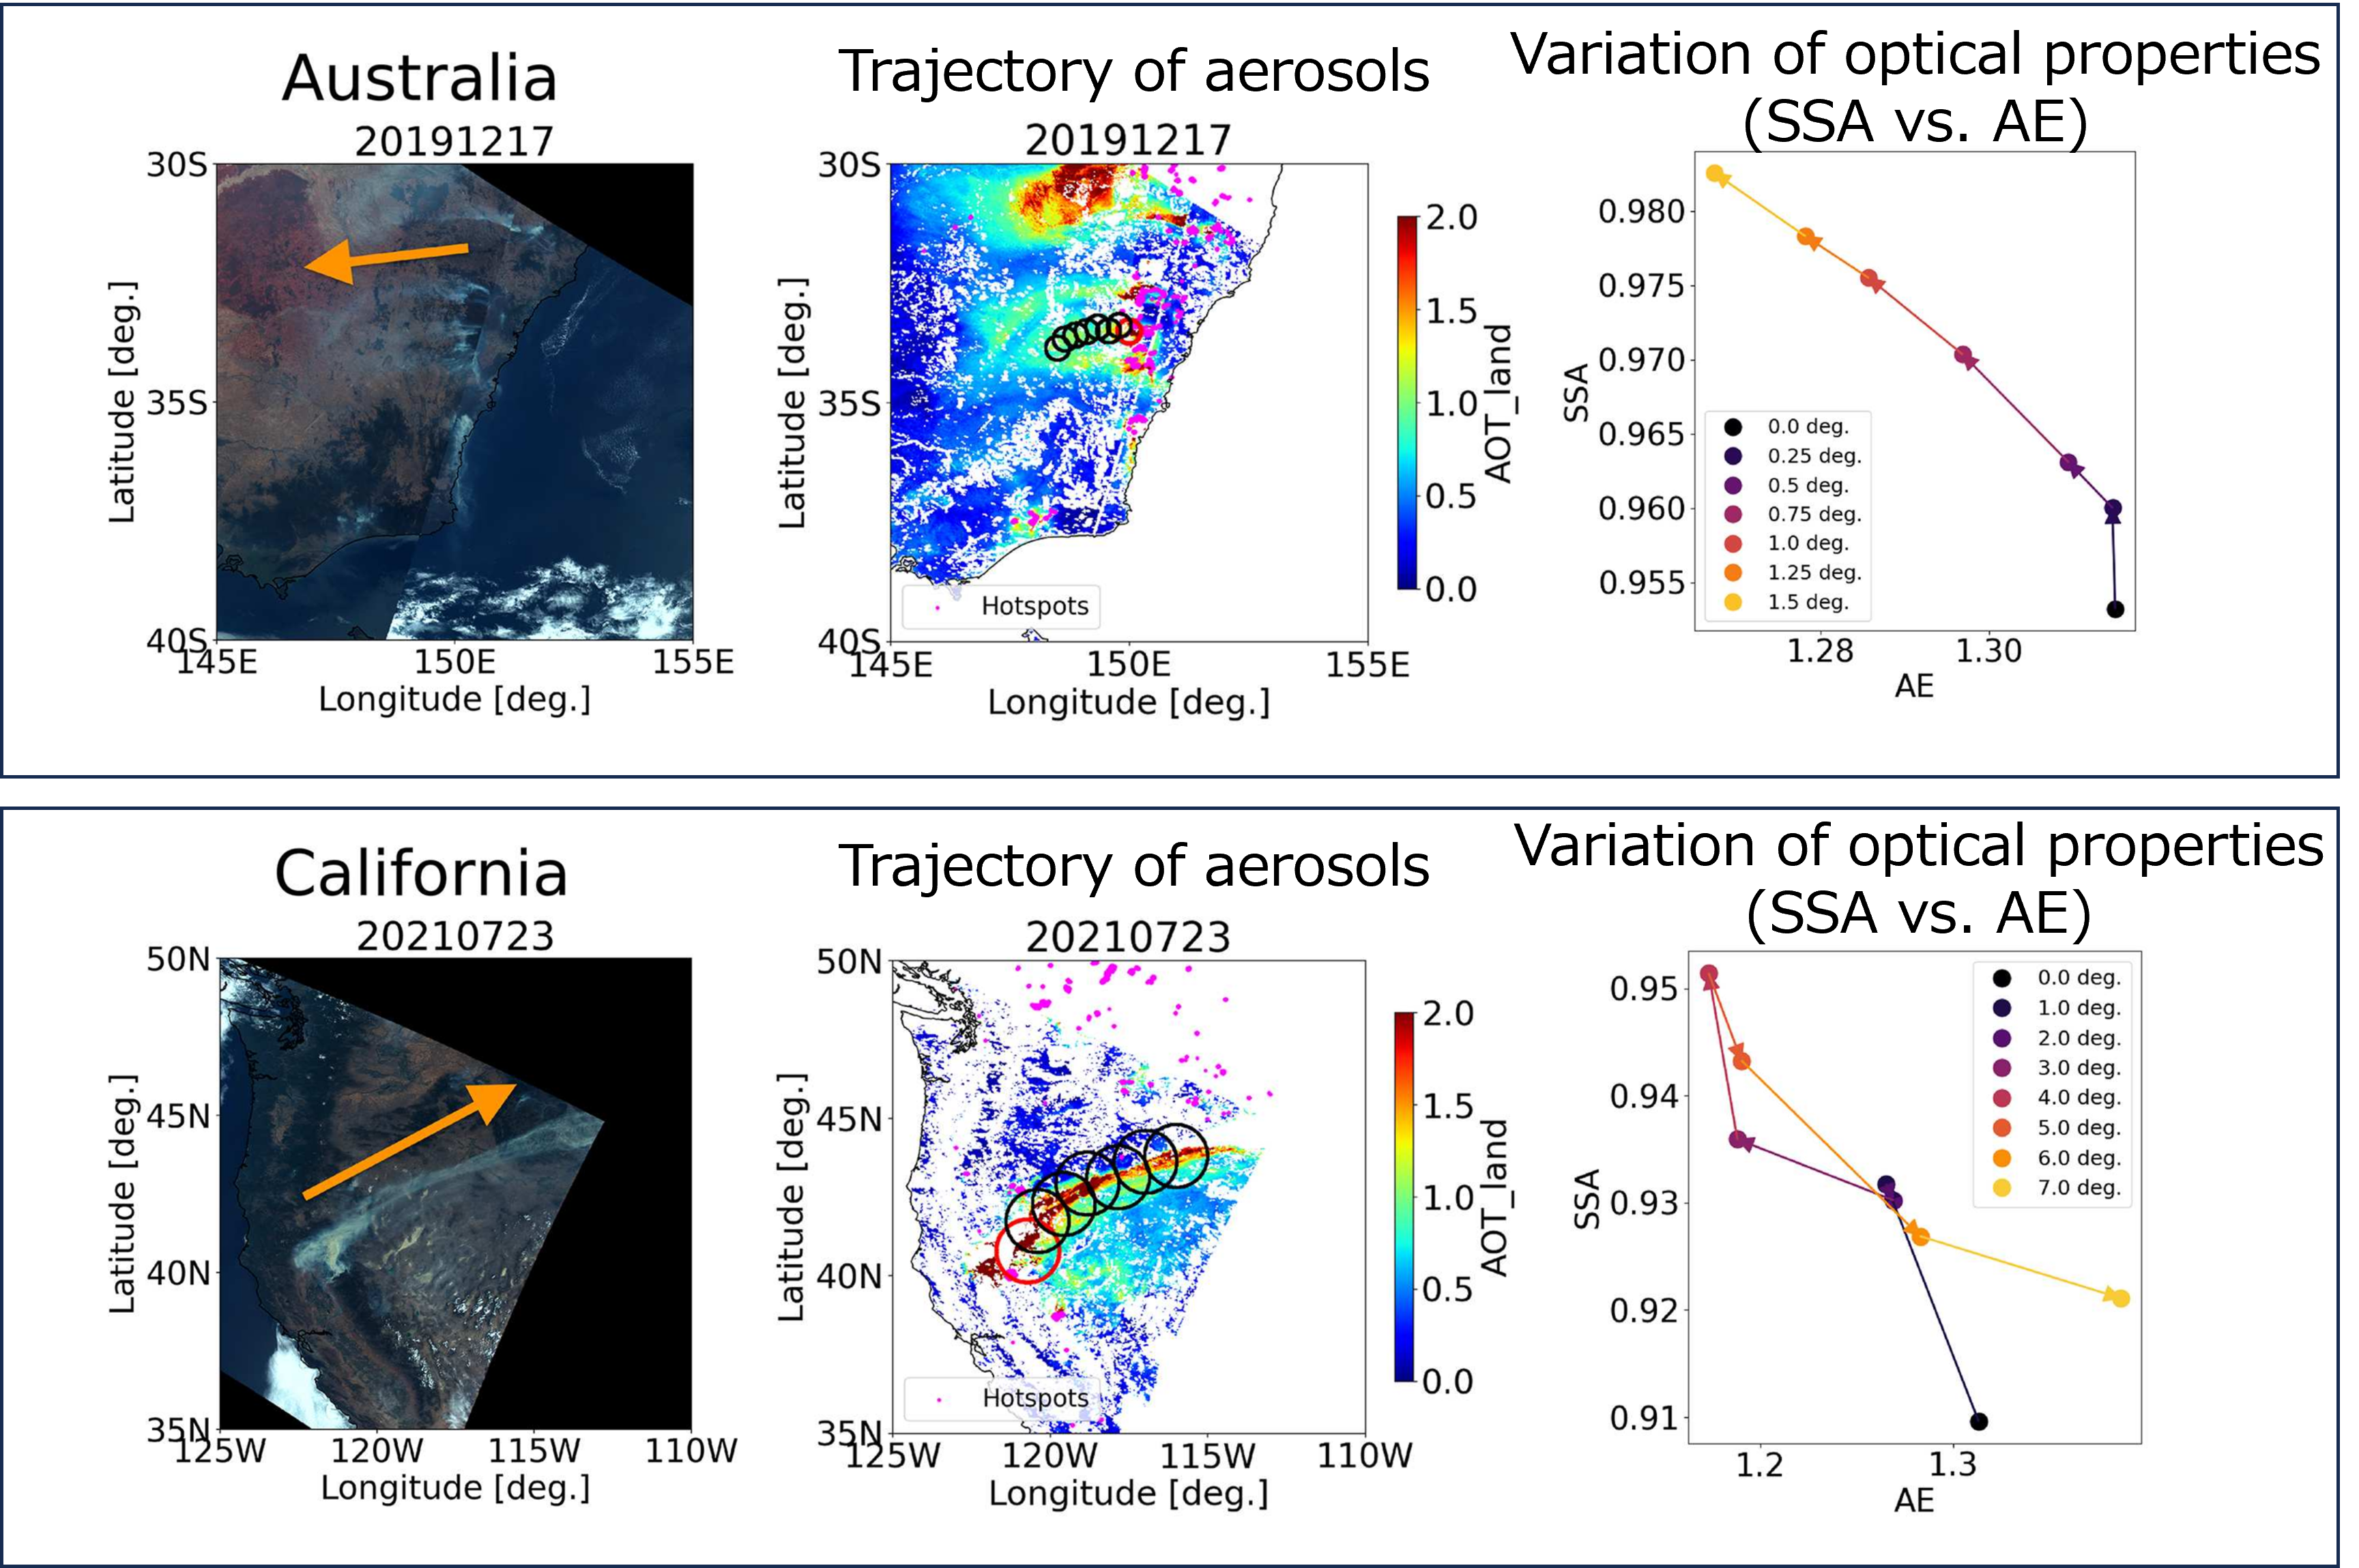
(2) Aerosol time variation
Next, we investigated how optical properties change over time by tracking the movement of each individual fire aerosol. Figure 3 shows a GCOM-C image of the fires on the east coast of Australia and in California (from left to right: visible image, aerosol optical thickness, and change in optical properties (SSA and AE)). In the visible image, we can see that the smoke generated by the fire flows in the direction of the arrow. The aerosol dense region (=migration path) can be traced by examining the aerosol optical thickness along these arrows. By analyzing the aerosol optical properties along this migration trajectory, we were able to capture the moment when the optical properties (SSA and AE) change as the aerosol is carried away from the point of origin (i.e., over time). The main reason for the decrease in AE and increase in SSA over time is thought to be that the aerosol has changed its scattering characteristics to resemble water by absorbing ambient moisture and growing larger (hygroscopic growth). These results show that optical properties vary not only with regional differences such as relative humidity and land cover, but also with time, and thus have the potential to help improve the physical processes in models that are important for correctly estimating future climate impacts.
(3) Cooling effect of wildfire aerosols on the earth
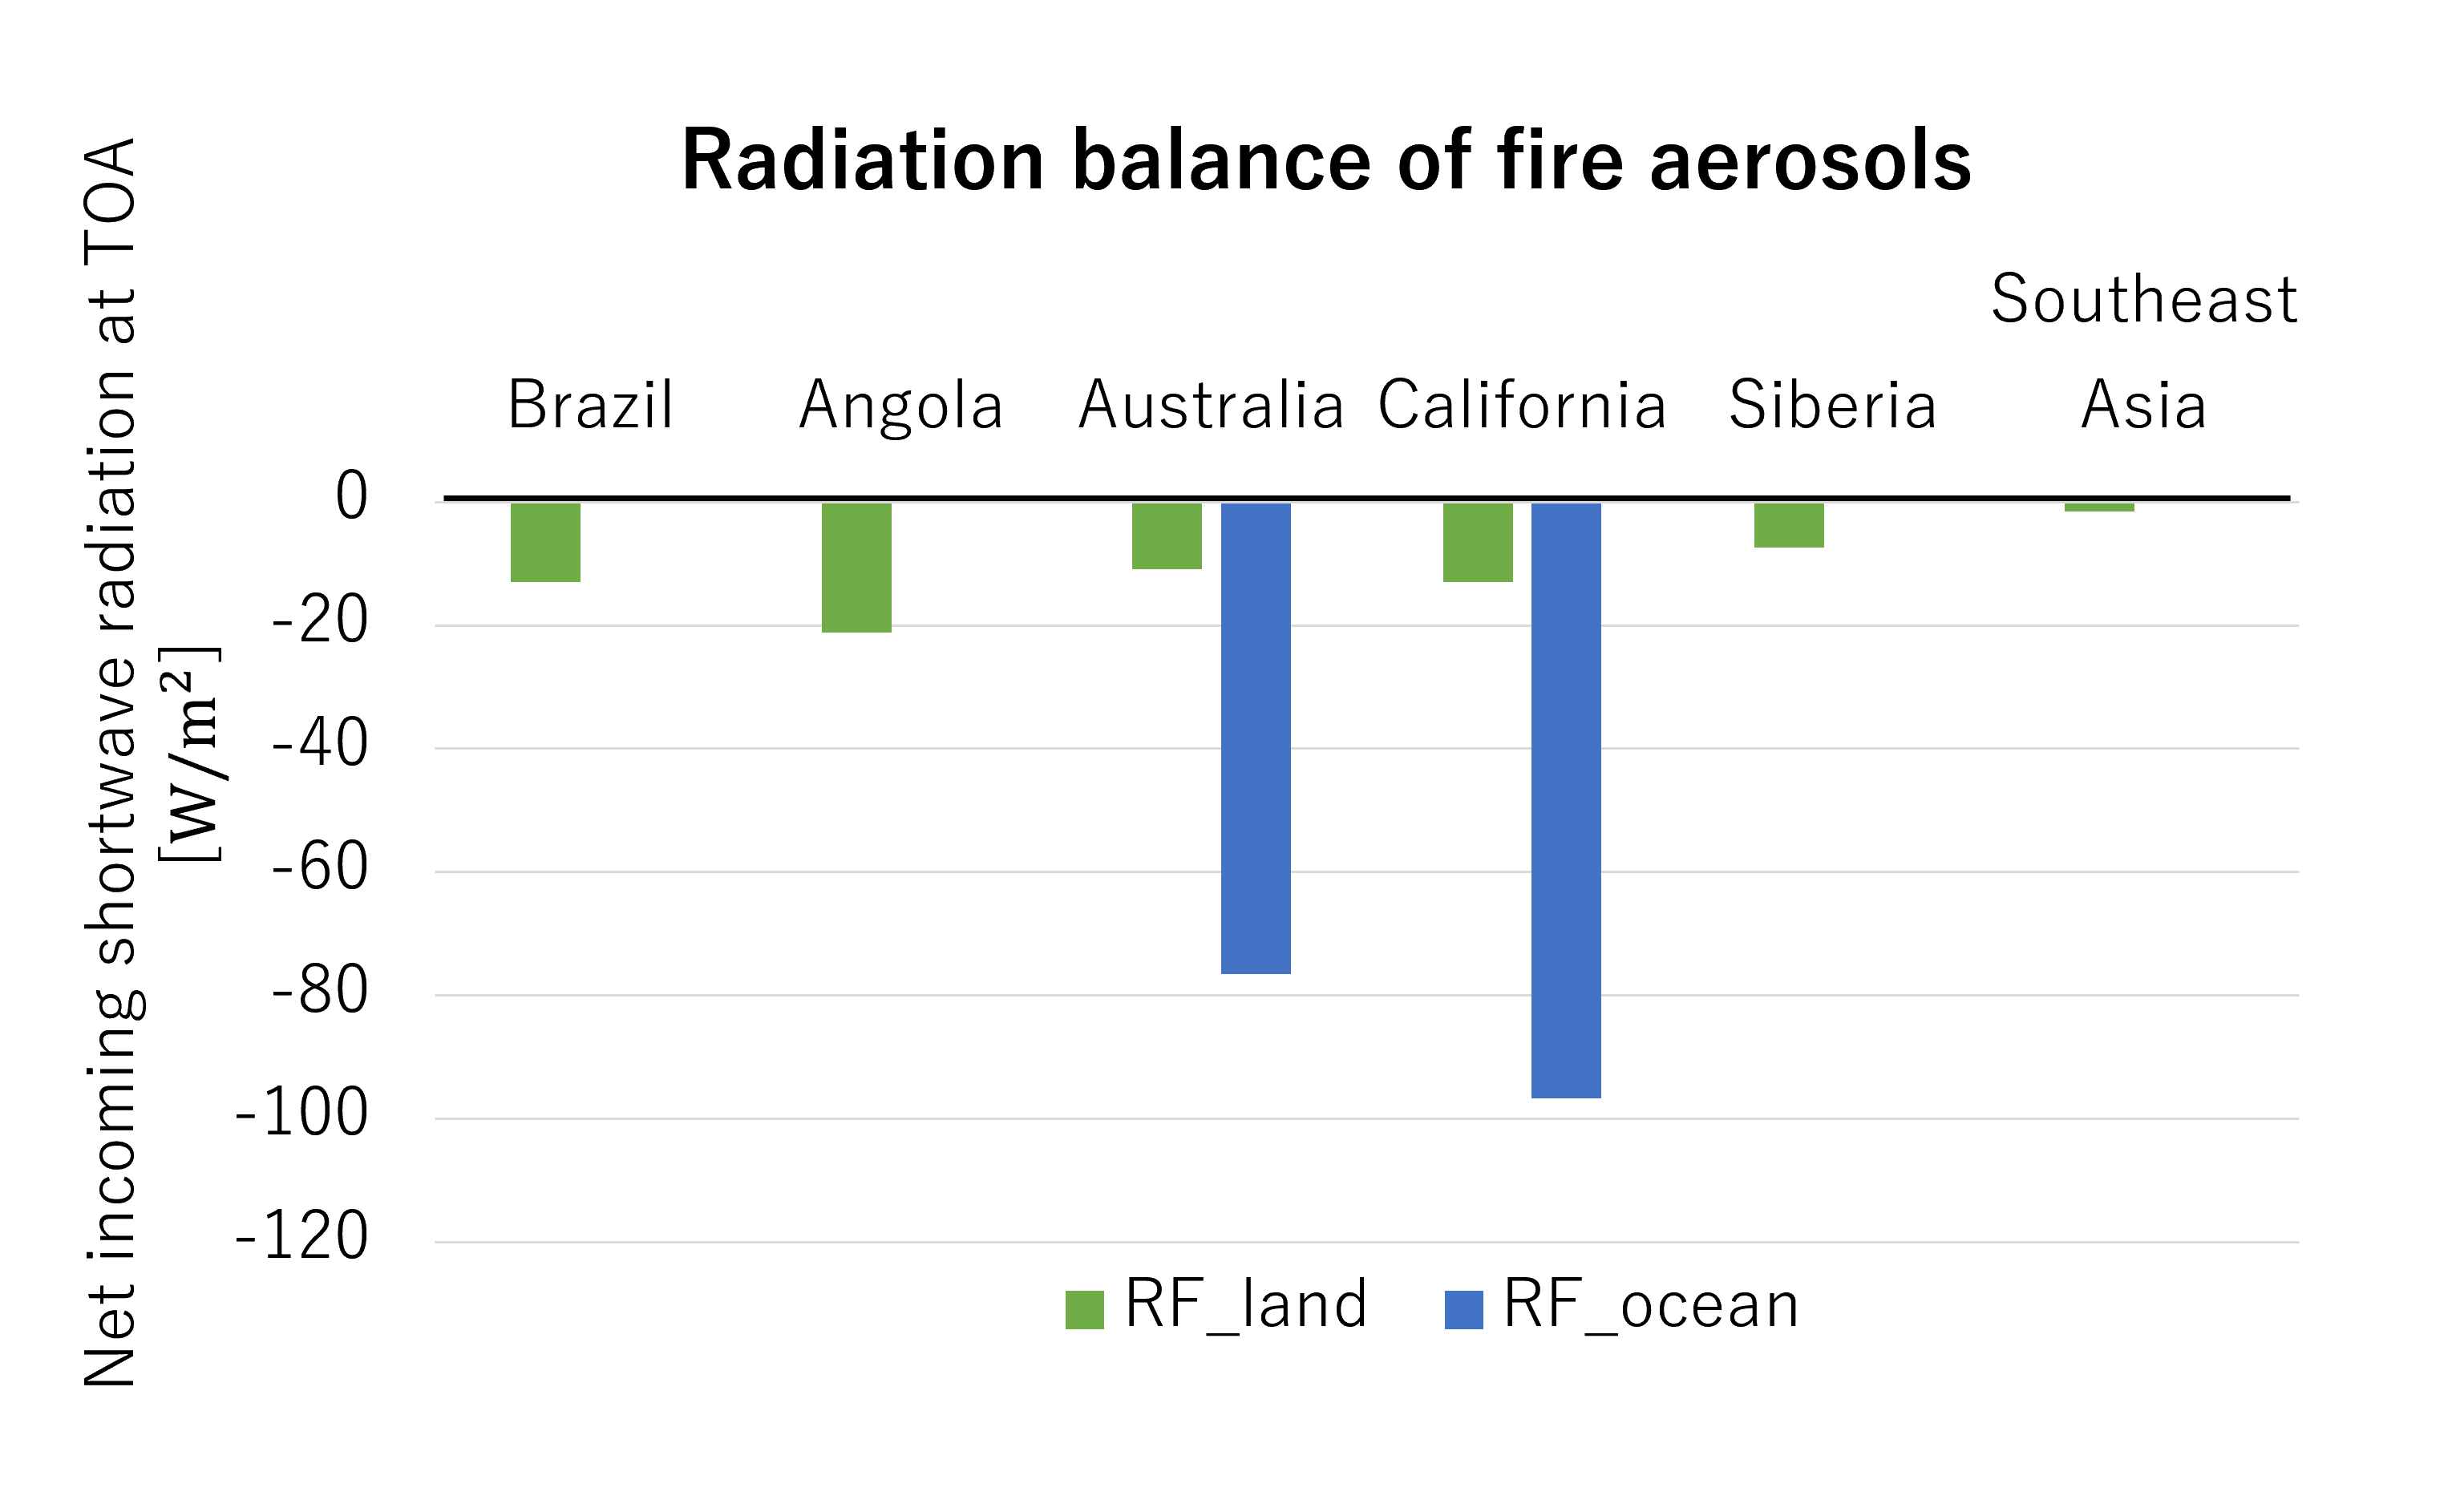
Typically, aerosols are thought to have an umbrella effect that blocks sunlight and has been shown to have a cooling effect on the Earth. However, if the aerosol contains a large amount of black carbon, such as soot, it may have a heating effect on the Earth due to its tendency to absorb sunlight (small SSA). In this study, we calculated how the direct effect of wildfire aerosols (*4) in each region affects the solar input/output balance. Specifically, we obtained the energy balance by taking the difference in short-wave radiation energy at the top of the atmosphere observed by satellite when aerosols were present (averaged over 10 days when fires were particularly intense) and when they were absent (averaged over 10 days when no fires occurred). As a result, it was found that aerosols had a cooling effect on either fires, especially aerosols at sea, which were 7-9 times more effective than those on land (Figure 4). This result indicates that when estimating the climatic impact of aerosols, it is important to consider not only the aerosol-specific optical properties, but also the surface on which the aerosol is located.
(*4) direct effect of aerosol
Aerosols have direct effects, where the aerosol itself scatters and absorbs solar radiation, and indirect effects, where the aerosol acts as condensation nuclei in water clouds and ice nuclei in ice clouds, and indirectly affects the radiation energy budget by changing cloud reflectivity and lifetime. This study deals with the radiative energy balance due to direct effects.
(4) Findings of this study
By taking advantage of GCOM-C’s strengths in wide-area, high-frequency, and diverse geophysical observations, we investigated the climatic effects of aerosols associated with large-scale wildfires in six regions of the world. There are three main suggestions obtained as a result of the investigation.
- Depending on local humidity and vegetation, the optical properties of fire aerosols vary.
- Optical properties also vary over time due to hygroscopic growth, etc.
- Fire aerosols in the six regions covered in this study have a cooling effect on the Earth.
In this study, we systematically analyzed not only individual fires, but also large-scale fires around the world to show observational evidence of their optical properties and cooling effects.This study is important for understanding how wildfires and climate affect each other, and is expected to help improve the accuracy of future climate change predictions. These results also leads to the development of climate prediction models in the “MEXT-Program for The Advanced Studies of Climate Change Projection (SENTAN)”, which is promoted by JAXA in cooperation with the Ministry of Education, Culture, Sports, Science and Technology (MEXT). We look forward to further results in the future.
Search by Year
Search by Categories


Tags
-
#Earthquake
-
#Land
-
#Satellite Data
-
#Aerosol
-
#Public Health
-
#GCOM-C
-
#Sea
-
#Atmosphere
-
#Ice
-
#Today's Earth
-
#Flood
-
#Water Cycle
-
#AW3D
-
#G-Portal
-
#EarthCARE
-
#Volcano
-
#Agriculture
-
#Himawari
-
#GHG
-
#GPM
-
#GOSAT
-
#Simulation
-
#GCOM-W
-
#Drought
-
#Fire
-
#Forest
-
#Cooperation
-
#Precipitation
-
#Typhoon
-
#DPR
-
#NEXRA
-
#ALOS
-
#GSMaP
-
#Climate Change
-
#Carbon Cycle
-
#API
-
#Humanities Sociology
-
#AMSR
-
#Land Use Land Cover
-
#Environmental issues
-
#Quick Report
-
#GOSAT-GW
Related Resources


Related Tags
Research and Development Related Articles
-
 Research and Development 2026.03.09 Mon High-Resolution Predictions of Global Terrestrial Water Cycle:
Today’s Earth – Global Updated -
 Research and Development 2025.06.18 Wed Advancing Space-Based Weather Analysis and Forecasting – Renewal of JAXA’s Realtime Weather Watch ‘NEXRA3’ and Performance Evaluation with the previous system (Overview Article)
 -
 Research and Development 2025.03.27 Thu Launch of Ocean Weather Forecasts 1km resolution
 -
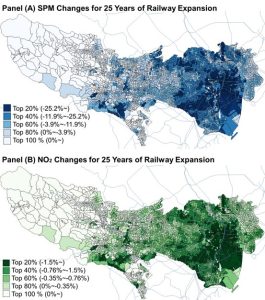 Research and Development 2024.05.27 Mon The Use of Earth Observation Satellite Data in the Humanities and Social Sciences (3)
Stay Connected
