


Disaster
2022.10.21 Fri
Typhoon Hinnamnor took a complicated track to hit the Nansei Islands
: Features observed in satellite observations and real-time weather simulations
Every year, typhoon originates in the southern seas of Japan, then approaches and makes a landfall in Japan from summer to autumn. In recent years, along with the increase in global warming, the strong winds and rainfall associated with typhoons are predicted to become more severe. From the perspective of disaster prevention, there is a growing social need for more accurate prediction of the path and intensity of typhoons at an early stage.
The year 2022 remains no exception, with multiple typhoons approaching and landing in Japan. Recently, typhoons No. 11, No. 12, No. 14, and No. 15 have approached and landed in Japan in succession, each causing damage. We wish to extend our deepest sympathy to all those who have suffered hardship from the disasters.
From the perspective of providing information on typhoon condition, this article introduces the analysis results of Typhoon No. 11 approaching the Nansei Islands late in August 2022. The analysis was based on a combination of JAXA’s satellite observation data and information from the system NEXRA, a real-time weather forecast. Please refer to our twitter for satellite observation results etc. (precipitation, ocean) about Typhoon No. 14.
The track and the intensity of “Hinnamnor”, Typhoon No. 11
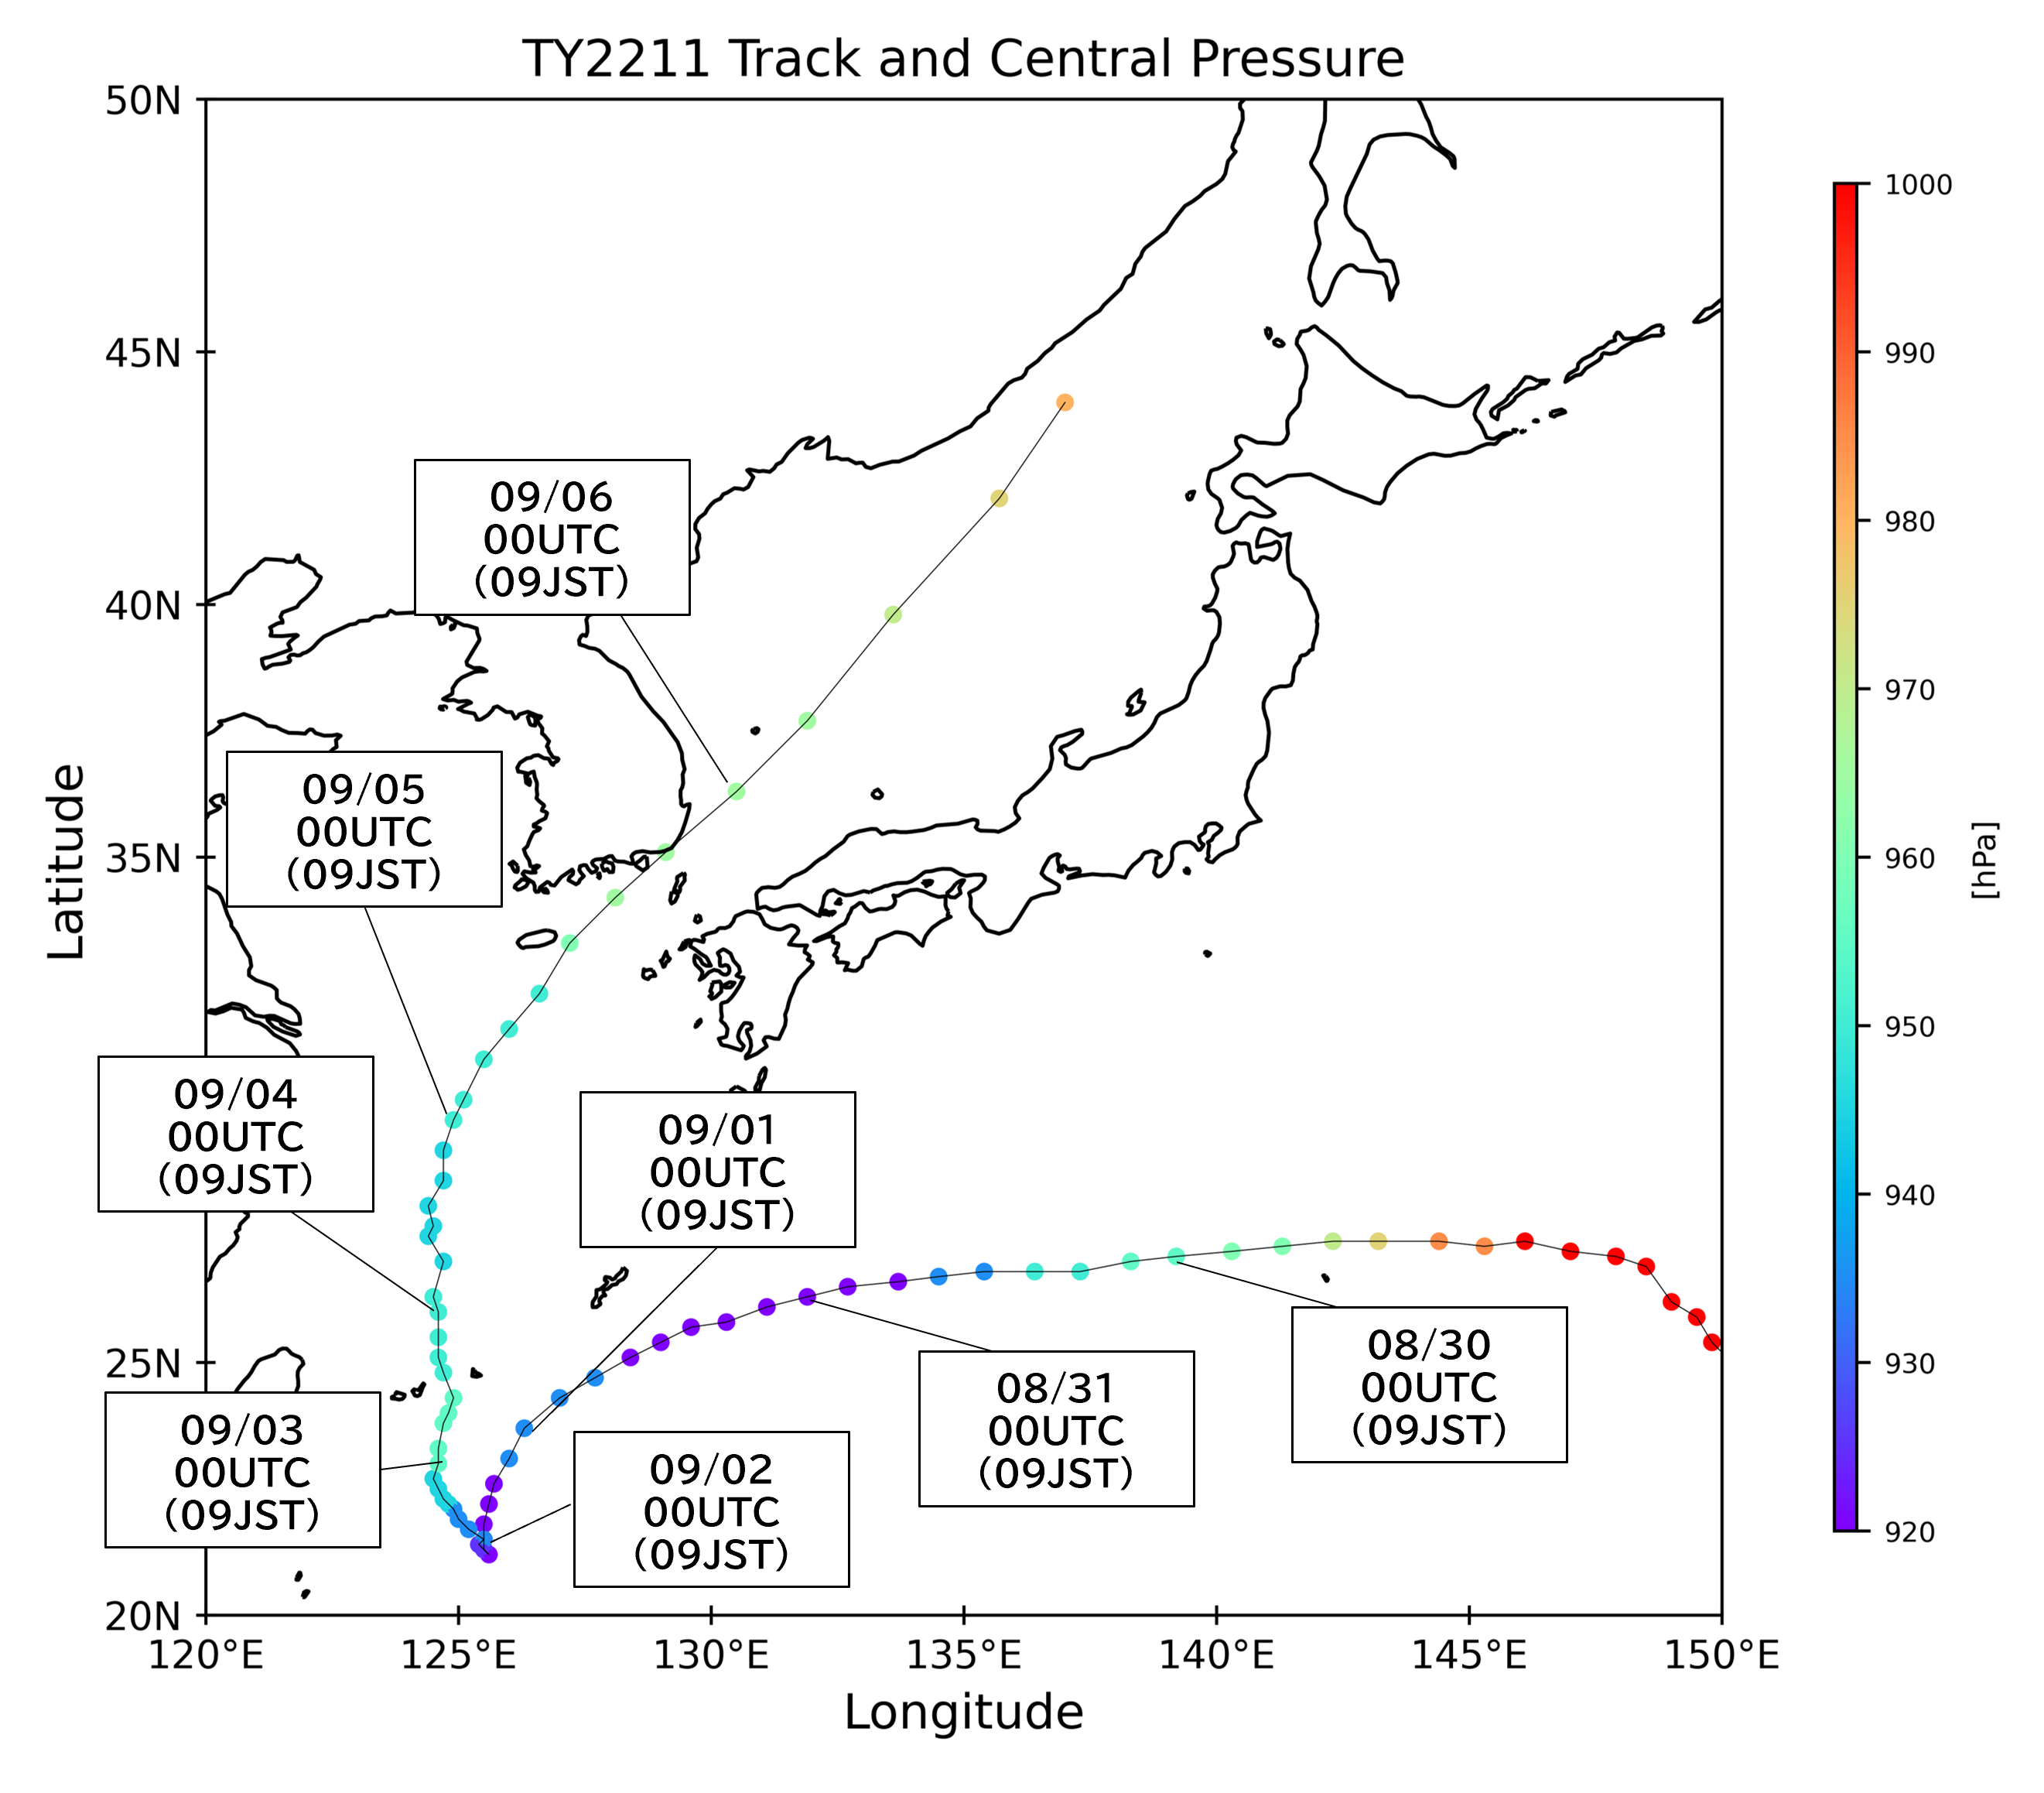
Typhoon No. 11 formed over Japan’s southern sea east of the Ogasawara Islands (25.9°N, 149.5°E) at 15:00 on August 28, 2022 (hereafter all times are JST), and was named “Hinnamnor”. Figure 1 shows the track of Typhoon Hinnamnor. After forming, Hinnamnor moved west with strengthening its power and remained south of Okinawa, bringing storm disasters to the Sakishima Islands. The typhoon remained ferocious between 21:00 on the 30th and 20:00 on the 31st and between 09:00 on September 1 and midnight on September 2, while it was stagnant over the southern ocean of Okinawa Island. During this period, it is remarkable that the typhoon weakened once from “volatile” to “very strong”. After that, it moved northward over the East China Sea, made landfall over southern South Korea, and passed over the Sea of Japan. The typhoon finally became tropical depression.
Observation of clouds associated with Typhoon Hinnamnor
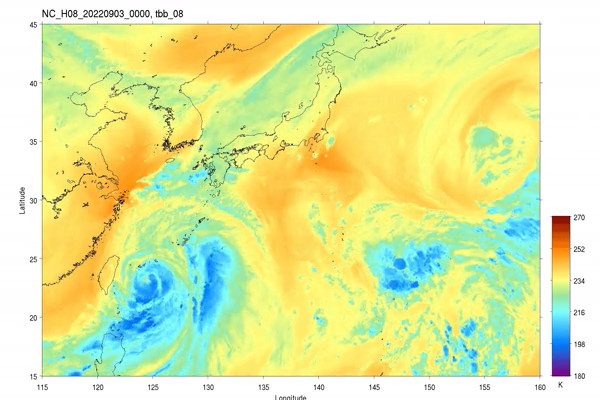
We can see an overview of the typhoon’s cloud movement in visible and thermal infrared images from the JMA’s Himawari-8 and the Global Change Observation Mission – Climate “SHIKISAI” (GCOM-C). Figure 2, the thermal infrared moving image by Himawari-8, shows that the clouds (indicated in blue) around August 28 gathered around 25˚N, 150˚E, and became accompanied by an eye at the center on August 29, rotating counterclockwise and moving westward with the surrounding atmospheric wind. We can see that the typhoon stagnated south of Okinawa, then extended its cloud coverage northward after September 3, and it entered the Sea of Japan on September 6, showing a rapid collapse of the cloud structures. Not only the images, but also JAXA estimates physical quantities such as cloud thickness and temperature associated with typhoons using the satellite data. (https://www.eorc.jaxa.jp/JASMES/SGLI_STD/daily.html, https://www.eorc.jaxa.jp/ptree/).
Horizontal distribution of precipitation associated with Typhoon Hinnamnor and changes in three-dimensional structure captured by Global Precipitation Measurement (GPM)
JAXA has been developed and released the Global Satellite Mapping of Precipitation (GSMaP), which offers hourly global precipitation distribution data. GSMaP has multi-satellite map by using the Global Precipitation Measurement (GPM) core observatory, the Global Change Observation Mission – Water “SHIZUKU” (GCOM-W), etc. Figure 3 shows GSMaP temporal variation of the precipitation distribution associated with Typhoon Hinnamnor, with the hourly precipitation at the top and the accumulated precipitation at the bottom. Along the track in Figure 1, the typhoon is captured as it moves with changing intensity, bringing rainfalls over a wide area along its track.
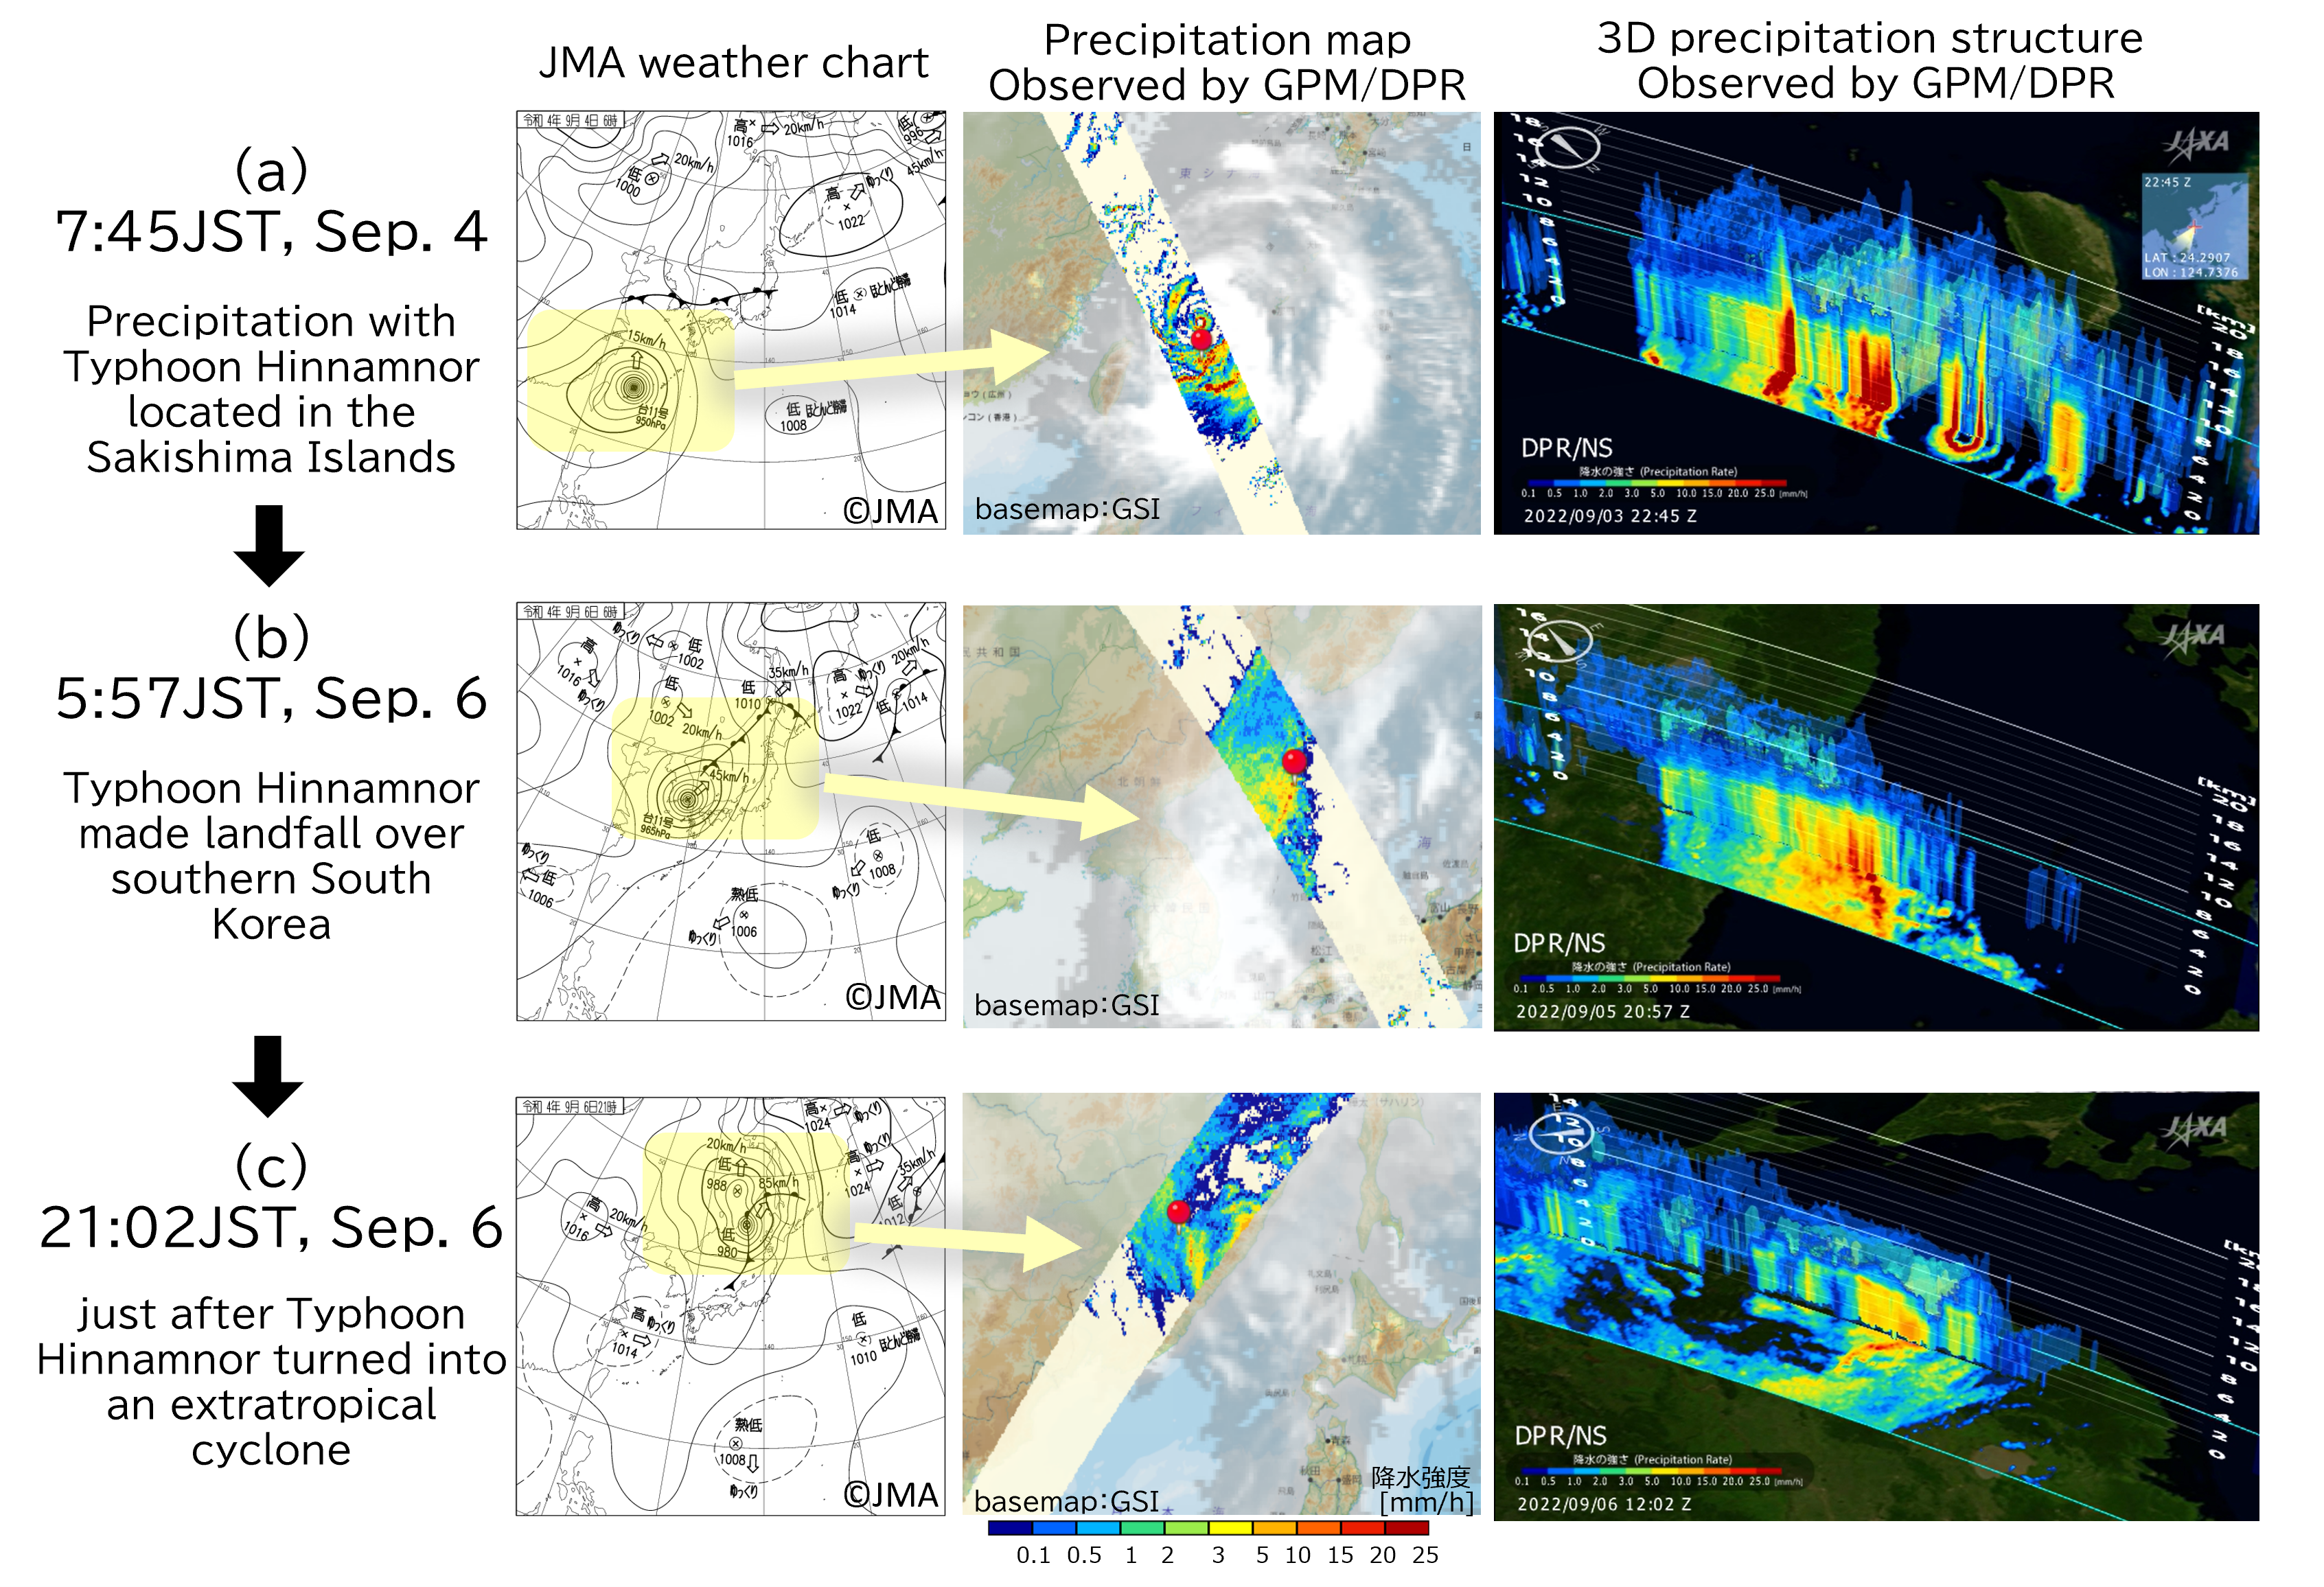
The GPM core observatory, which is also used for the GSMaP data shown in Figure 3, is equipped with the Dual-frequency Precipitation Radar (DPR), a sensor jointly developed by JAXA and National Institute of Information and Communications Technology (NICT). DPR is capable of observing precipitation three dimensionally. Figure 4 shows three precipitation examples associated with the typhoon observed by GPM/DPR.
- Figure 4 (a) shows a GPM/DPR observation of Typhoon Hinnamnor located in the Sakishima Islands at around 07:45 on September 4. The horizontal distribution of precipitation shows the concentric structure unique to typhoons, and the three-dimensional structure clearly captures the eye of the typhoon.
- Figure 4 (b) shows that the GPM/DPR observed a precipitation area north of the center of Typhoon Hinnamnor when it made landfall over southern South Korea at around 05:57 on September 6. The autumn rain front, which was over the Tohoku region to the west in Figure 4 (a), changed its shape and position in Figure 4 (b), and extended northeastward over the Sea of Japan from the vicinity of the typhoon in southern South Korea, and rainfall along the front was observed by the GPM/DPR. Comparing the three-dimensional structures, the area near the center of the typhoon in Figure 4 (a) shows convective precipitation with developed precipitation reaching high altitudes in some places, while the precipitation zone associated with the front around the typhoon in Figure 4 (b) shows strong precipitation on the ground, although the peak of precipitation is not as high as that in the area near the center.
- Figure 4 (c) shows an example of a GPM/DPR observation of a precipitation area northwest of the center of a low pressure area just after Typhoon Hinnamnor turned into an extratropical cyclone around 21:02 on September 6. This case is observed at a higher latitude than Figure 4 (b), and the altitude of the precipitation top is about 5-6 km. Compared to Figures 4 (a) and 4 (b), a relatively weak precipitation area can be observed.
ALOS-2 wind speed estimation of Typhoon Hinnamnor
Typhoon wind speed at sea is essential information for estimating strength and track of a typhoon. However, previous observation methods have problems such as rough resolution in capturing the local wind speed distribution of typhoons and difficulty in estimating wind speeds in strong wind areas where wind speeds exceed 20 m. This has been a major challenge in typhoon disaster prevention.
Recent study has proved that Phased-Array L-band Synthetic Aperture Radar – 2 (PALSAR-2) onboard Advanced Land Observing Satellite-2 “DAICHI-2” (ALOS-2) is capable of capturing sea surface images with high resolution regardless of the weather conditions and observing ocean wind including high winds exceeding 50 m/s.
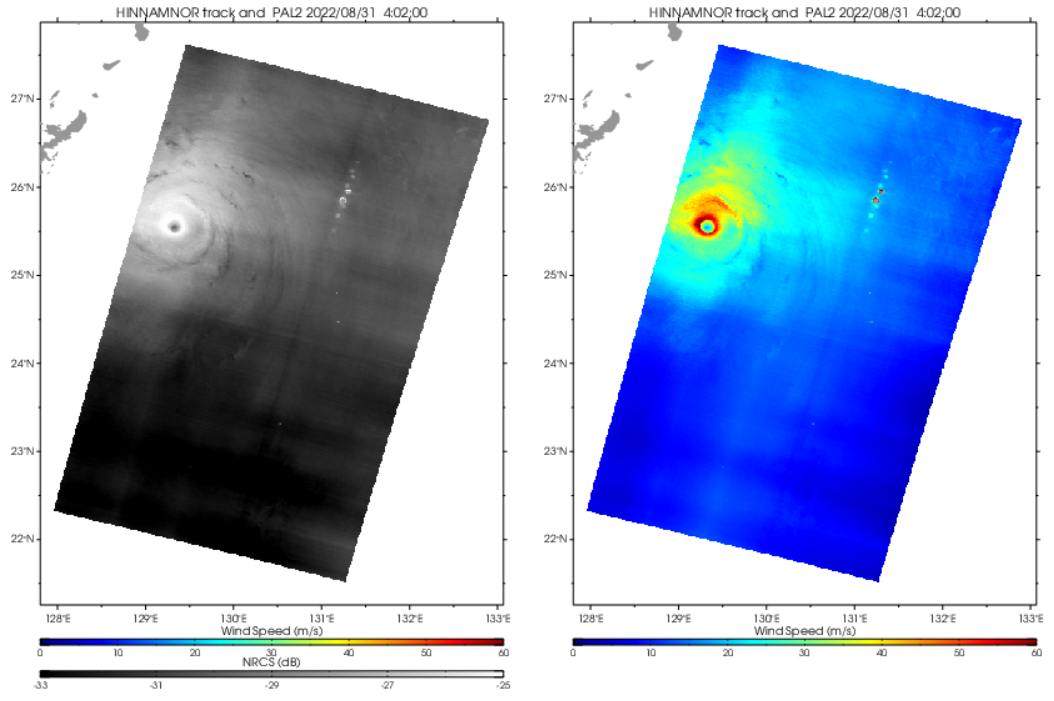
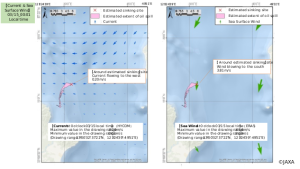
Figure 5 (left) shows ALOS-2 observation data at the ocean area near the center of the Typhoon Hinnamnor observed at 13:02 on August 31, 2022. The right figure shows ocean wind speed calculated from the left data. It captures the shape of the fine high-wind area around the eye of the typhoon. Studies are in progress to improve the accuracy of ocean wind speed estimation using ALOS-2 and to assimilate it into meteorological models. It is expected to contribute to disaster mitigation in the future by forecasting the track and intensity of typhoons and improving the accuracy of damage predictions.
Decrease in sea surface temperature during typhoon stagnation (Results of ocean satellite observation and simulation by GCOM-W)
As previously mentioned, Typhoon Hinnamnor weakened in intensity while stalled offshore south of Okinawa, then moved northward and affected South Korea and Japan. At this time of the year, seawater temperature around Okinawa was 30℃, 2℃ higher than normal, which provided a favorable environment for the typhoon to develop and maintain its strength. Meanwhile, sea water temperature has been decreased during the long period of stagnation south of Okinawa (Figure 6), which is considered to be related to the weakening of the typhoon near Okinawa. As Typhoon Hinnamnor stalled over the sea south of Okinawa and then moved northward, it again passed through an area of high sea water temperatures, likely maintaining the typhoon’s strength. While the Advanced Microwave Scanning Radiometer 2 (AMSR2) onboard the GCOM-W can penetrate clouds and observe the sea surface and land surface below them, estimation of sea surface temperature (SST) becomes difficult when rain is falling. Therefore, the AMSR2 cannot fully capture the SST decline caused by typhoon (see the article “Measuring the decline of sea surface temperature from satellite during typhoon passage”). Through the collaboration with RIKEN, JAXA is developing a system to combine satellite data with ocean simulations at high frequency. Since typhoons develop in response to heat and vapor supplied by the oceans, it is important to reproduce ocean conditions more accurately. Therefore, we are now beginning to work on the upgrading of real-time weather analysis systems that can reflect the impact of the oceans on typhoons.
The track prediction of Typhoon Hinnamnor by real-time weather system NEXRA
In addition to satellite observations mentioned above, JAXA also utilizes numerical simulations. One example is NEXRA, a real-time weather analysis system, which provides horizontal high-resolution (14 km mesh) weather information through the website (https://www.eorc.jaxa.jp/theme/NEXRA/index_e.htm). At the same time, for research purposes, JAXA has conducted five-member ensemble forecasting experiments (experiments with slightly different initial values) with an initial value of 9:00 every day. This section introduces the behavior of Typhoon Hinnamnor as observed in NEXRA’s high-resolution analysis data and ensemble forecast experiments.
Figure 7 shows the distribution of weather fields (sea level corrective pressure, wind direction, wind speed) and water vapor volume around Japan and around typhoons from August 27 to September 3, obtained from NEXRA’s high-resolution analysis data. The figures show integrated water vapor (vertically integrated water vapor), wind field at 10 m altitude (arrows), and sea-level corrected pressure (isograms). The presence of the typhoon (surrounded by a sea-level pressure of 1000 hPa) can be seen as an area of relatively high water vapor content (yellow area), and the initial stage of the typhoon (August 27 to 30) shows that the typhoon remained relatively small and moved westward. The typhoon stalled over the sea south of Okinawa from August 30 to September 3, expanding its area with high water vapor content. It started to move northward on September 3, bringing storm disasters to the Okinawa region. During the period from August 30 to September 2 when the typhoon was stalled over the sea south of Okinawa, the pressure information shown by the pink contours indicates that the Pacific High was strongly overhanging Japan, which likely contributed to the typhoon’s stalling.
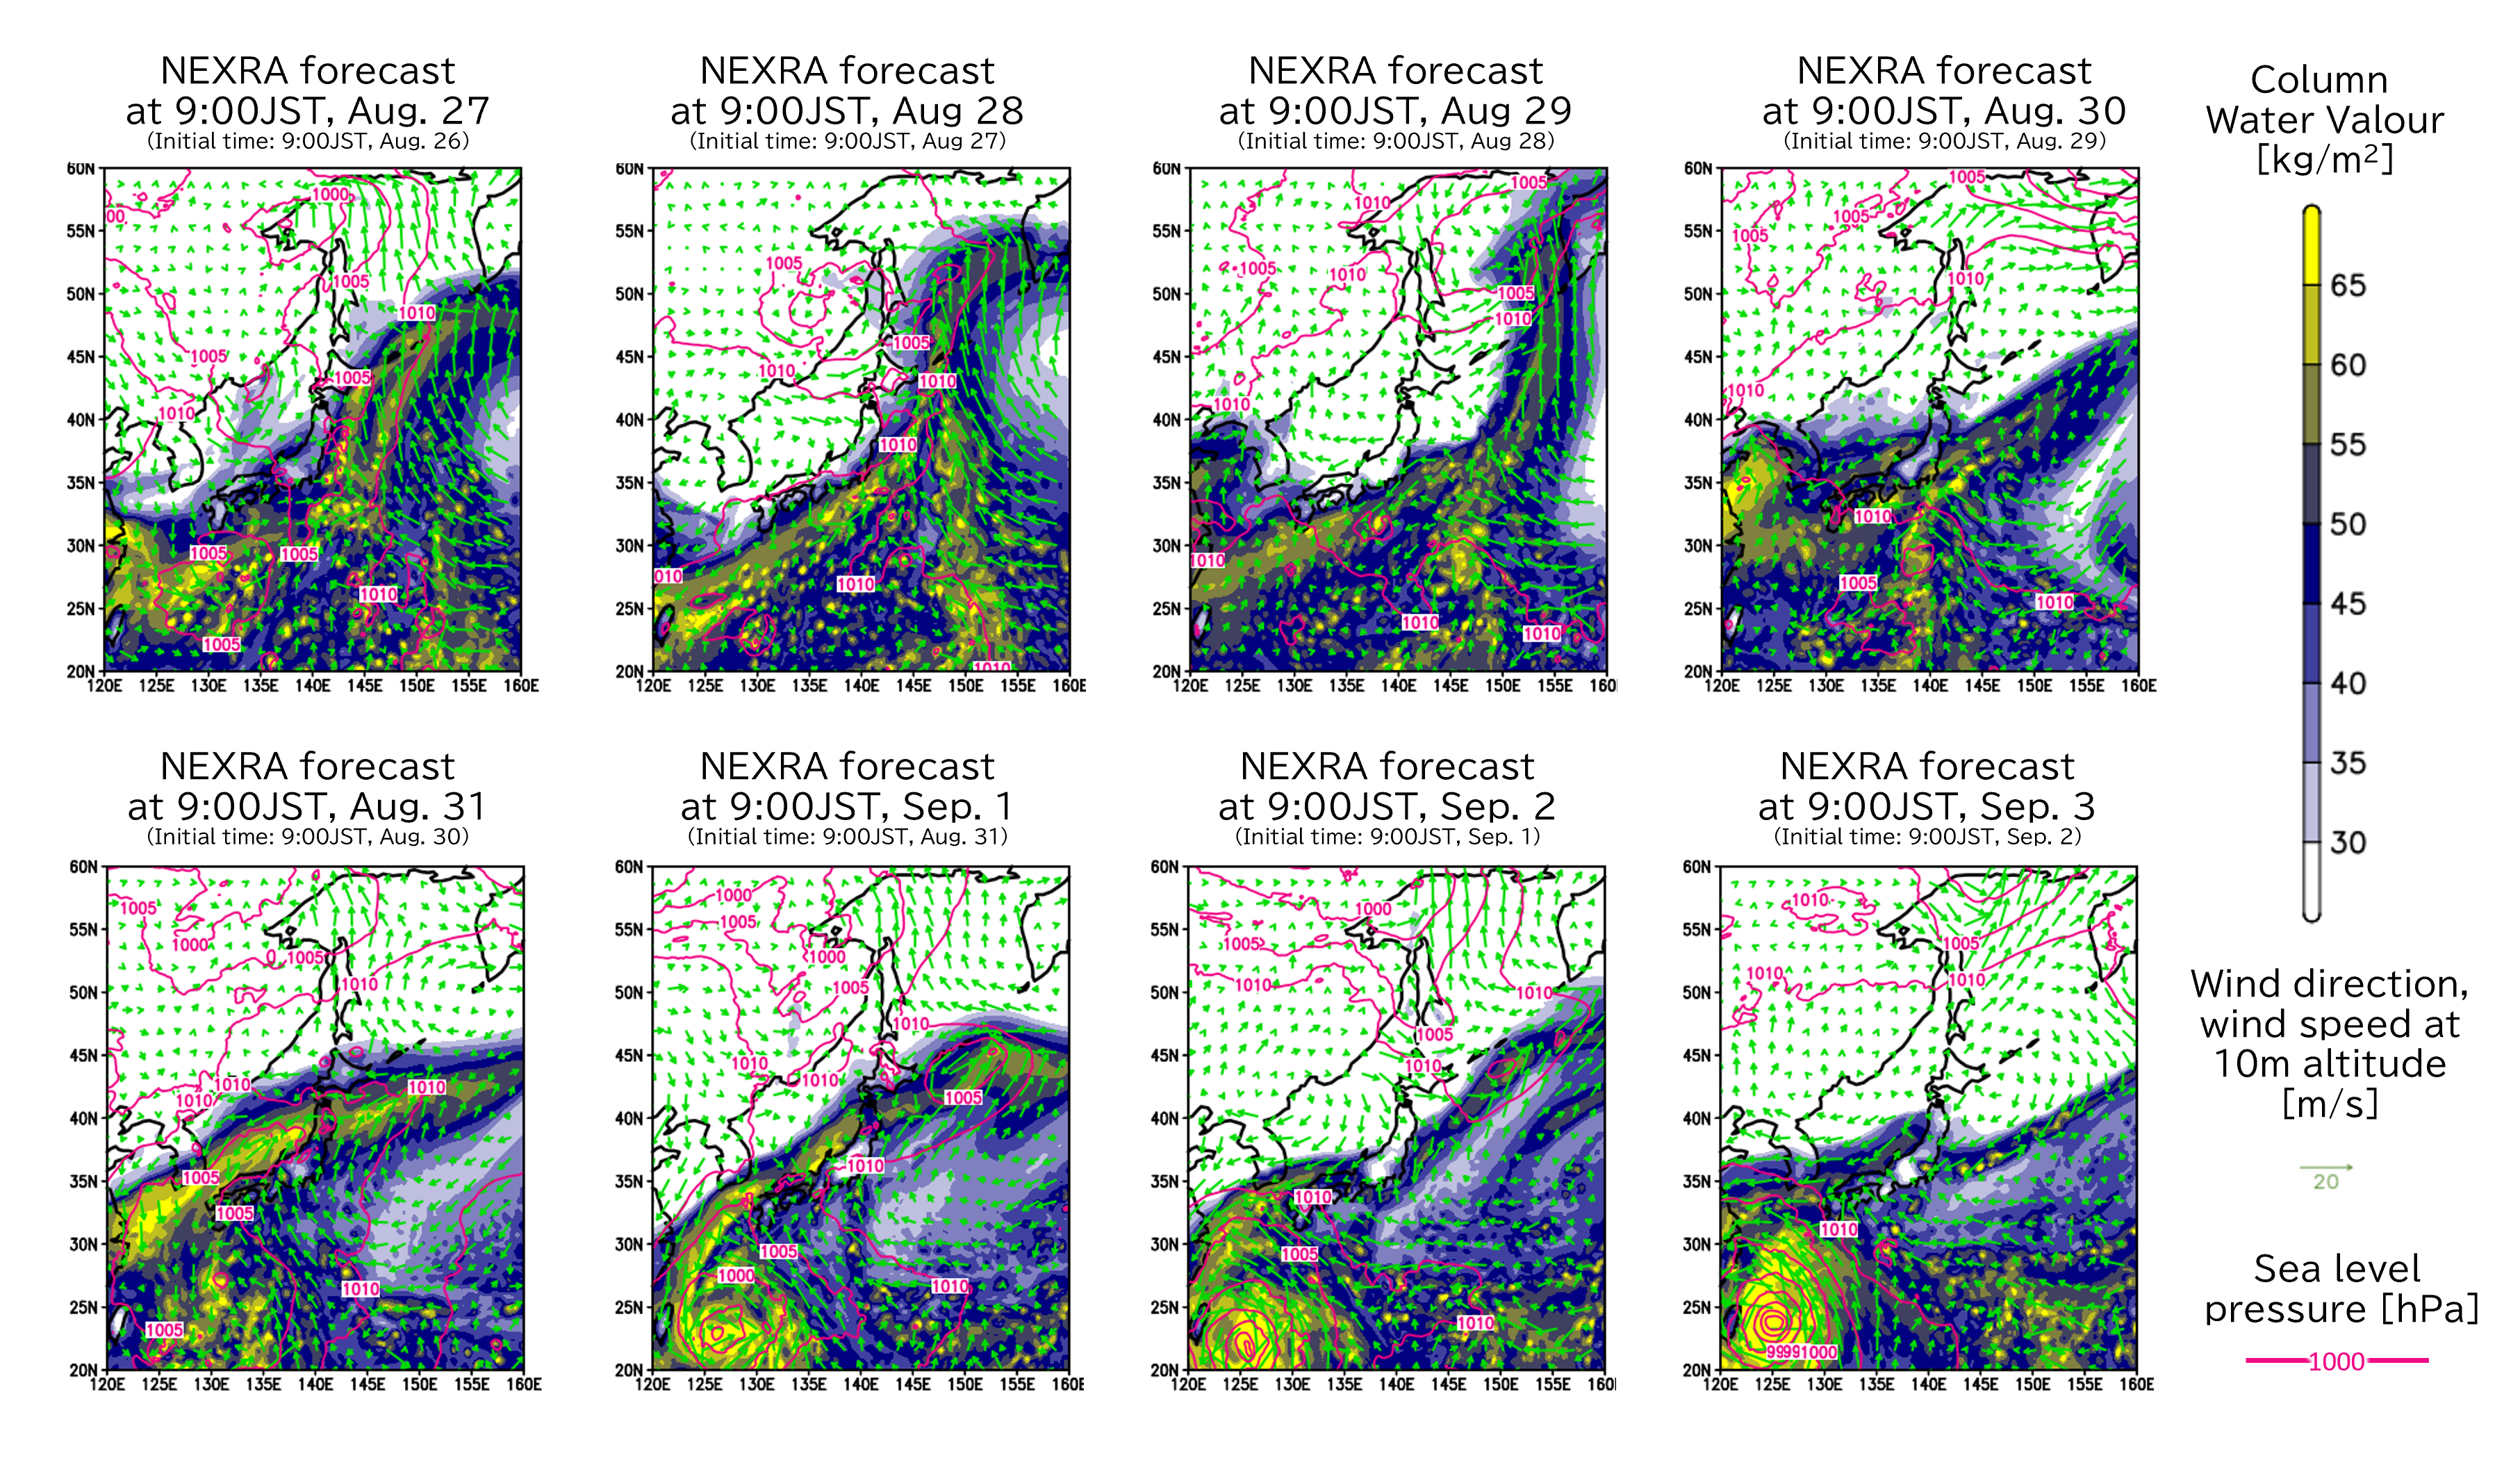
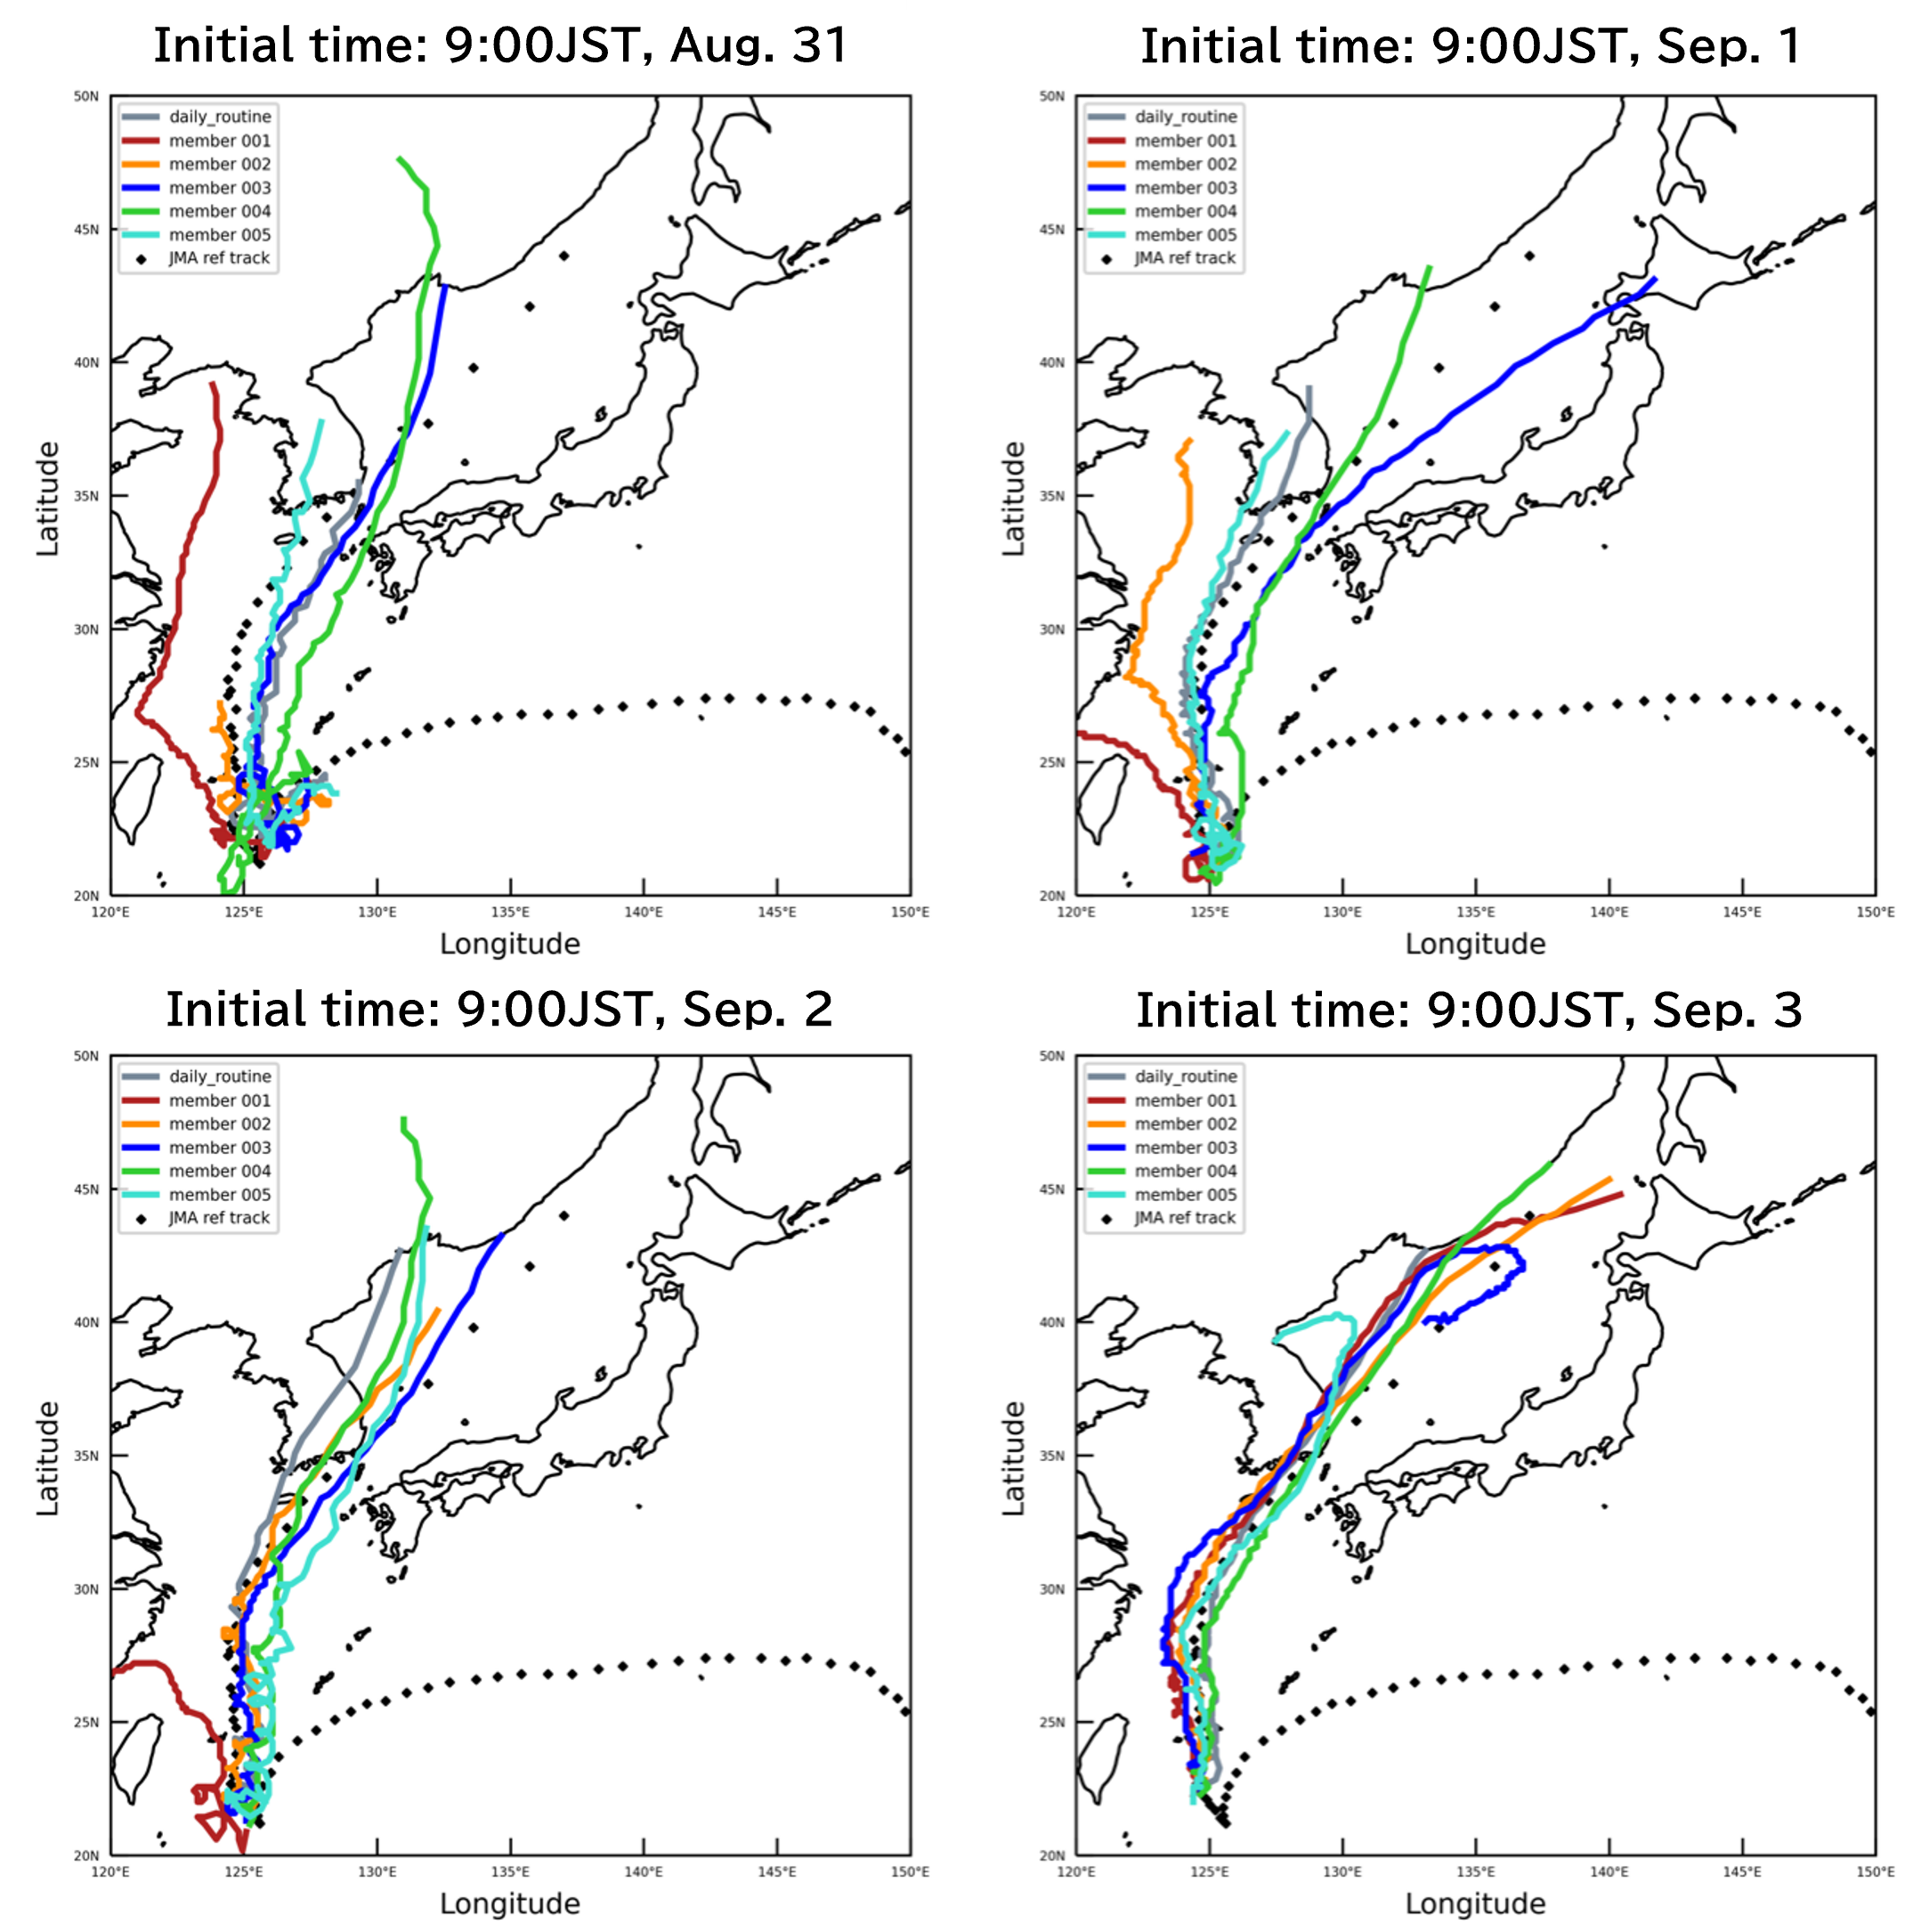
Figure 8 shows the results of NEXRA’s initial daily ensemble forecast experiment for typhoon tracks from August 31 to September 3. In all members of four initial time forecasts, Typhoon Hinnamnor is captured as moving northward after being stalled south of Okinawa. The August 31 initial forecast shows some variation in the path of the typhoon, but as the initial forecast progresses through September 2 and 3, the typhoon tracks for all members are predicted to be closer to the actual track as indicated by the black marks. It is predicted to land in Korea.
Conclusion
This report describes the results of JAXA’s satellite observation data and numerical simulation analysis and forecast experiments for Typhoon Hinnamnor, which approached Japan in late August and early September 2022. Typhoon Hinnamnor originated over Japan’s southern ocean east of the Ogasawara Islands and moved westward to south of Okinawa with increasing its strength. It remained in the ocean south of Okinawa, maintaining its tremendous power and causing damage to the Sakishima Islands. The typhoon weakened once during its period of stagnation over the ocean south of Okinawa, but then strengthened as it began to move northward. Finally, it moved northward over the East China Sea, made landfall over southern Korea, and passed over the Sea of Japan, where it turned into an extratropical cyclone.
In September this year, after Typhoon No. 11, Typhoon No. 12 hit the Sakishima Islands, and Typhoon No. 14 made landfall in Kyushu and crossed Japan. The development and track of these typhoons are influenced by the SST over the Southern Ocean and the weather field around Japan. These meteorological and oceanographic conditions are also captured by JAXA’s satellite observation data and real-time weather analysis system. Through real-time satellite observations, JAXA aims to disseminate information for disaster prevention and mitigation, and will continue to conduct research to contribute to the understanding of weather phenomena such as typhoons by analyzing the results of ensemble weather simulations.
This report was jointly written by Professor Masaki Sato and Dr. Ying-Wen Chen of the Atmosphere and Ocean Research Institute, the University of Tokyo, Dr. Takemasa Miyoshi and Dr. Shun Oishi of the RIKEN Center for Computational Science, and members of the Earth Observation Research Center (EORC).
<Related Sites>
- NEXRA
A weather information system developed by cooperation of JAXA, RIKEN and the University of Tokyo. With the upgrade of JAXA’s supercomputer in FY2021, the weather information provided by NEXRA has been improved. It can provide information with higher resolution.
https://www.eorc.jaxa.jp/theme/NEXRA/index_e.htm - JAXA Global Rainfall Watch (GSMaP)
https://sharaku.eorc.jaxa.jp/GSMaP/index.htm - Images and videos of three-dimensional rainfall by GPM/DPR “JAXA 3D RAINFALL WATCH”
https://www.eorc.jaxa.jp/GPM/3DRAIN_GLOBAL/index_e.html - AMSR Earth Environment Viewer
https://www.eorc.jaxa.jp/AMSR/viewer/index_e.html
<Related articles>
- Challenges in Typhoon Track Predictions~ Typhoon KROSA (TY1910) in 2019
https://earth.jaxa.jp/en/earthview/2020/03/05/1627/index.html - Measuring the decline of sea surface temperature from satellite during typhoon passage
https://earth.jaxa.jp/en/earthview/2020/09/23/1630/index.html
Search by Year
Search by Categories


Tags
-
#Earthquake
-
#Land
-
#Satellite Data
-
#Aerosol
-
#Public Health
-
#GCOM-C
-
#Sea
-
#Atmosphere
-
#Ice
-
#Today's Earth
-
#Flood
-
#Water Cycle
-
#AW3D
-
#G-Portal
-
#EarthCARE
-
#Volcano
-
#Agriculture
-
#Himawari
-
#GHG
-
#GPM
-
#GOSAT
-
#Simulation
-
#GCOM-W
-
#Drought
-
#Fire
-
#Forest
-
#Cooperation
-
#Precipitation
-
#Typhoon
-
#DPR
-
#NEXRA
-
#ALOS
-
#GSMaP
-
#Climate Change
-
#Carbon Cycle
-
#API
-
#Humanities Sociology
-
#AMSR
-
#Land Use Land Cover
-
#Environmental issues
-
#Quick Report
-
#GOSAT-GW
Related Resources


Related Tags
Disaster Related Articles
-
 Disaster 2025.10.23 Thu ALOS-2 Observations of the Earthquakes in the Philippines
(Cebu Island and Mindanao Island) -
 Disaster 2025.04.04 Fri ALOS-2 Observation of the M7.7 Earthquake in Myanmar
 -
 Disaster 2024.09.09 Mon ALOS-2 Observation of the Oil Spill Caused by the Sinking of a Tanker in Manila Bay, Philippines
 -
 Disaster 2023.04.07 Fri ALOS-2 observation: Oil spill from sunken oil tanker off Mindoro Island, Philippines (follow-up report)
Stay Connected
