


Research and Development
2020.03.05 Thu
Challenges in Typhoon Track Predictions~ Typhoon KROSA (TY1910) in 2019
In 2019, typhoons significantly affected daily life in Japan. For example, the fierce winds of typhoon FAXAI (TY1915) caused considerable damage around the Boso peninsula in Japan. Typhoon HAGIBIS (TY1919) ravaged property in the Tohoku district and the eastern part of Japan with its heavy rainfall and subsequent flooding over wide areas. According to a report issued by the Japan Meteorological Agency (JMA), the mean accuracy of typhoon track forecasting has continuously im-proved in recent decades with few exceptions. One example was the typhoon KROSA (TY1910) in 2019, whose track was forecast by operational centers and ensemble members many times with different results. The difficulty of forecasting the track of KROSA is the main focus of this article.
We briefly reflect on what happened when KROSA hit Japan. Upon landing, Typhoon KROSA crossed Japan, bringing torrential rains that reached record levels in many areas and resulted in two casualties and fifty-six injured. According to JMA’s rain gauges, the hourly precipitation reached 64 mm on August 15 in Shizuoka Prefecture. The 24-hour cumulative rainfall peaked at 620 mm on that day, and total precipitation resulting from this typhoon reached 872 mm in Kochi Prefecture.
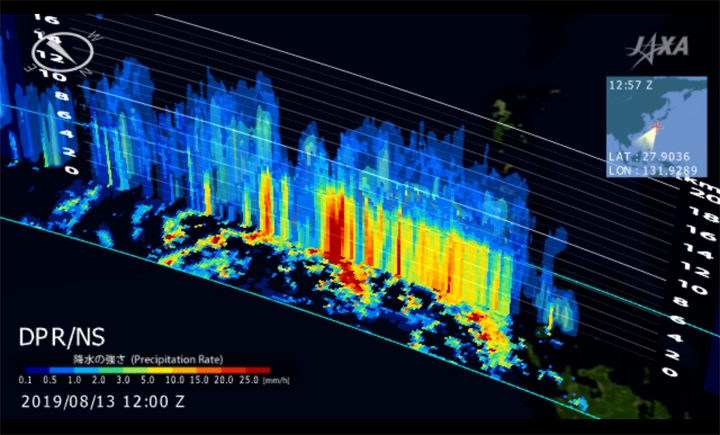
Figure 1 shows the track of Typhoon KROSA as observed by JAXA satellites. KROSA originated around the Mariana Islands as a tropical low pressure event and reached typhoon status on August 6, 2019. KROSA began heading northeast, maintaining its intensity, then stagnated over the Pacific Ocean during the period of 8–11 August. After August 11, it stated to move northwest and maintained its strength. Figure 2 shows the three-dimensional view of the precipitation structure, captured on 13 August by the Dual-frequency Precipitation Radar (DPR) onboard the Global Precipitation Measurement (GPM) Core Obser-vatory, as the typhoon approached Japan. The DPR data showed KROSA with heavy spiral rain bands. On August15, it made landfall at Kure city in Hiroshima Prefecture, passing over the Chugoku region and towards the Japan sea. The typhoon then weakened and was downgraded to an extratropical cyclone as it reached western Hokkaido on 16 August.
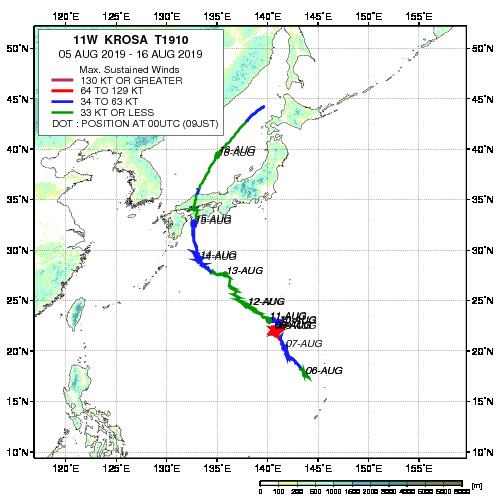
Figure 1. The track of Typhoon KROSA in 2019 provided by the JAXA/EORC Tropical Cyclone Database
As KROSA stagnated over the Pacific Ocean during 8–11 August, the track forecasts pro-vided by JMA were changed substantially. In its initial stages (August 6), the typhoon track was forecast to reach open ocean northeast of Japan. However, according to the track forecast issued on 9 August, noticeably different from the previous one, KROSA was expected to head more westward before approaching Japan. Finally, after 10 August, the track forecast by JMA reported that KROSA would make landfall in western Japan. This was the forecast track closest to the actual track of the typhoon. The uncertainties of the track prediction of KROSA were large, and it was unclear how the atmospheric environment would affect the typhoon’s path.
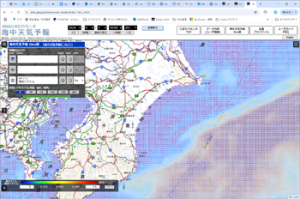
This article will explain how the predictions of KUROSA’s track were affected by the atmospheric environment by analyzing the ensemble data obtained from NICAM-LETKF JAXA Research Analysis (NEXRA). NEXRA is a weather prediction system and its predic-tion is initialized by the mean of 100 ensemble members produced by a data assimilation system, NICAM-LETKF. The NICAM-LETKF system provides a fusion of initial data by combining satellite observations and model simulations by using a data assimilation methods called LETKF. This system was developed by a joint project team of JAXA, the University of Tokyo, and RIKEN. NEXRA is now an functional system operating on JAXA’s supercomputer (JSS2). It constantly provides weather information that is released to the JAXA Realtime weather watch web site. The detailed information from NEXRA can be found on this web site.
■ Could we have predicted the track of Typhoon KROSA at an early stage?
The typhoon track prediction is determined by several factors which interact with complex processes. KROSA’s predicted tract may change significantly with only slight changes in meteorological conditions. If the effect of such factors on the typhoon track predictions can be better understood, predictive accuracy could improve enormously and would mitigate many disasters. Toward this goal, we conducted an analysis using the ensemble simulations initialized by 100 initial values at 4 initial times (every 00Z at 8, 9, 10, and 11 August 2019) obtained from NICAM-LETKF. The ensemble simulations were conducted on the JSS2. Using these simulations, we investigate how the predicted track of KROSA is affected by the atmospheric environment.
Figure 3 shows the simulated tracks of each member at with each initial time, and results are summarized as follows:
- Simulations with the initial time of 00Z, 8 August, 2019: Few members showed that KROSA would affect Japan while the rest passed over the Pacific Ocean heading northeast.
- Simulations with the initial time of 00Z, 9 August, 2019: Most members showed that KROSA might hit Japan, while the others expect it to veer away toward the Pacific Ocean in the northeast.
- Simulations with the initial time of 00Z, 10 and 11 August, 2019: All members showed that KROSA would hit Japan and indicated that it was likely to make landfall around Shikoku Area.
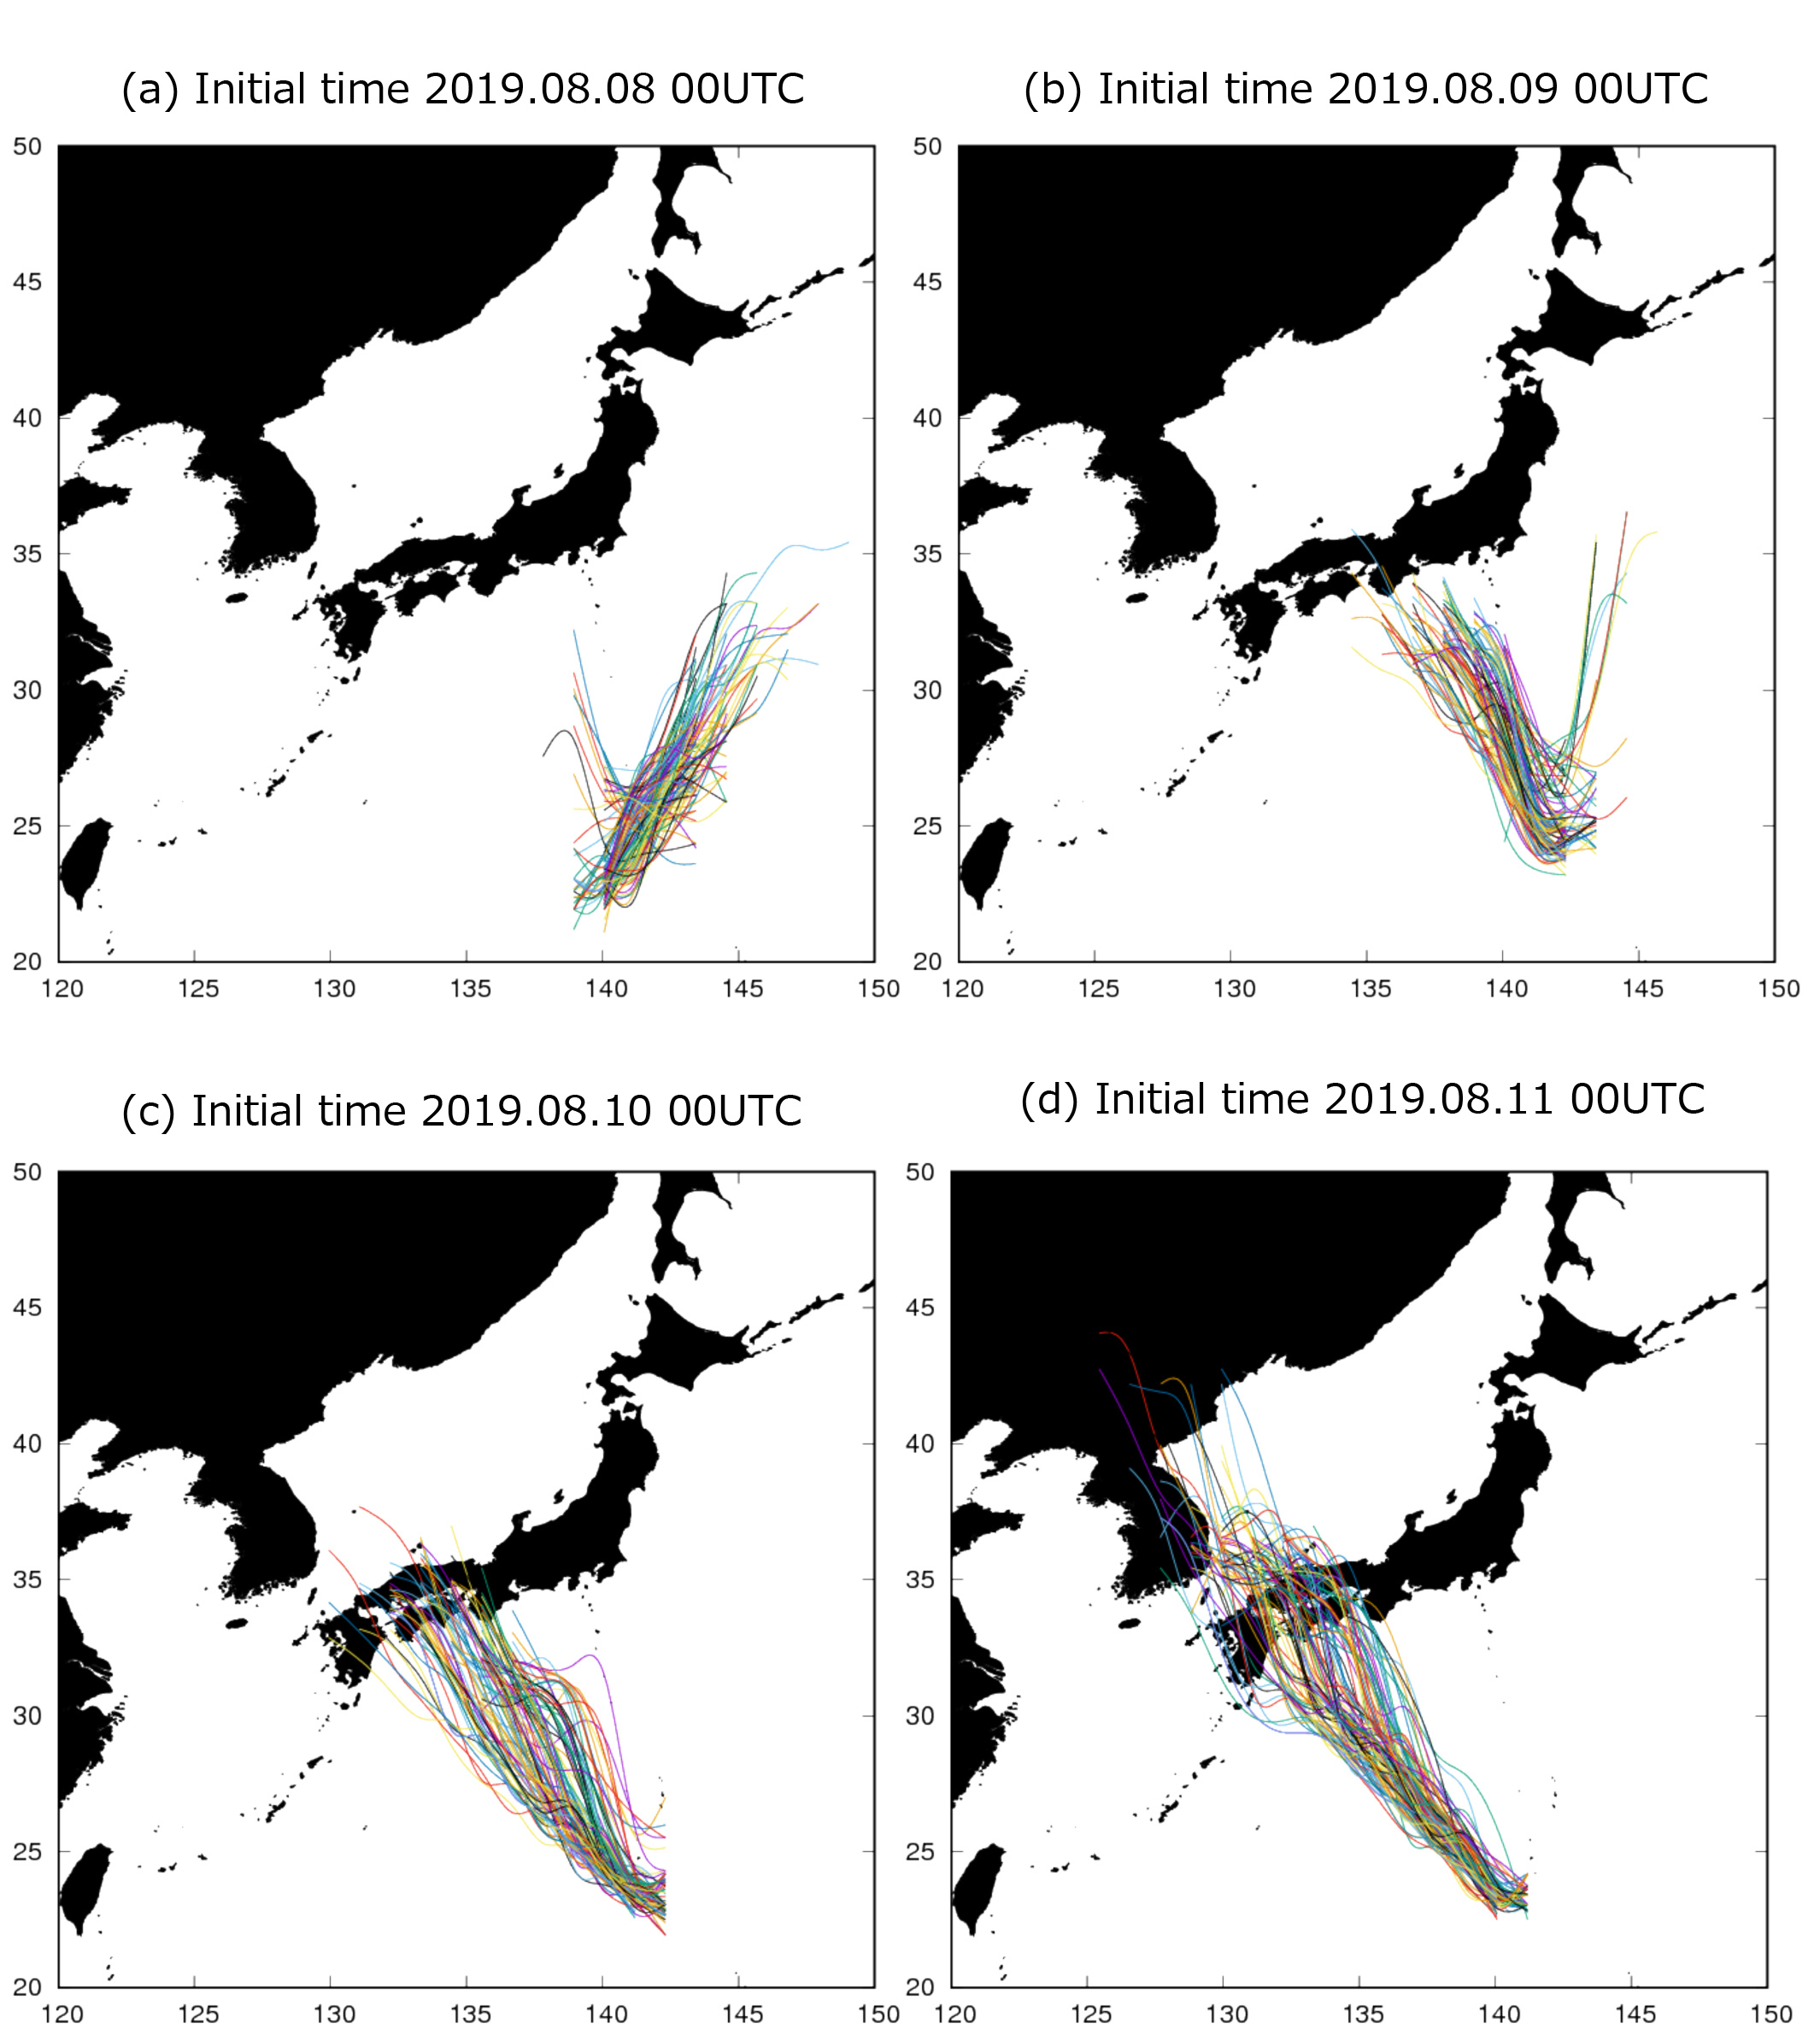
Results indicate that the predicted tracks of Typhoon KROSA dramatically changed within the initial period from 00Z 8 August to 00Z 9 August. Some of the members predicted landfall in western Japan, while others predicted that the typhoon would not even approach Japan (an erroneous simulation). Next, we investigate how the atmospheric environment (meteorological factors) affects KROSA’s track in more detail, based on the 200 ensemble simulation results obtained from initial time of 00Z at 8 and 9 August (100 ensemble simulations for each initial time).
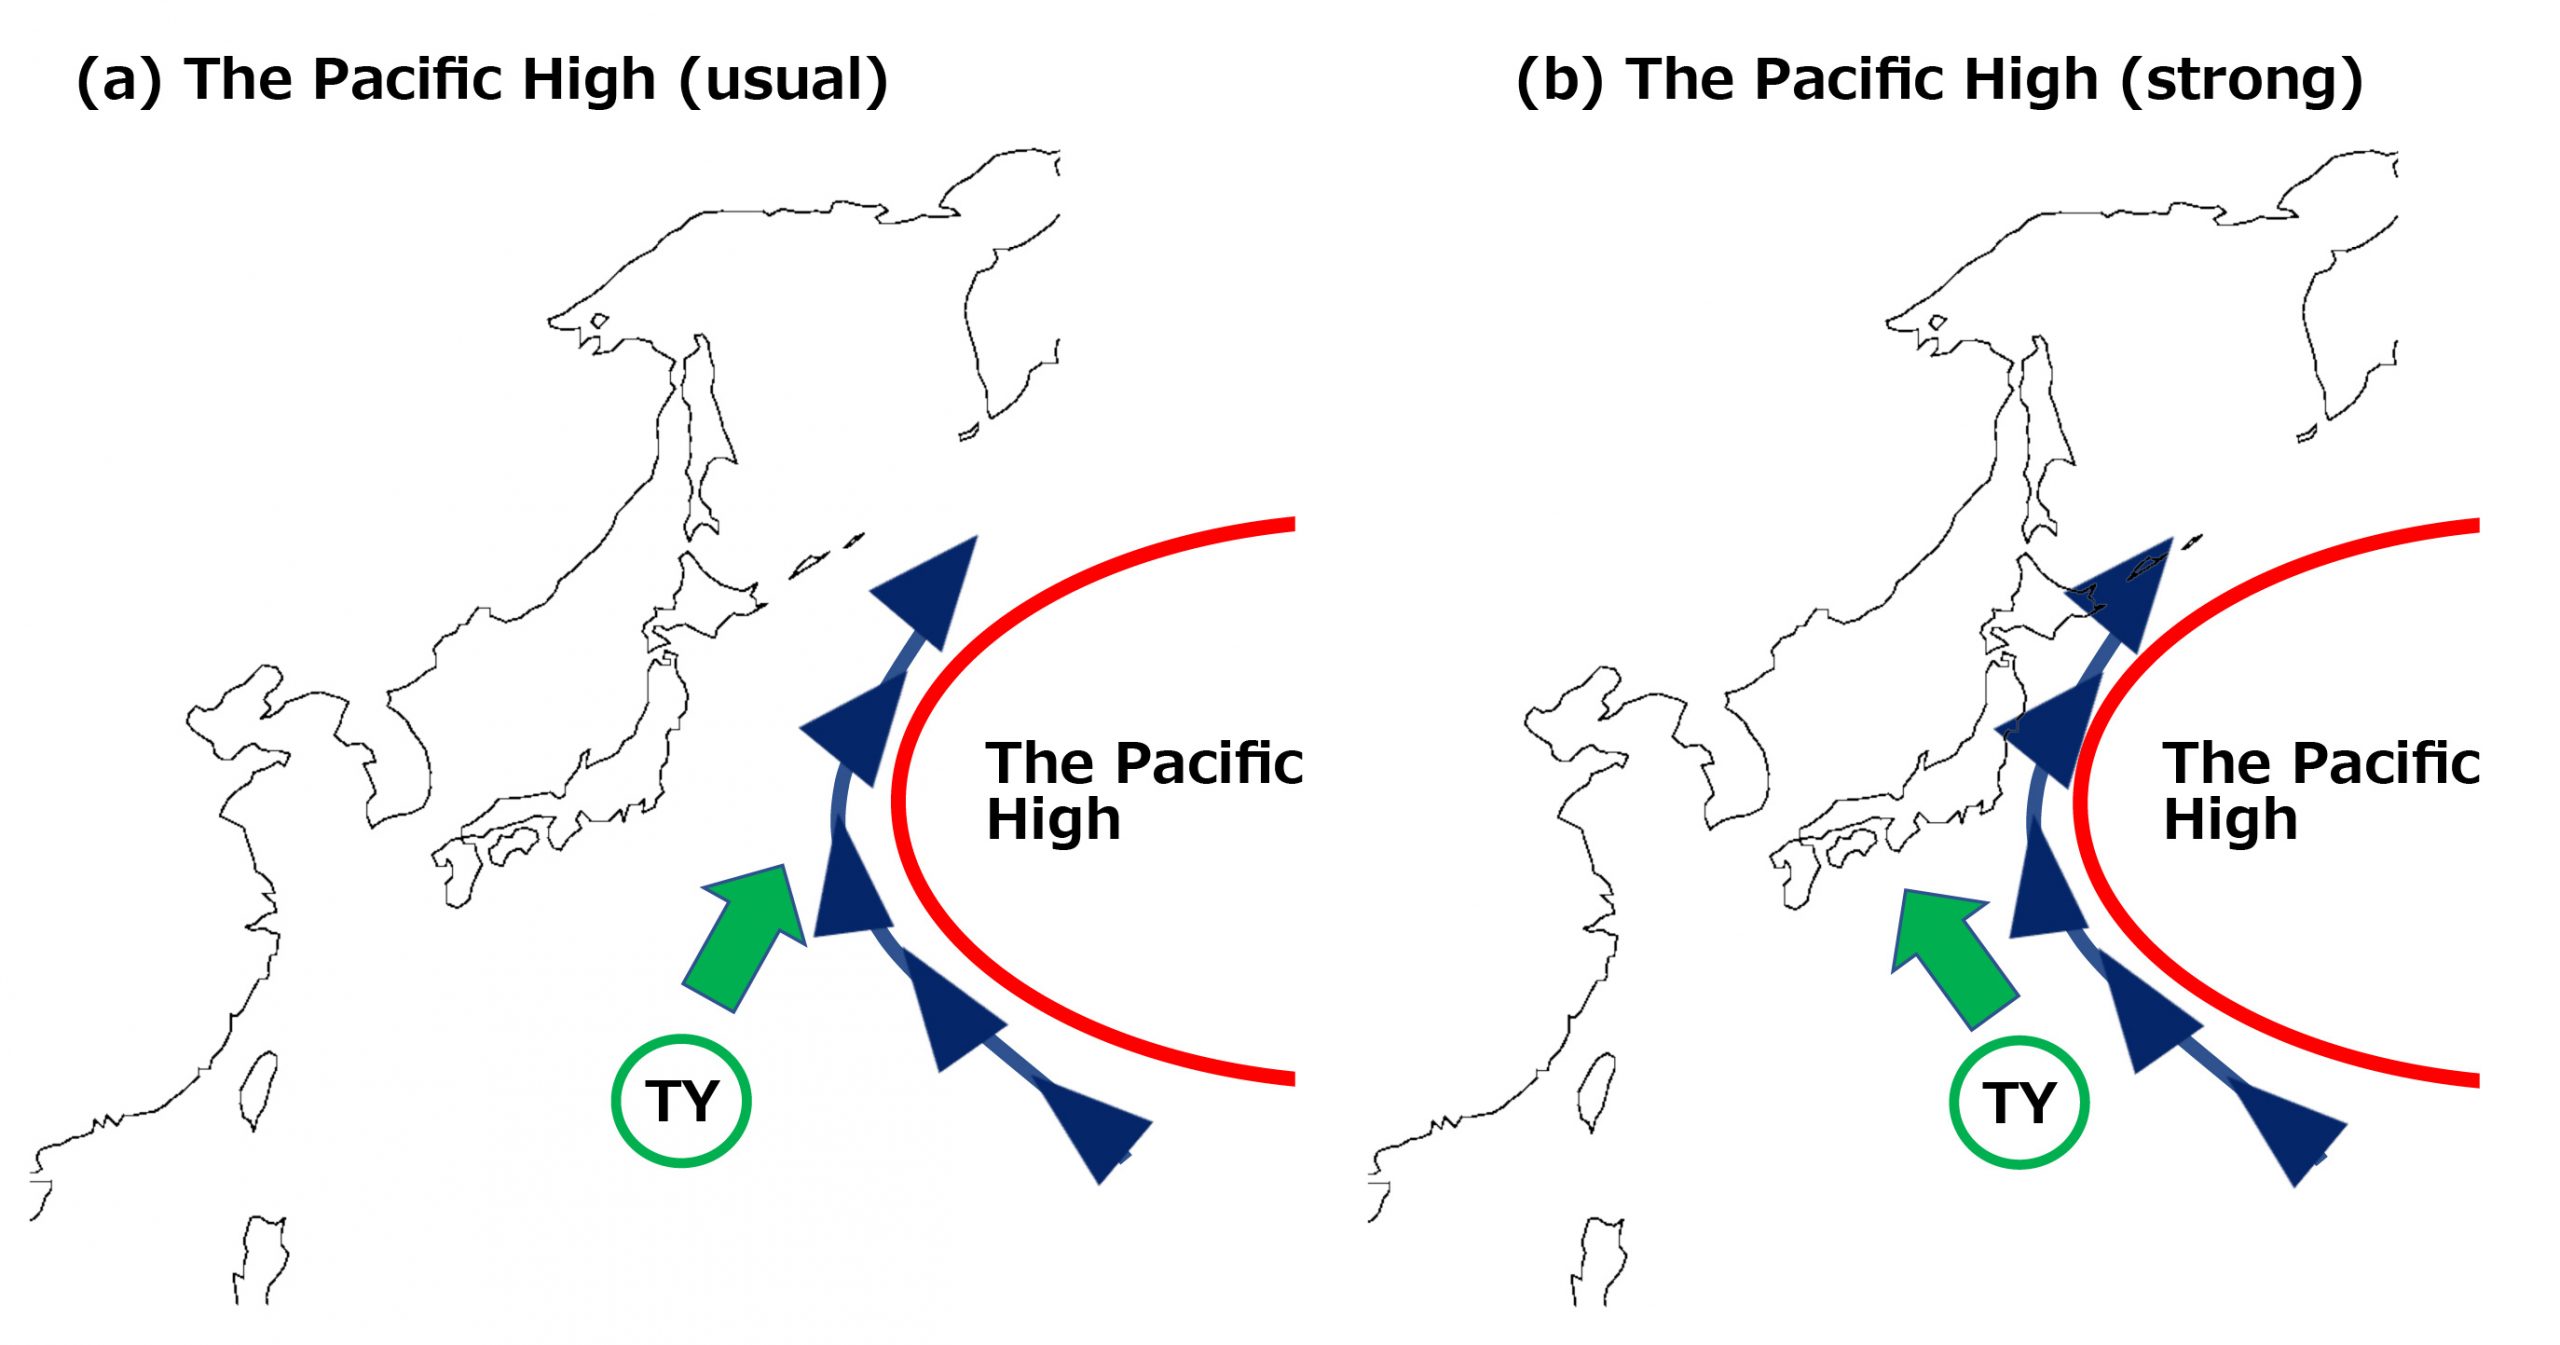
Figures 4a and 4b show the resulting correlation between the longitude of the typhoon center land sea-level pressure at predicted times of 12Z, 11 August 2019 (Fig. 4a) and 00Z, 12 August 2019 (Fig. 4b). These times were chosen to show when Typhoon KROSA started moving slowly northwest. A dark color depicts a high correlation (strongly related), red shows a positive correlation, and blue indicates a negative correlation. Contours show the average sea-level pressure of all members, and the red one shows the edge of the Pacific high. The area of negative correlation is from the east to the north side of the typhoon center covering the edge of the Pacific high. This area of negative correlation indicates that the members in which the center of the typhoon tends to be located westward when the Pacific high is strong. In other words, in the case of KROSA, a better typhoon track prediction is associated with how well the behavior of the Pacific high is simulated in the model.
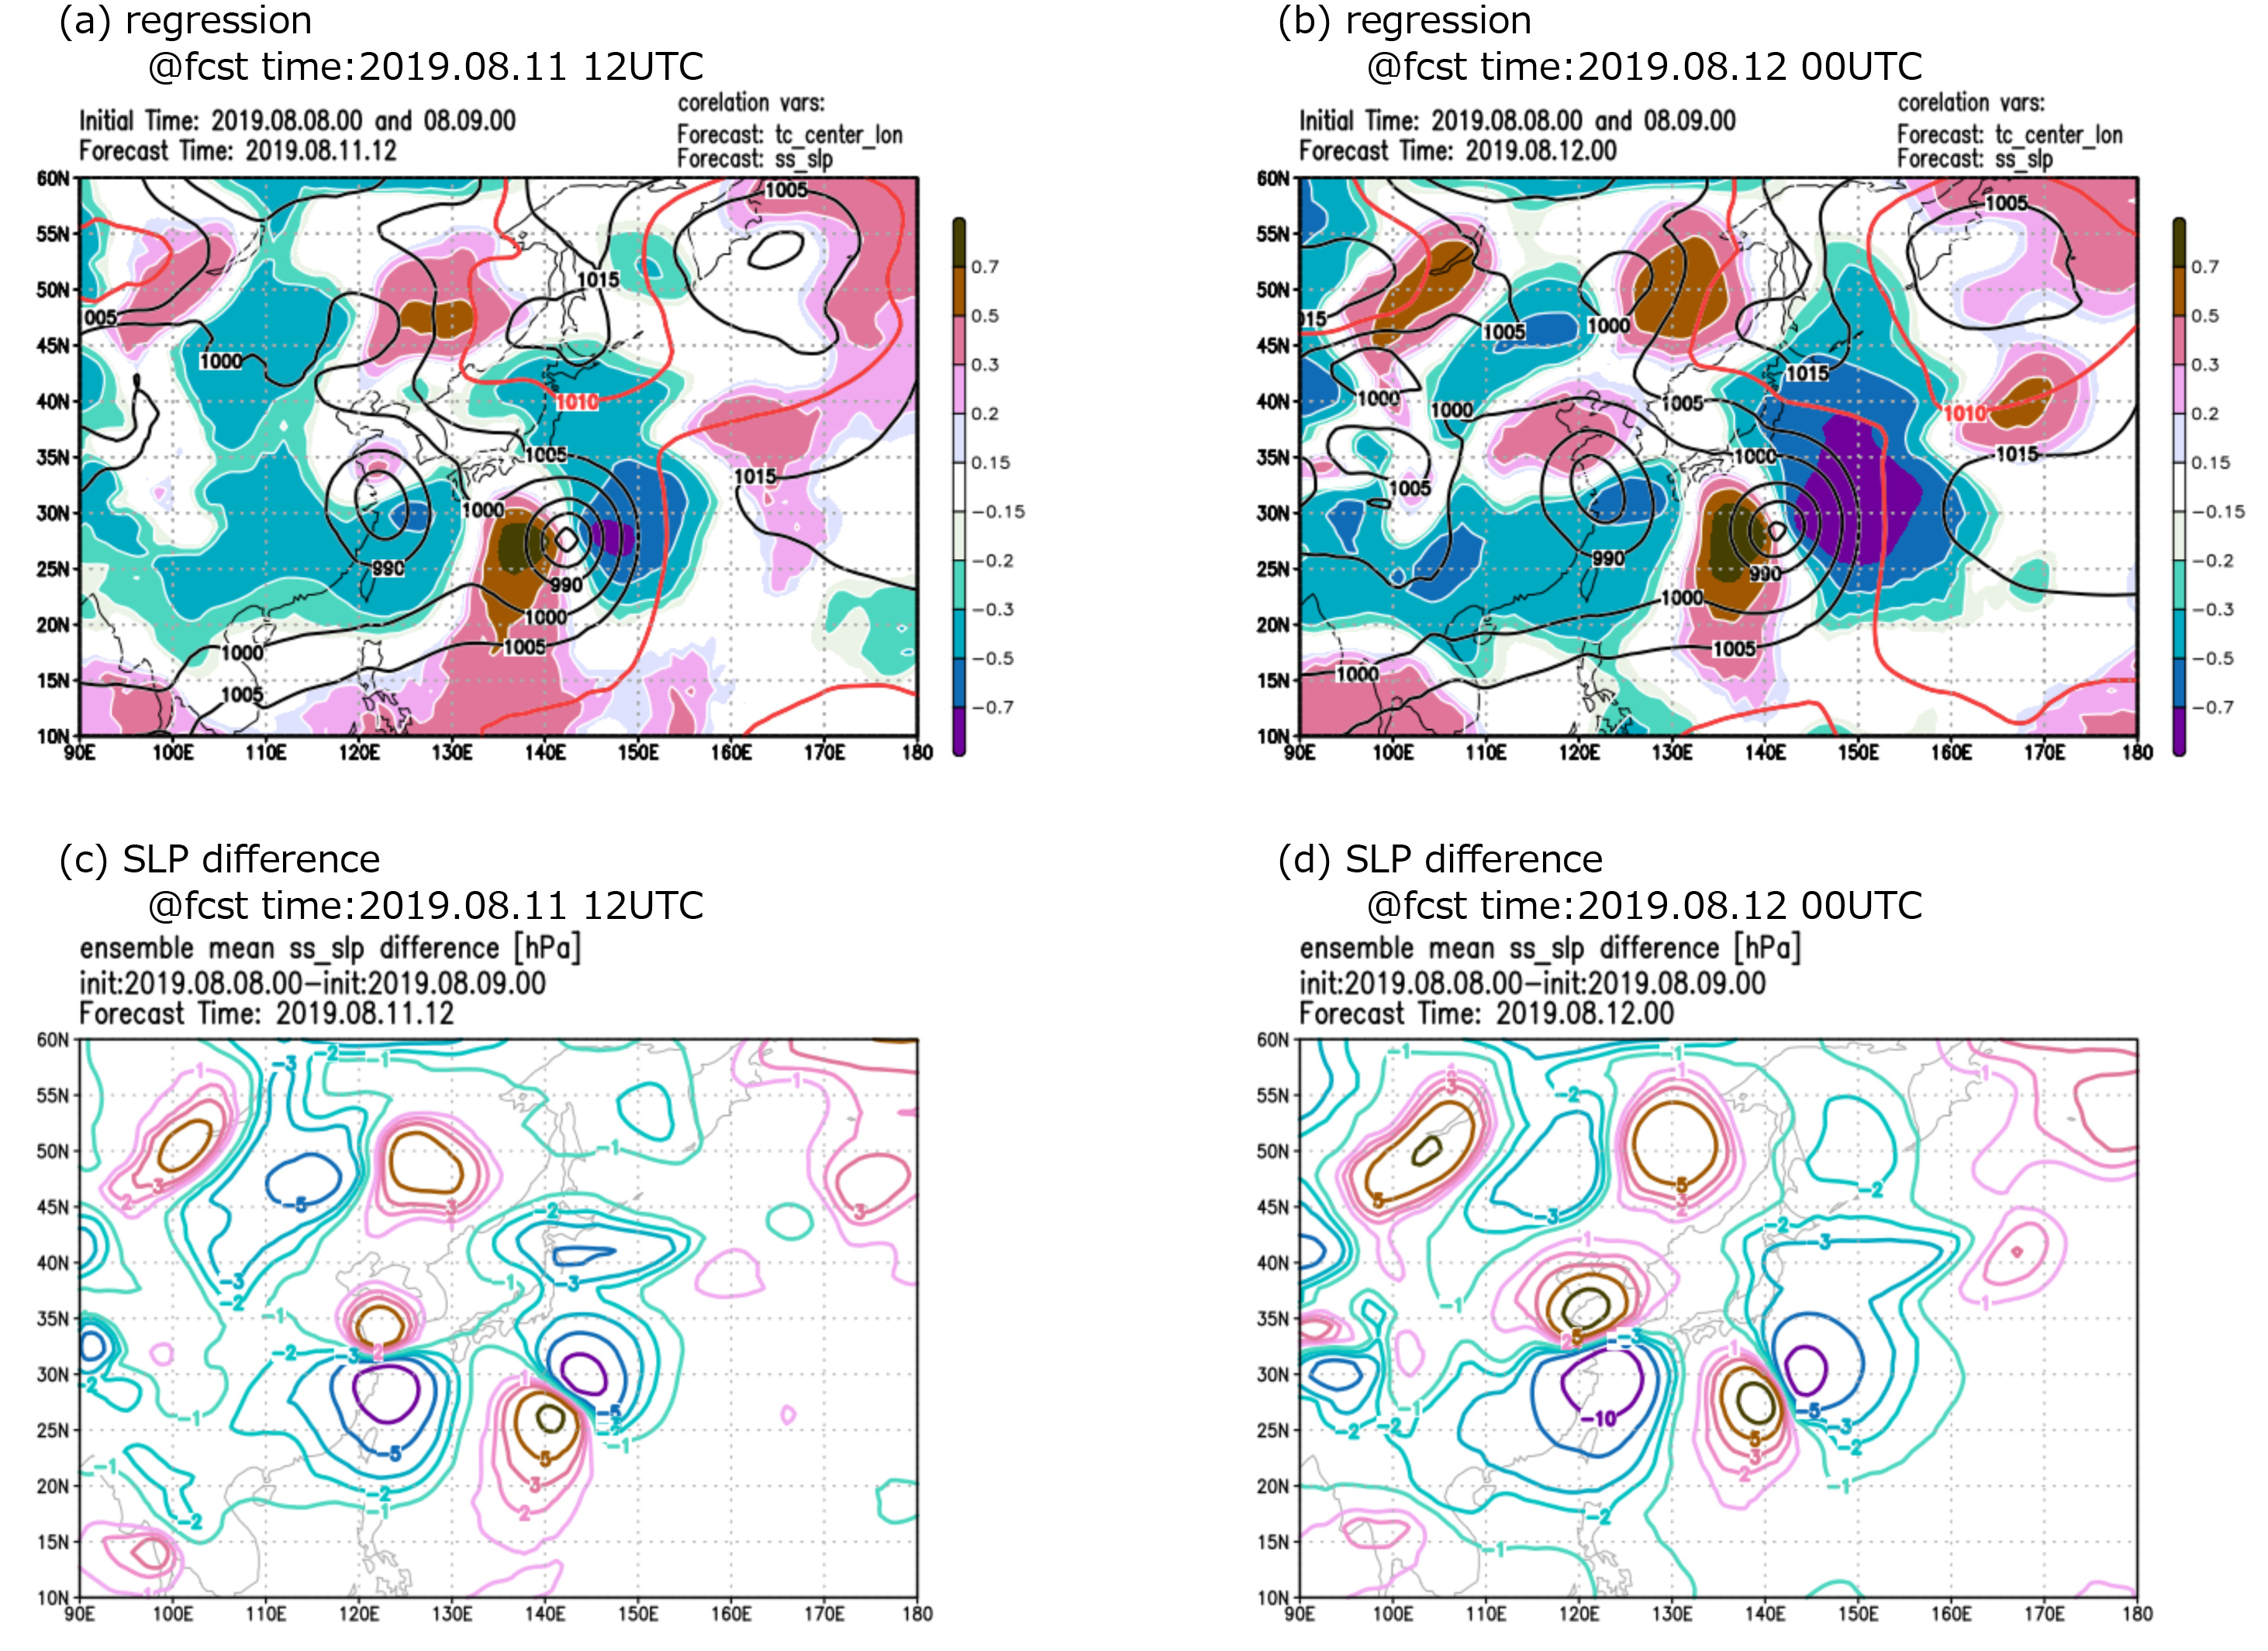
Another remarkable result is that the simulated Pacific high behavior is highly depends on the initial time. Figures 4c and 4d show how the sea-level pressure is different at the predicted times of 12Z, 11 August, 2019 and 00Z, 12 August, 2019, respectively. The negative (positive) area shows that the simulated Pacific high is stronger (weaker) at each prediction time. Results show that the Pacific high located at the northeast near the center of KROSA is stronger in the simulations with the later initial time at both predicted times of 12Z, 11 August, 2019 (Fig. 4c) and 00Z, 12 August, 2019 (Fig. 4d). In other words, the Pacific high extends to the west and tended to prevent the typhoon KROSA from moving north. Eventually, KROSA headed toward Japan (Figure 5).
■ NEXRA’s High Resolution Prediction
The NEXRA development team is now working on the next generation of NEXRA, which is expected to provide weather information at a higher resolution than the current version. In the current status, NEXRA provides weather information with 112 km horizontal resolution. In the next stage, NEXRA aims to provide weather information with 14 km horizontal res-olution. Models with this horizontal resolution, such as NICAM, are called the Global Cloud-system Resolving Model (GCRM) and small-scale weather motions such as cloud and precipitation processes can be simulated more realistically and accurately. As a result, it is expected that better weather information will be provided. Additionally, to contribute to atmospheric research, it is also expected that the data obtained from GCRMs can lead to a better understanding of weather phenomena such as typhoons and interactions between the typhoons and synoptic conditions.
The simulated behaviors of KROSA by this next generation of NEXRA system are shown here, as Figure 6, with initial time 00:00 UTC, August 11, 2019 when typhoon KROSA started to move after the almost stationary phase over the Pacific Ocean. Figure 7 shows the same for 00:00 UTC, August 12, 2019. These two simulations reproduce the typhoon structure with fewer rain near the center of typhoon until just before landfall in Japan. It also clearly showed the “eye of the typhoon,” confirming the simulated typhoon center have a good agreement with the observed typhoon track.

■ Summary
As shown in this article, simulated/predicted typhoon tracks may be determined reasonably well by their initial conditions, especially in the case of KROSA, whose track changed dramatically with the initial times of 00Z, 9 and 10 August, 2019. Ensemble simulations run on the JAXA supercomputer (JSS2) were used to investigate the relation between track prediction of KROSA and meteorological factors using ensemble initial data provide from the NICAM-LETKF system. Results showed that the intensity of the westward extension of the Pacific high and the simulated typhoon track are closely related. Further research on how to simulate the strength of the Pacific high more accurately and finding the factor causing the strength of the Pacific high change may lead to a significant improvement in typhoon track predictions.
This article shows that the ensemble data obtained from NEXRA may be used to good effect in investigating on how typhoon track forecasts are affected by the atmospheric environ-ment and other related studies. We also expect to provide the weather information of the JAXA Realtime weather watch with higher resolution by the next generation of NEXRA, whose launch on JAXA’s next supercomputer (JSS3) is planned for later in JFY2020. Stay tuned!
(Analysis and writings: Atmosphere and Ocean Research Institute, the University of Tokyo, Dr. Ying-Wen Chen (Project Researcher)·Prof. Satoh Masaki / Japan Agency for Marine-Earth Science and Technology, Masuo Nakano (Researcher)/ Earth Observation Re-search Center, Japan Aerospace Exploration Agency, Takuji Kubota (Associate Senior Researcher)
Explanation of the Images
Figure 2.
| Satellite | Global Precipitation Measurement Core Observatory (GPM Core Observatory) |
|---|---|
| Sensor | Dual-frequency Precipitation Radar (DPR) |
| Date | August 13, 2019, 12:57 (UTC) |
Related Sites
Search by Year
Search by Categories


Tags
-
#Earthquake
-
#Land
-
#Satellite Data
-
#Aerosol
-
#Public Health
-
#GCOM-C
-
#Sea
-
#Atmosphere
-
#Ice
-
#Today's Earth
-
#Flood
-
#Water Cycle
-
#AW3D
-
#G-Portal
-
#EarthCARE
-
#Volcano
-
#Agriculture
-
#Himawari
-
#GHG
-
#GPM
-
#GOSAT
-
#Simulation
-
#GCOM-W
-
#Drought
-
#Fire
-
#Forest
-
#Cooperation
-
#Precipitation
-
#Typhoon
-
#DPR
-
#NEXRA
-
#ALOS
-
#GSMaP
-
#Climate Change
-
#Carbon Cycle
-
#API
-
#Humanities Sociology
-
#AMSR
-
#Land Use Land Cover
-
#Environmental issues
-
#Quick Report
-
#GOSAT-GW
Related Resources


Related Tags
Research and Development Related Articles
-
 Research and Development 2026.03.09 Mon High-Resolution Predictions of Global Terrestrial Water Cycle:
Today’s Earth – Global Updated -
 Research and Development 2025.06.18 Wed Advancing Space-Based Weather Analysis and Forecasting – Renewal of JAXA’s Realtime Weather Watch ‘NEXRA3’ and Performance Evaluation with the previous system (Overview Article)
 -
 Research and Development 2025.03.27 Thu Launch of Ocean Weather Forecasts 1km resolution
 -
 Research and Development 2024.05.27 Mon The Use of Earth Observation Satellite Data in the Humanities and Social Sciences (3)
Stay Connected
