


Research and Development
2022.09.05 Mon
“SHIKISAI” (GCOM-C) marks the fifth year since its successful launch: Achievements in the snow and ice environment
Contents:
1. Rapid snowmelt in the Arctic and the cryosphere captured by GCOM-C
2. Monitoring rapid changes in the Arctic environment by GCOM-C
2.1 Monitoring of the Arctic river surface temperatures and the river channel width by GCOM-C
2.2 The Greenland Ice Sheet darkening monitored by GCOM-C
2.3 Development of Snow and Ice surface albedo products by GCOM-C
3. Global warming monitoring and future projections using GCOM-C, Earth system models and polar climate models
4. Daily monitoring of Okhotsk sea ice by GCOM-C
5. Summary
1. Rapid snowmelt in the Arctic and the cryosphere captured by GCOM-C
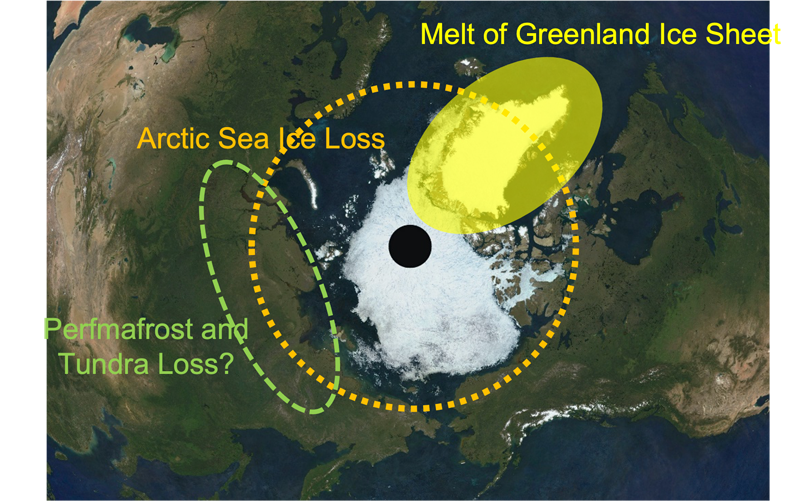
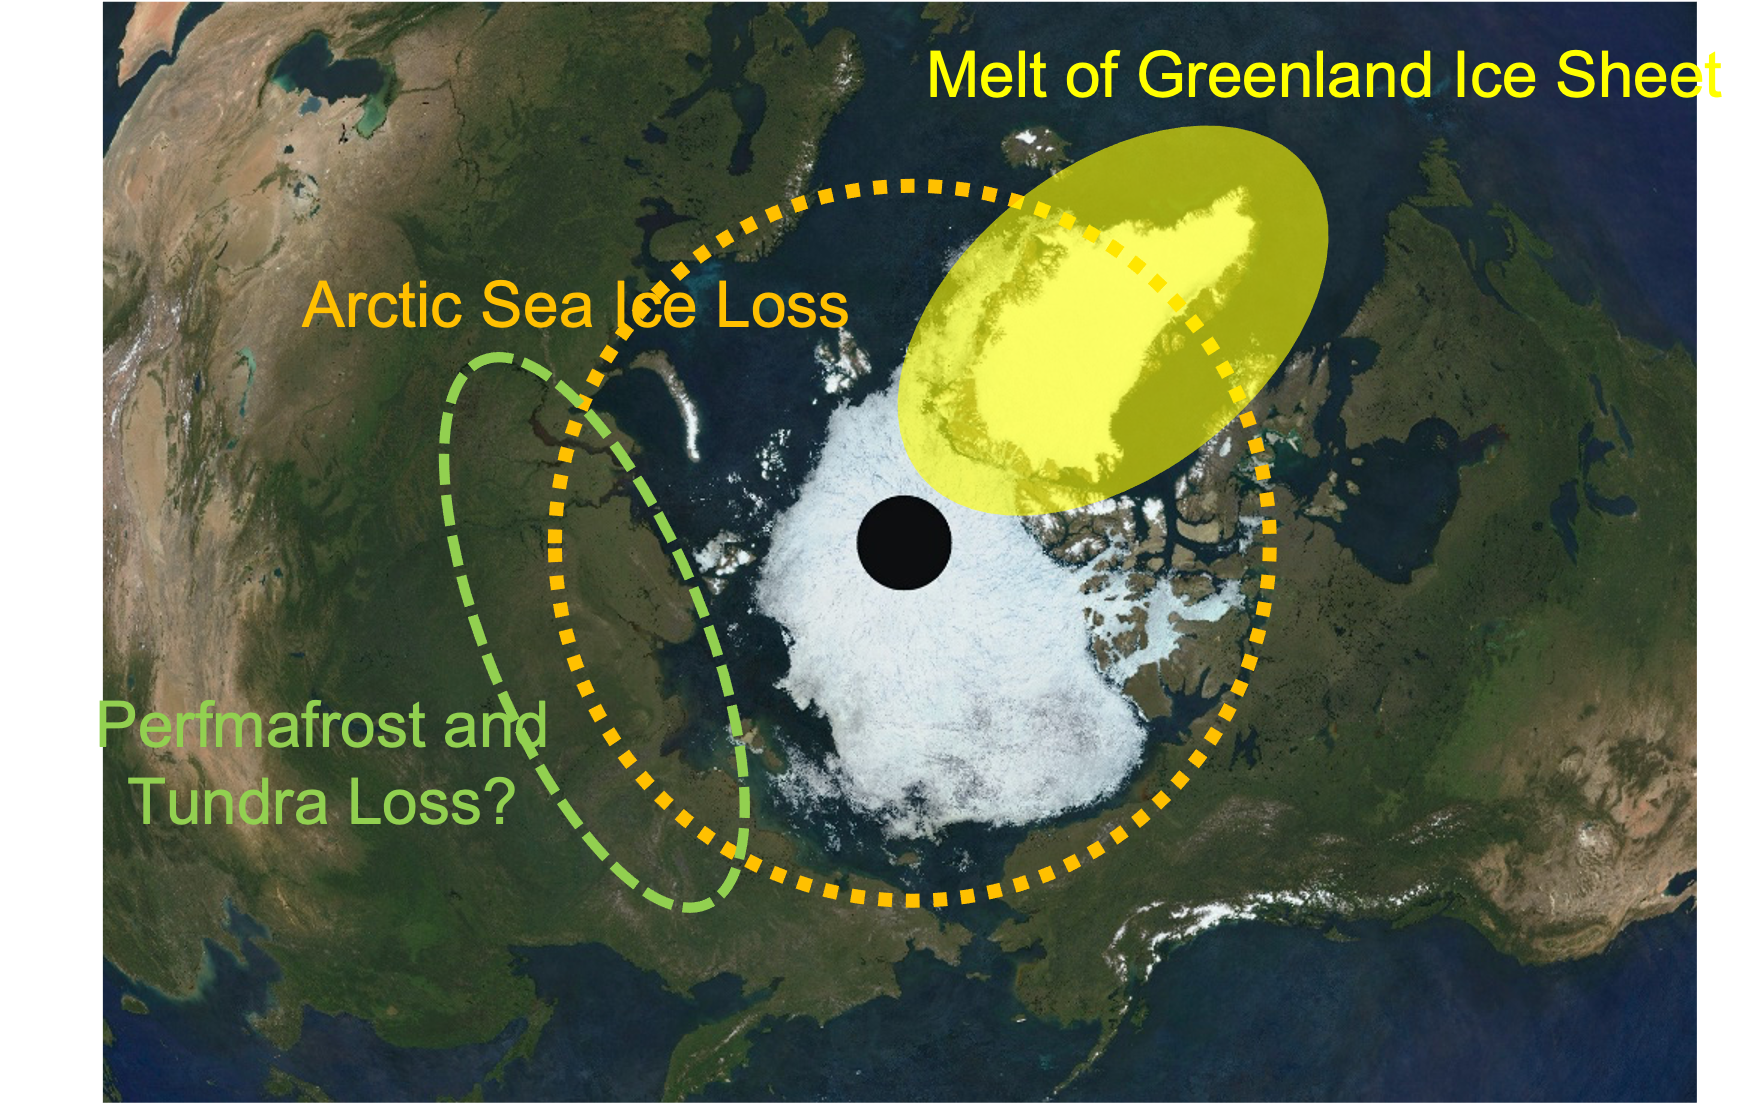
In the global warming associated with recent climate change, the cryosphere, such as snow and ice, is known to be the first to show the signs. It is a signal of global warming because the cryosphere is changing visually like snow melting and sea ice extent decline. For example, the sea ice extent in the Arctic Ocean has been continuously monitored by satellites since the 1970’s and it was the smallest in 2012. We are frequently picking up related articles as evidence of global warming. See the article for a typical example.
> Link to the article about atmosphere, land, and ocean observations <
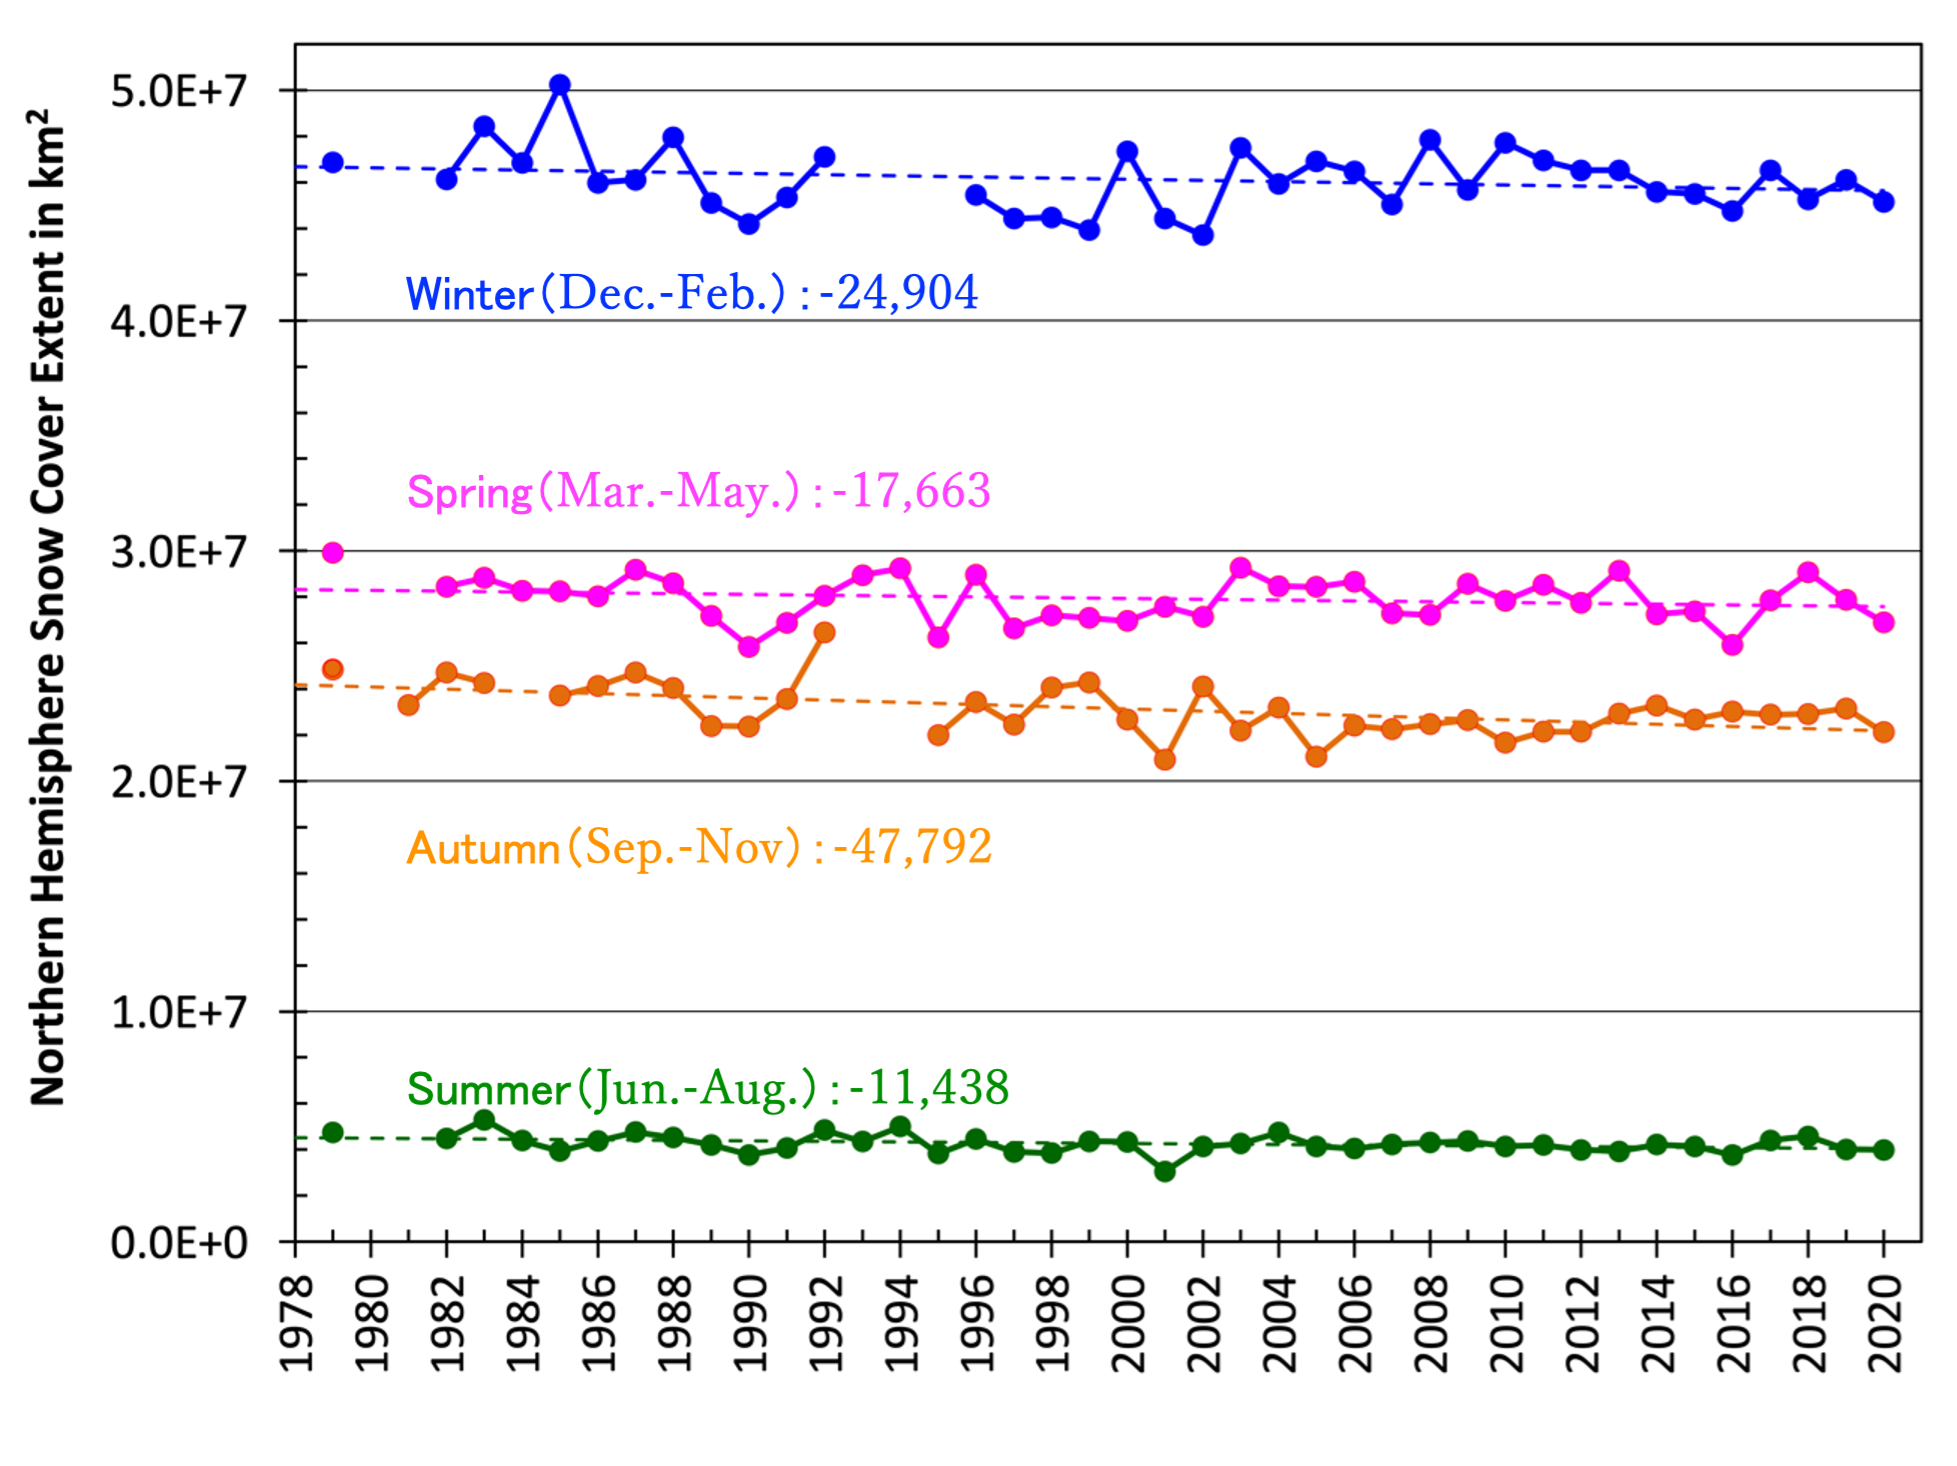
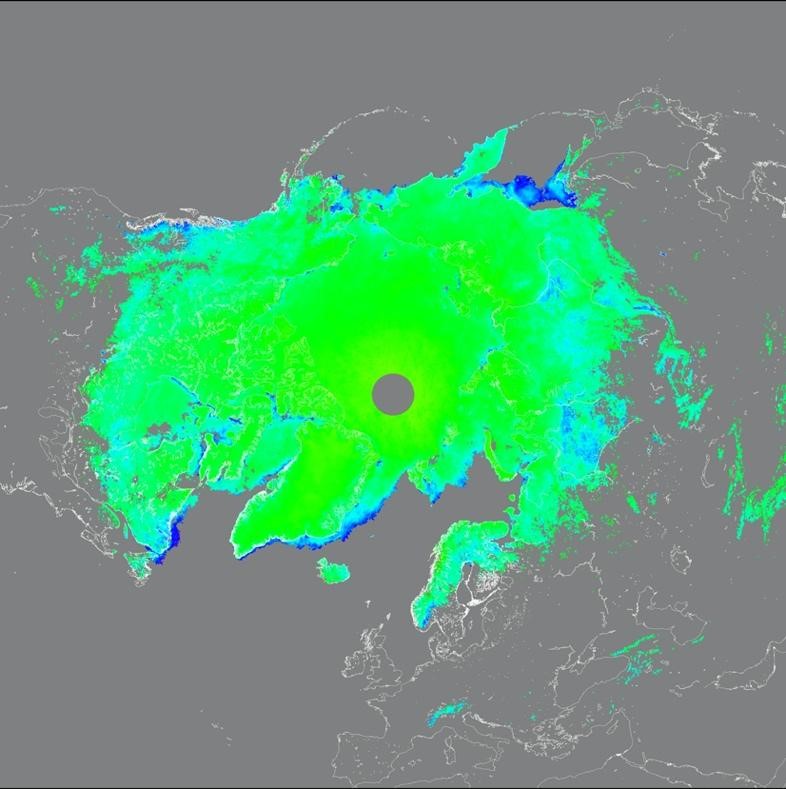
It is known that the impacts of global warming are also evident in snow cover distribution on land. A long-term analysis conducted as a part of the GCOM-C project, combining multiple satellite data for nearly 40 years since 1979, clarified that snow cover extent across the Northern Hemisphere lands has been on a declining trend in recent years (Hori et al., 2017, Figure 1). This declining trend has been observed in all seasons throughout the year over the Arctic region and provided a clear indication of the global warming impact. In particular, the analysis revealed a significant decrease in winter snow cover extent in Europe and the U.S. On the other hand, it has also been reported that fall snow cover extent has tended to expand in Canada and the U.S. since the 2000s, indicating that there are differences by season and region.
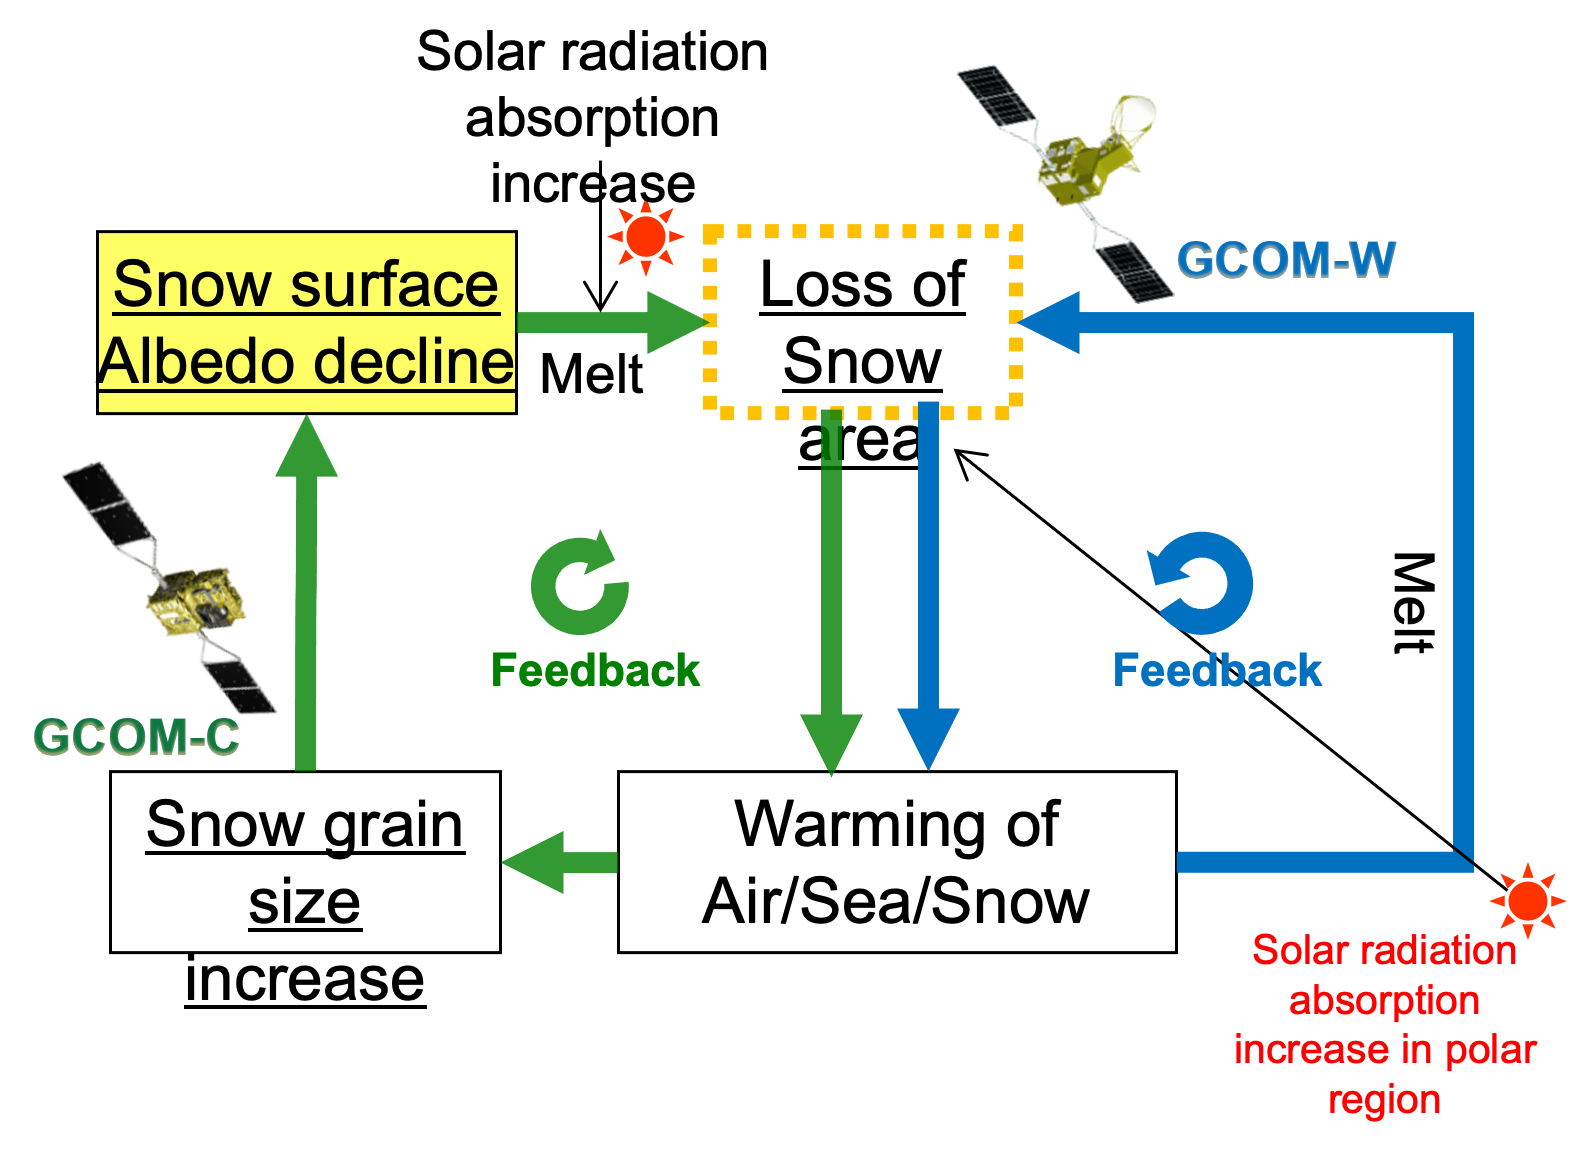
Snow and ice are white compared to bare soil grounds or sea surfaces and reflect more solar radiation. Therefore, it is known that snow and sea ice melting exposes dark land and sea surfaces, thereby reducing the rate of solar radiation reflectance (=albedo). Once the albedo decreases, a greater proportion of sunlight is absorbed by the ground surface, causing an “ice albedo feedback effect” that accelerates snow and ice melting. This effect is especially noticeable in the Arctic region due to the reduction in snow and ice cover, which has increased the warming trend. For that reason, rapid warming in the Arctic region is called “Arctic Amplification”. In order to understand such feedback, monitoring snow and ice distribution widely and continuously is a very important target for satellite earth observation, including GCOM-C (Figure 2). In fact, the information on snow cover distribution obtained from long-term multiple satellite dataset are registered as ECV products (Essential Climate Variable) established by the Global Climate Observing System (GCOS) for the purpose of capturing and predicting global environmental changes associated with climate change in a concrete and accurate manner, contributing to our understanding of climate change.
In recent years, it has been clear that changes are also increasing in the Greenland ice sheet (GrIS), where snow and ice are found throughout the year. The GrIS is the second largest ice body in the world, after the Antarctic ice sheet and has about 8% of the freshwater on the planet. The amount of ice on Greenland is equivalent to a global rise in sea level of about 7.4 meters if all of the ice were to melt. Thus, the environmental changes, especially the increase and decrease in the mass of the ice sheet, are attracting attention.
According to the Sixth Assessment Report (AR6) of the Intergovernmental Panel on Climate Change (IPCC), the GrIS has been losing mass for the past two decades. In addition, if global warming continues at this rate, melting of the GrIS is also considered as one of the tipping elements that can lead to a tipping point with irreversible, large-scale changes (Figure 3). The mass balance (mass budget) of the ice sheet is determined by the amount of ice flowing out to sea at the margins and the surface mass balance caused by snowfall and surface melt. Recently, it has been proved that the surface mass balance contributes a lot to the decrease in ice sheet mass. For that reason, the research and development of regional climate models for ice sheet melting and mass balance estimation has been intensified. In order to estimate the amount of ice sheet melting correctly, we need to know the exact albedo of the snow and ice surface. Therefore, the GCOM-C/SGLI products releases “Snow and ice albedo” as “research products” which are products under development including research elements, in parallel with “standard products”, which provide product data on a regular basis. It is known that the factors decreasing the albedo of the GrIS include the increased snow grain size in internal regions, effects of bare ice areas due to snow melting at the margins and dark ice areas where bare ice areas are contaminated by mineral particles and snow and ice microorganisms. As one of the GCOM-C/SGLI standard products, “Snow grain size of shallow layer (SGSL)” has been releasing and updating. In parallel, we are examining the distribution of bare ice and dark ice areas and monitoring the cryosphere including the GrIS, which show rapid changes. Furthermore, by collaborating with regional climate models, the knowledge gained from satellite observations is provided as feedback to model development and the accuracy of mass balance estimation is improved.
2. Monitoring rapid changes in the Arctic environment by GCOM-C
2.1 Monitoring of the Arctic river surface temperatures and the river channel width by GCOM-C
GCOM-C’s high spatial resolution of 250 m and continuous observations have enabled us to monitor typical river water temperatures in the Northern Hemisphere. Previous studies have revealed that the snow cover extent in the Northern Hemisphere is decreasing over the years. By taking advantage of GCOM-C’s continuous high-resolution observations and combining with previous snow cover dataset, Hori et al. (2021) explored changes in the river surface temperature (Figure 4) and the river channel width (Figure 5) associated with the loss of snow cover, which have been difficult for existing medium-resolution satellites. It is known that freshwater inflow into the Arctic Ocean by river water not only varies with snow cover extent on land, but also the heat supplied with freshwater reduces sea ice thickness (Park et al., 2020), which plays an important role in mutual understanding of snow cover on land and sea ice.
2.2 The Greenland Ice Sheet darkening monitored by GCOM-C
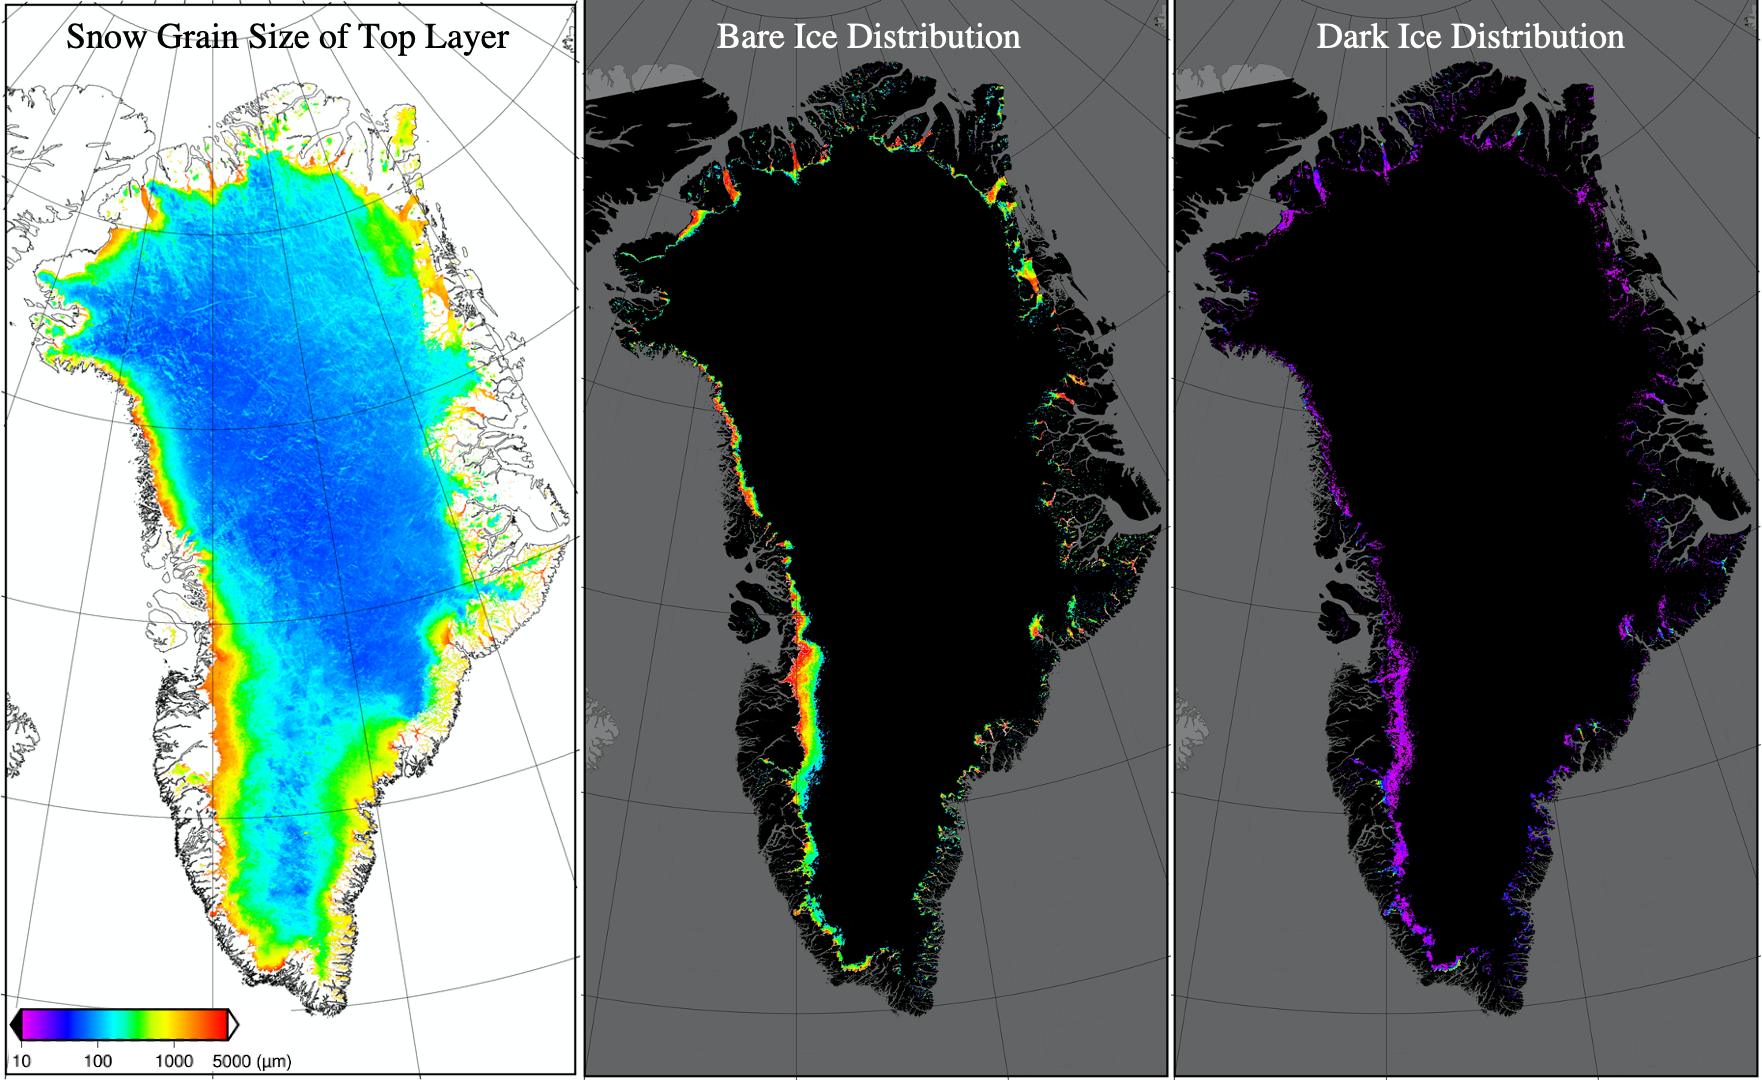
The GrIS, one of the major tipping elements in the IPCC report, has been experiencing rapid ice mass loss in recent years due to the decrease of snow and ice surface albedo. In the GCOM-C project, SGSL is defined as a standard product and “Snow grain size of top layer (SNGST)” is defined as a research product for the purpose of elucidating the factors that cause the decrease of snow and ice surface albedo. GCOM-C is monitoring snow grain size, bare ice and dark ice areas, including the GrIS (Figure 6). Also, as previously introduced here in “Updates on Earth”, we are conducting in-situ observations of the GrIS and other polar and cryospheric regions to verify the accuracy of these products, with the aim of providing highly accurate products (Figure 7).

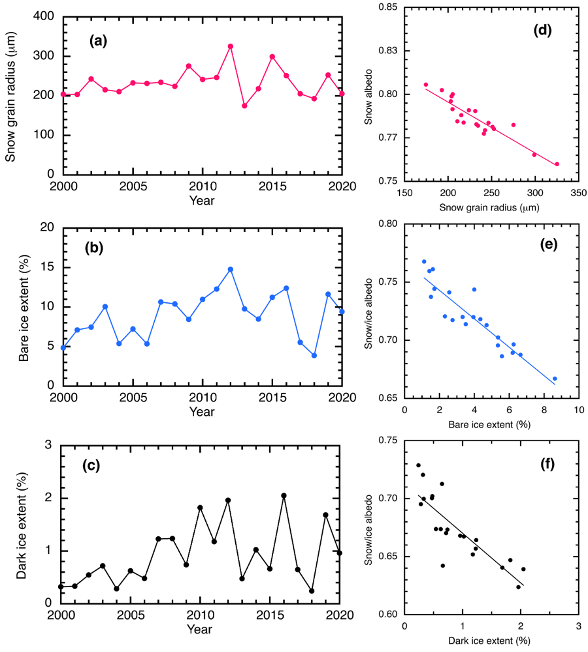
We analyzed the surface snow grain radius and distributions of bare/dark ice areas in the GrIS in July using a long-term satellite data set since 2000, which was developed by utilizing the knowledge obtained from GCOM-C snow and ice algorithm development. The results show an increasing trend of surface snow grain radius until 2012, and a large interannual variation in the following years (Figure 8). Through comparisons with snow and ice surface albedo, it has become clear that snow grain radius and bare and dark ice extent have a significant effect on albedo decline during the summer melt season. Since both of these changes have increased since 2012, continuous observation adding GCOM-C data will be very important from now on.
2.3 Development of Snow and Ice surface albedo products by GCOM-C
The GCOM-C project is developing algorithms to estimate snow and ice surface albedo with high accuracy. Snow and ice surface albedo is a fundamental and important parameter for thinking about the energy budget of the earth’s surface, and is also positioned as a research product in GCOM-C. Given its scientific importance and high needs, the data has been released and provided to the public since November 2021. The GCOM-C project has proposed two types of methods for determining albedo, and we are conducting continuous performance testing, validation, and cross comparison, including application to Greenland and Antarctica, to further improve the accuracy of the method (Figure 9).
3. Global warming monitoring and future projections using GCOM-C, Earth system models and polar climate models
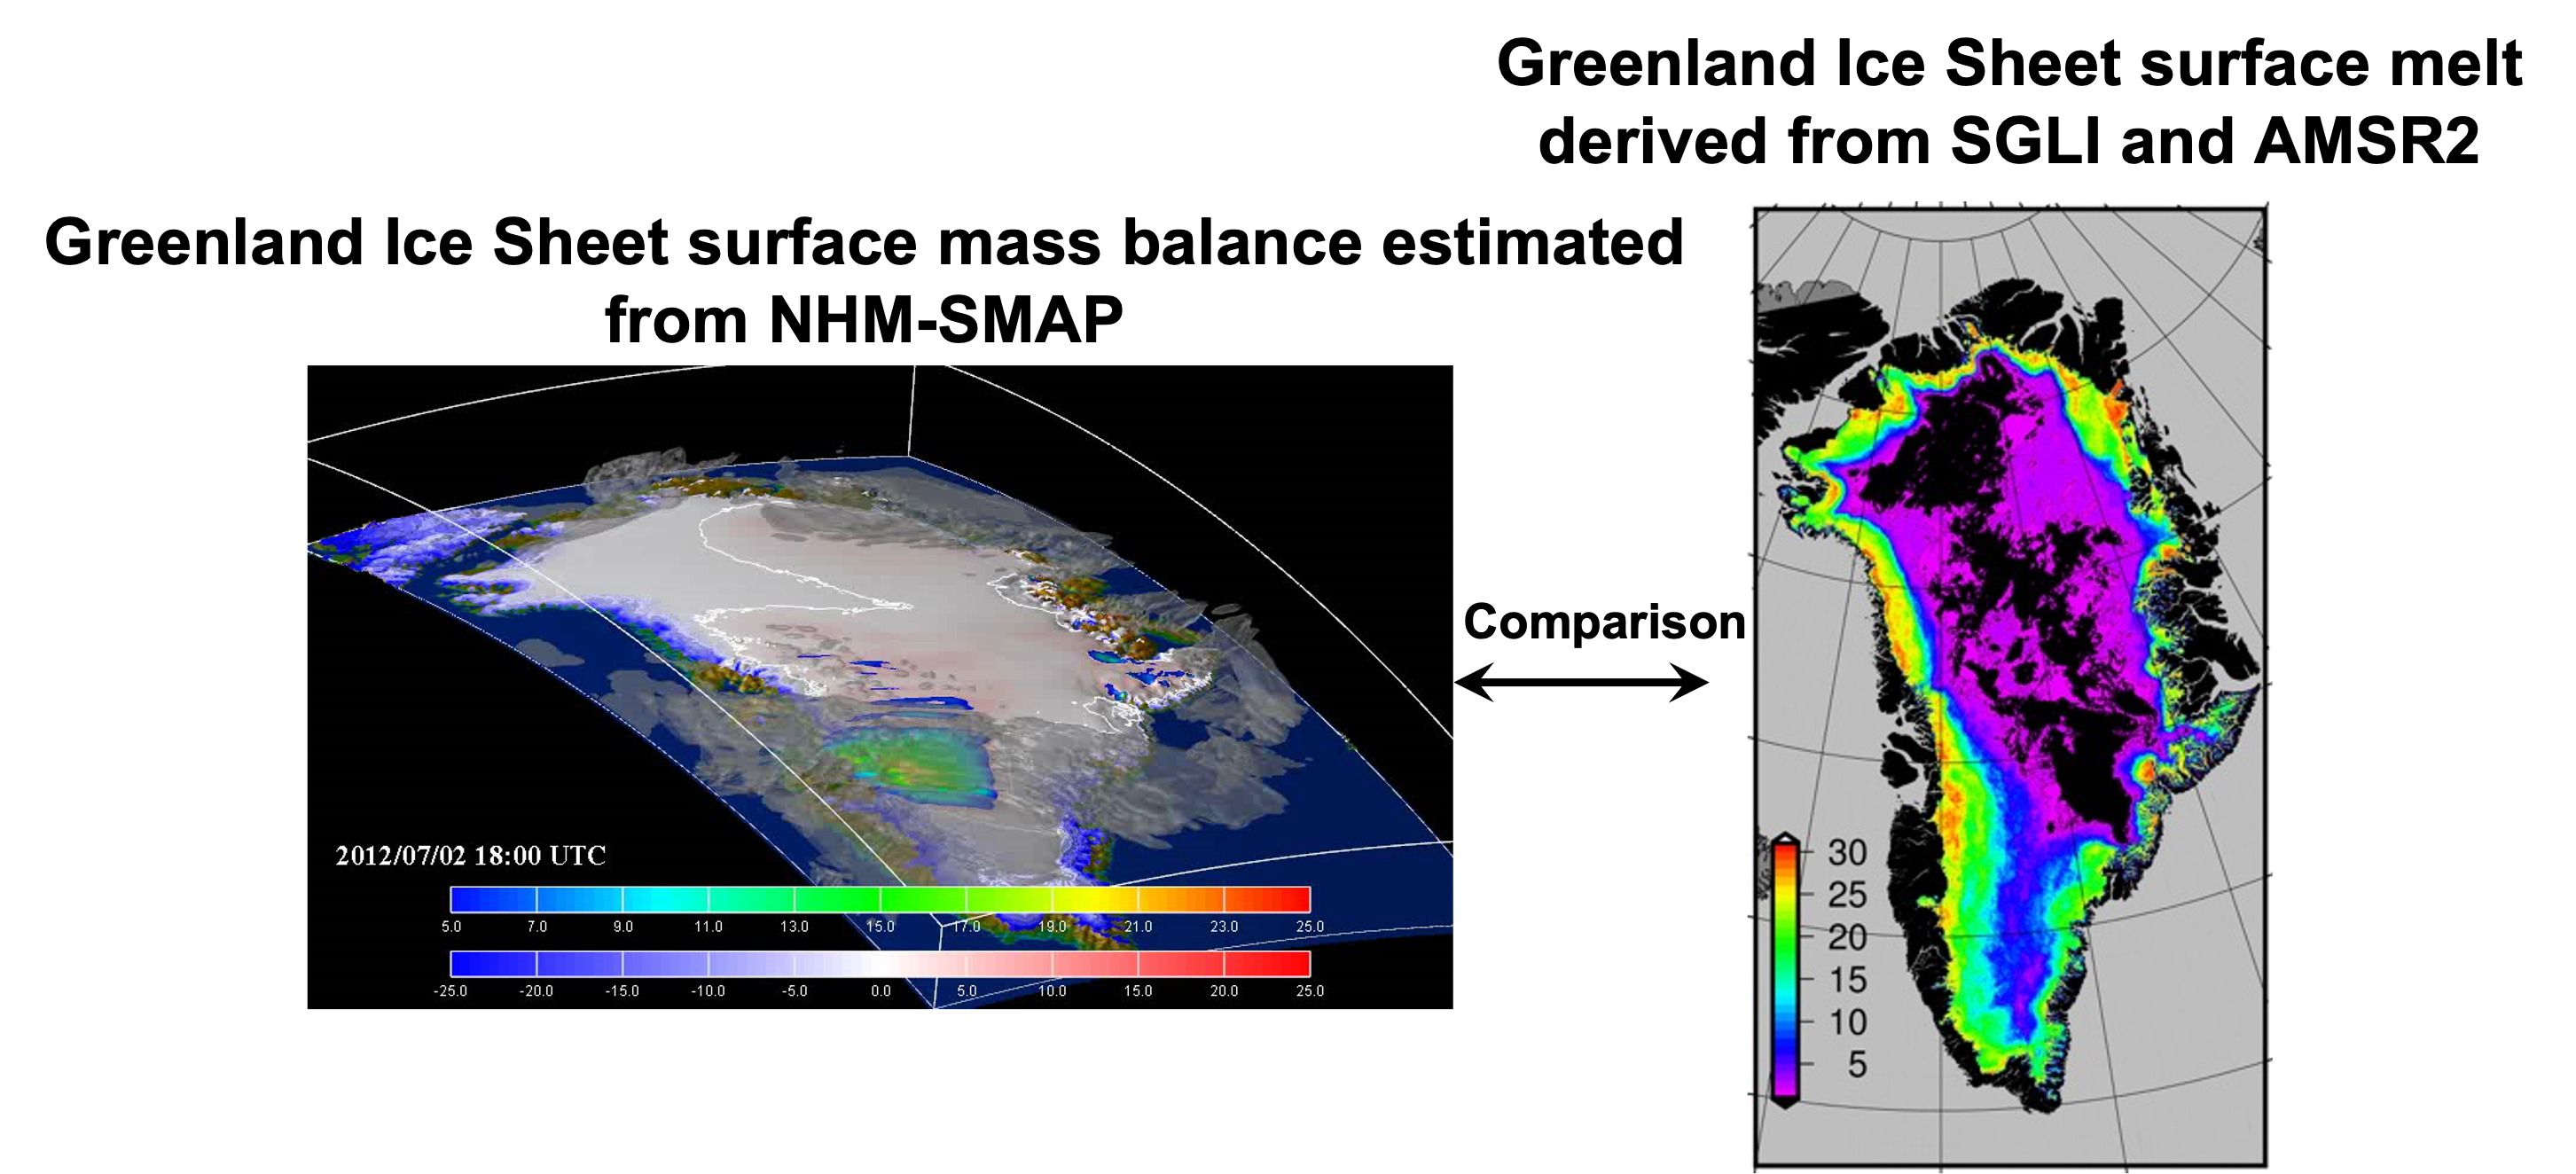
Snow cover distributions and snow/ice surface temperatures obtained from GCOM-C are used not only for analysis of long-term environmental changes, but also for validation of Earth system models. The Japan Agency for Marine-Earth Science and Technology (JAMSTEC) is developing an Earth system model to predict future global warming, and this model uses satellite observation data to validate the degree to which the current climate is reproduced. In particular, snow and ice distribution and surface temperature are important parameters for understanding albedo and snow and ice melting. Therefore, GCOM-C products that can capture detailed snow and ice characteristics are indispensable for improving the accuracy of future global warming projections. Achievements of the GCOM-C project are also used to develop polar regional climate models that are more targeted than Earth system models. “Non-Hydrostatic atmospheric Model and the Snow Metamorphism and Albedo Process model (NHM–SMAP)” is a polar regional climate model, which has been developed to estimate surface mass balance of the GrIS. The model improves estimation accuracy by using realistic ice sheet coverage areas based on long-term satellite data sets. Furthermore, comparative studies are in progress between the ice sheet melting area estimated by NHM-SMAP and the GrIS melting area obtained by multiple satellites such as GCOM-C and GCOM-W (Figure 10).
4. Daily monitoring of Okhotsk sea ice by GCOM-C
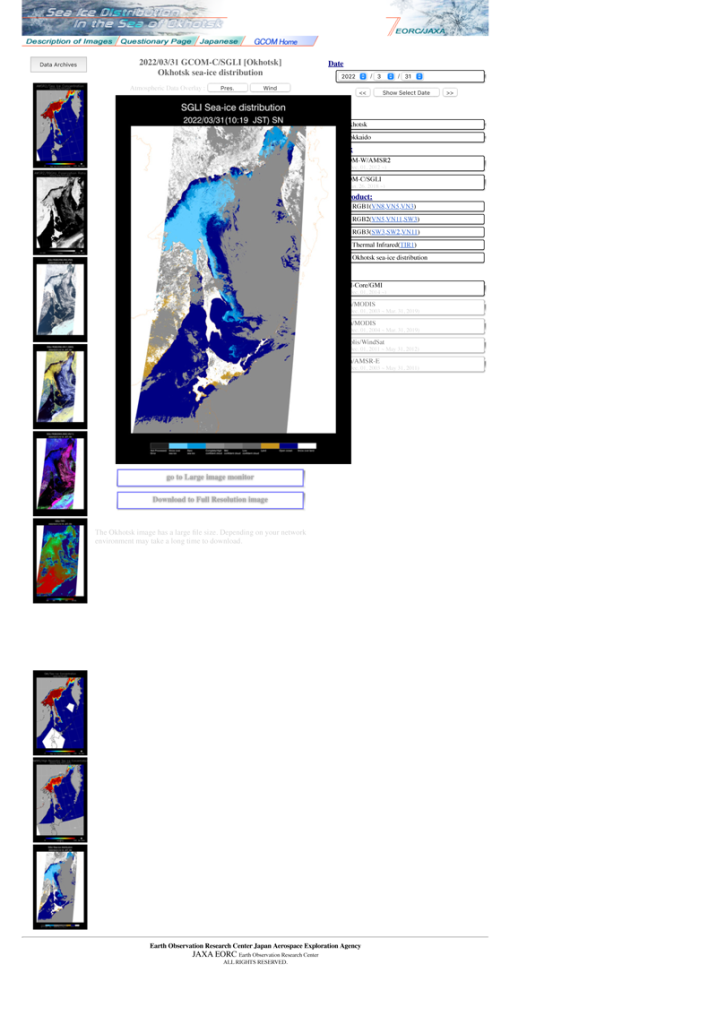
GCOM-C data is effectively used not only for scientific research but also for related organizations. For example, the website “Sea Ice Distribution in the sea of Okhotsk” provides observation images (RGB composite images and Okhotsk sea ice distribution products) taken around the Sea of Okhotsk by GCOM-C. In addition to the GCOM-C product, we release the sea ice concentration product from GCOM-W, which observes microwaves. Whereas the microwave observation can obtain sea ice distribution under the clouds, it has the disadvantage of low spatial resolution. The GCOM-C satellite is affected by clouds, but it has higher spatial resolution than GCOM-W and can observe at multiple wavelengths. Therefore, it is possible to obtain images as seen by human eyes, images highlighting snow and ice by adding infrared information invisible to human eyes and information on snow and sea ice distribution through the surface classification algorithm developed through the GCOM-C project based on information from multi-wavelength observations. By combining these high-resolution, multi-wavelength observations with multiple satellite data, detailed information on daily sea ice distribution can be obtained. These observation data are updated daily and made available on the website during the winter sea ice season (Figure 11). The data are utilized for “Sea ice condition chart” released by the Ice information center of the Japan Coast Guard and are fundamental information for safe vessel navigation.
5. Summary
In global climate change, fluctuations in the cryosphere are quickly emerging in the form of loss and melting of snow and ice. Wide range and continuous observation by satellites is very effective and important for monitoring fluctuations in the rapidly changing cryosphere. Over the past 40 years, continuous observations by optical sensors have enabled us to capture changes over a relatively long-time scale of climate change. On the other hand, some targets, such as the GrIS, have been fluctuating in recent years. Compared to the medium-resolution optical sensors such as AVHRR and MODIS that have been widely used so far, GCOM-C has greatly improved spatial resolution, and it enables to perform detailed analysis. Therefore, we look forward to continuing to perform detailed regional analysis by connecting GCOM-C observation data to existing data sets. Furthermore, from a climatological perspective, it is essential to create a homogeneous data set of 30-year, defined as a normal year, which cannot be covered by continuous observation of a single sensor alone. In particular, for building a data set that includes recent rapid changes in the cryosphere, we hope that the current GCOM-C will be the core satellite, and that its successor mission will acquire reliable data and build a long-term data set.
Search by Year
Search by Categories


Tags
-
#Earthquake
-
#Land
-
#Satellite Data
-
#Aerosol
-
#Public Health
-
#GCOM-C
-
#Sea
-
#Atmosphere
-
#Ice
-
#Today's Earth
-
#Flood
-
#Water Cycle
-
#AW3D
-
#G-Portal
-
#EarthCARE
-
#Volcano
-
#Agriculture
-
#Himawari
-
#GHG
-
#GPM
-
#GOSAT
-
#Simulation
-
#GCOM-W
-
#Drought
-
#Fire
-
#Forest
-
#Cooperation
-
#Precipitation
-
#Typhoon
-
#DPR
-
#NEXRA
-
#ALOS
-
#GSMaP
-
#Climate Change
-
#Carbon Cycle
-
#API
-
#Humanities Sociology
-
#AMSR
-
#Land Use Land Cover
-
#Environmental issues
-
#Quick Report
-
#GOSAT-GW
Related Resources


Related Tags
Research and Development Related Articles
-
 Research and Development 2026.03.09 Mon High-Resolution Predictions of Global Terrestrial Water Cycle:
Today’s Earth – Global Updated -
 Research and Development 2025.06.18 Wed Advancing Space-Based Weather Analysis and Forecasting – Renewal of JAXA’s Realtime Weather Watch ‘NEXRA3’ and Performance Evaluation with the previous system (Overview Article)
 -
 Research and Development 2025.03.27 Thu Launch of Ocean Weather Forecasts 1km resolution
 -
 Research and Development 2024.05.27 Mon The Use of Earth Observation Satellite Data in the Humanities and Social Sciences (3)
Stay Connected
