


Research and Development
2022.07.11 Mon
“SHIKISAI” (GCOM-C) marks the fifth year since its successful launch: Achievements in ocean environment
Contents:
1. Introduction
2. Long-term and continuous monitoring for ocean environment by GCOM-C
3. Application of GCOM-C oceanographic observation data in fisheries
4. Observation of various oceanographic phenomena using GCOM-C/SGLI 250 m resolution
ⅰ) Floating Algae
ⅱ) Pumice stones
ⅲ) Red tide
5. Summary
1. Introduction
The Oceans plays an important role in the global heat, water, and carbon cycle including interaction with the atmosphere. However, recently, climate change has caused many problems such as ocean warming, expansion of marine pollution, depletion of fishery resources, biodiversity decreases etc. In order to contribute to assessing the current status of these problems, determining their causes, mitigating the damages, and resolving the issues, GCOM-C/SGLI is conducting global observation for sea surface temperature (SST) and Phytoplankton levels with wide range at high frequency. In the process, SGLI captures reflected sunlight (ocean color) under water using a sensor that can observe a wide range of wavelengths from near-ultraviolet and visible to thermal infrared. GCOM-C/SGLI 250m resolution is expected to contribute to the conservation by monitoring, especially, in coastal areas with large population where land, ocean, and atmosphere are complexly interconnected. GCOM-C high spatial resolution is expected to be able to observe ocean phenomena on smaller scales that have been difficult to do with previous sensors.
In this article, we introduce the achievements and future prospects of GCOM-C in ocean observations over four years after its launch.
> Link to the article about atmosphere, land, and snow and ice observations <
2. Long-term and continuous monitoring for ocean environment by GCOM-C
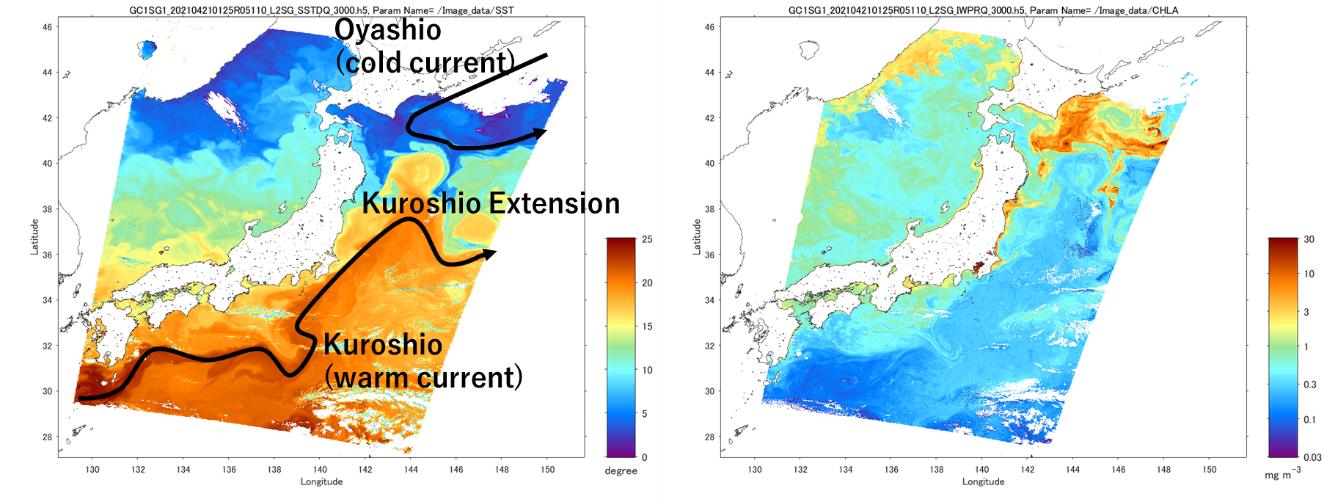
JAXA/EORC provides GCOM-C ocean products such as Sea Surface Temperature; Chlorophyll-a concentration, an indicator of phytoplankton biomass; total suspended matter concentration, an indicator of turbidity; normalized water leaving radiance for each wavelength, which represents ocean color; photosynthetically active radiation, which corresponds to amount of solar radiation; and absorption coefficient of colored dissolved organic matter, which is also an indicator of salinity. For example, Figure 1 shows that the distribution of SST (left) and chlorophyll-a concentration (right) corresponds to the Kuroshio large meander. For monitoring ocean environmental changes associated with climate change, one of the objectives of GCOM-C, it is extremely important to observe ocean environment constantly and grasp its change. Further research outcomes from long-term observations are expected through ongoing validation and improvement on these products.
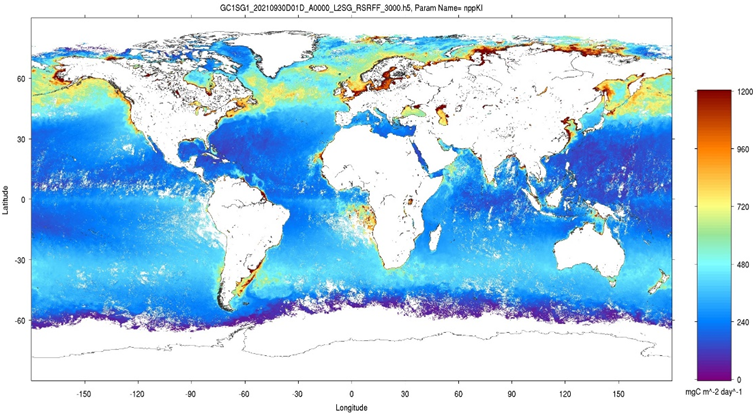
The GCOM-C mission is also developing a method to estimate the amount of carbon that can be fixed (produced) by Phytoplankton as organic matter through photosynthesis (=ocean net primary productivity) (Figure 2). Ocean net primary productivity is critically important parameter to promote better understanding on carbon cycle, as well as primary production by land plants. We are working on more accurate estimation by developing the algorithm that includes type of phytoplankton not considered in previous one.
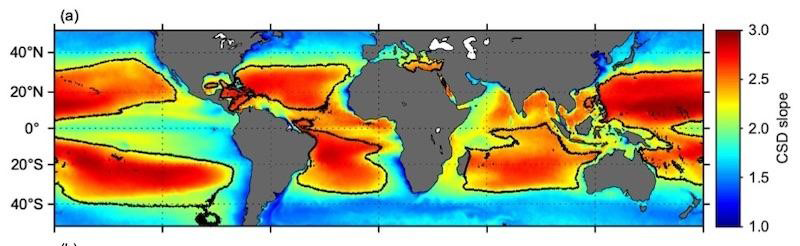
Furthermore, the GCOM-C mission is developing a classification method based on the ecological function of phytoplankton (phytoplankton functional classification) (Figure 3). It is widely known that there are about 5,000 species of phytoplankton in the oceans. Their size and role in the ecosystem (e.g., position in the food chain) vary widely. In recent years, ecosystem models that incorporate the characteristic roles of phytoplankton based on such functional classifications, not just as a single species, have been developed. This effort will enhance our understanding on the role of phytoplankton in the Earth’s material cycle. However, the increased uncertainty associated with the model complexity is a serious issue. To validate and improve the numerical model, regular global observations of phytoplankton functional classification using satellite imagery will play an important role. High-resolution observations by GCOM-C are expected to provide invaluable information for the validation of numerical models, which will improve higher resolution with the development of hardware.
Research and development of these new ocean products and the construction of long-term data sets based on continuous satellite observations will enable us to understand the carbon cycle and fishery production, as well as contribute to future projections of climate change.
3. Application of GCOM-C oceanographic observation data in fisheries
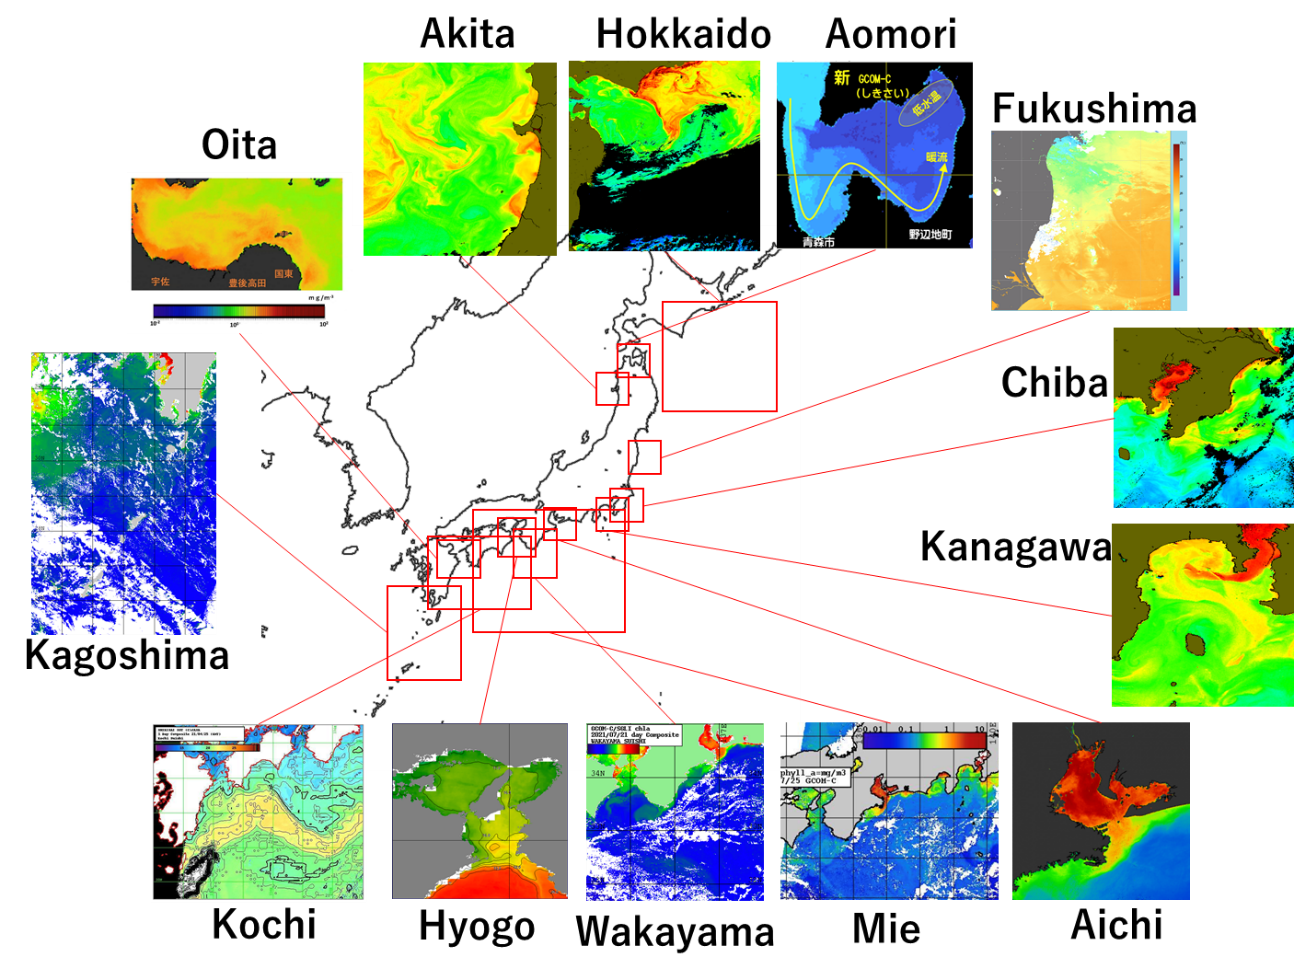
The GCOM-C ocean products including SST and chlorophyll-a concentration are utilized and released as oceanographic information at the fisheries experiment stations, which are Fisheries Agency operated by local governments in Japan (Figure 4). The detailed information on oceanic conditions in coastal areas utilizing the excellent spatial resolution of GCOM-C is leveraged by fishery operators in each region to search for fishing grounds and select shipping routes.
4. Observation of various oceanographic phenomena using GCOM-C/SGLI 250m resolution
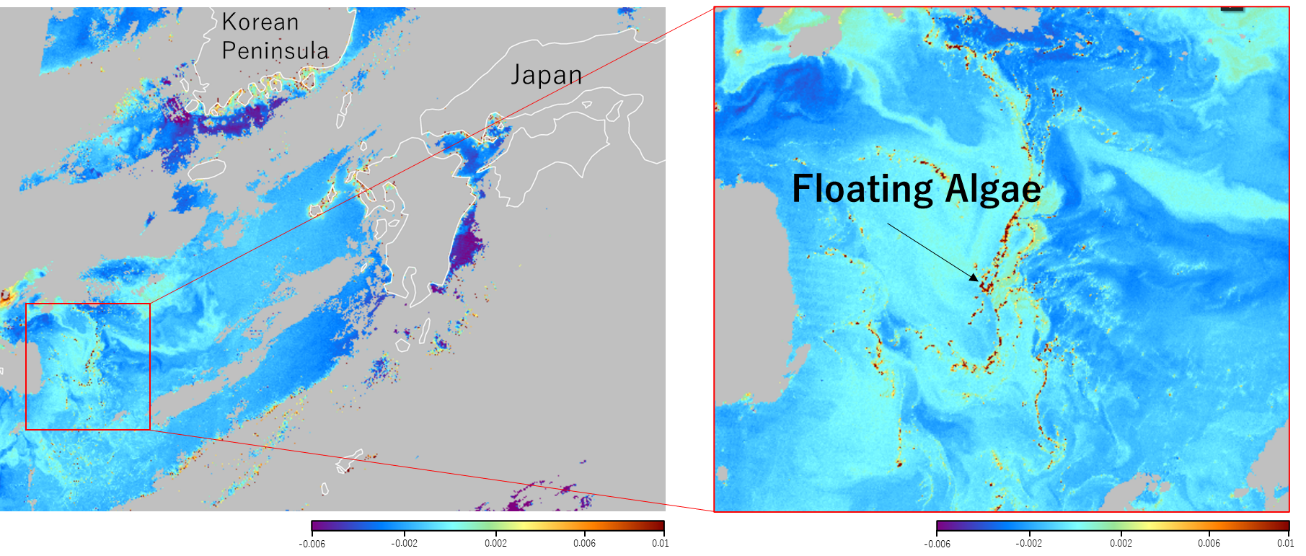
ⅰ) Floating Algae
“Floating algae” is a type of floating seaweed, sargasso, that grows large in spring and is torn off by waves and drifting on the sea surface. It plays an important role in marine ecosystems, serving as spawning sites for fish and as hiding places and feeding grounds for juvenile fish. In recent years, an increase of floating algae has been suggested in the East China Sea due to environmental changes such as the expansion of seaweed cultivation and the rise in seawater temperature. It is expected to clarify the relevance between these changes by continuous observation of floating algae using GCOM-C.
Figure 5 is one example of capturing floating algae in the East China Sea based on “Floating Algae Index (FAI)”. FAI is calculated by using three wavelengths: red, near-infrared, and short-wavelength infrared. Since the distribution of floating algae change a lot both temporally and spatially, real-time monitoring of their distribution through high-resolution and high-frequency observations by GCOM-C is expected to make a significant contribution to the aquaculture industry.
ⅱ) Pumice stones
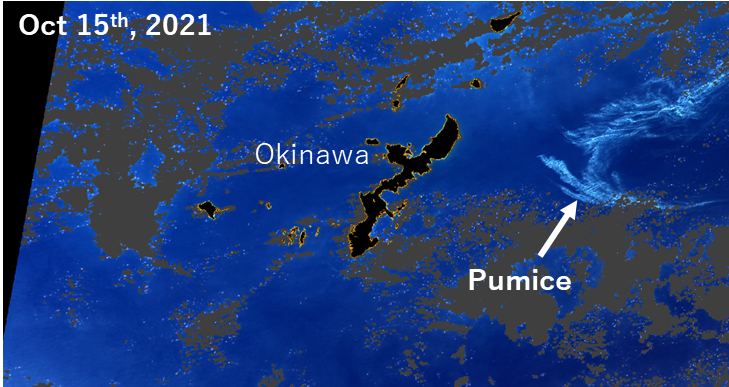
An eruption occurred at Fukutoku-Oka-no-Ba submarine volcano, south of the Ogasawara Islands on August 13, 2021, producing a massive amount of pumice stones. The stones have drifted on the ocean and then reached to Okinawa, located more than 1,400 km away from the volcano. They caused various damages on ship navigation, fishing, and tourism.
JAXA/EORC has been releasing images of pumice stone decipherment by GCOM-C. We enhanced contrast by applying short-wavelength infrared light (1.6 μm), near-infrared light (870 nm), and red light (670 nm) to the three primary colors (red, green, and blue), respectively. Figure 6 shows the result of pumice stone decipherment on October 15, 2021. The light blue areas in the figure indicate the distribution of pumice stones.
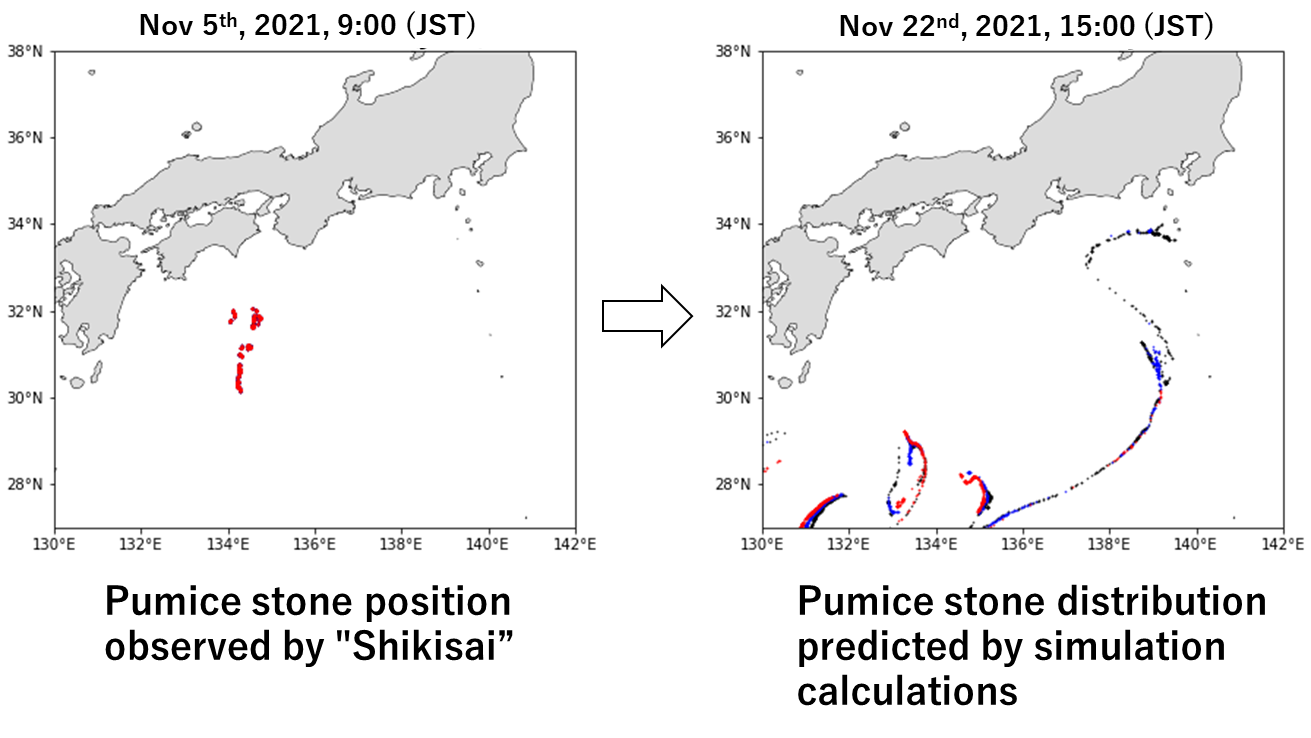
Furthermore, in order to capture where the pumice came from and predict the future pumice location, we tried to identify the drifting routes by combining the results of pumice stone decipherment using GCOM-C with the ocean model (JCOPE-T DA) developed and operated by JAMSTEC (Japan Agency for Marine-Earth Science and Technology). It is difficult to predict long-term like several months pumice drift based on ocean current simulation alone. Therefore, as shown in figure 7 and figure 8, we performed drifting calculations in combination with the actual pumice distribution captured by GCOM-C, which makes it possible to obtain the result of drifting calculations closer to reality.
Based on this drift prediction, it was determined beforehand that Kozushima Port and Mikurajima Port in the Izu Island chain could be significantly suffered from pumice stones. The measure was taken to install oil fences ahead of other island ports. As a result, this measure reduced the damage from pumice stones that drifted ashore three days later.

ⅲ) Red tide
In coastal areas, certain types of phytoplankton can bloom abnormally in seawater and cause red tide, a phenomenon that colors seawater. Red tides can lead extensive fisheries damage, including the sudden death of fish in aquaculture farms and the consumption of nutrients needed for laver culture. Therefore, elucidation of the mechanism of red tide outbreaks and accurate capturing of its distribution are required.
GCOM-C is capable of monitoring red tide in detail at coastal areas including the Ariake Bay and the Pacific coasts of eastern Hokkaido by utilizing its excellent spatial resolution of 250 m. Hence, GCOM-C greatly contributes to coastal environment monitoring and conservation.
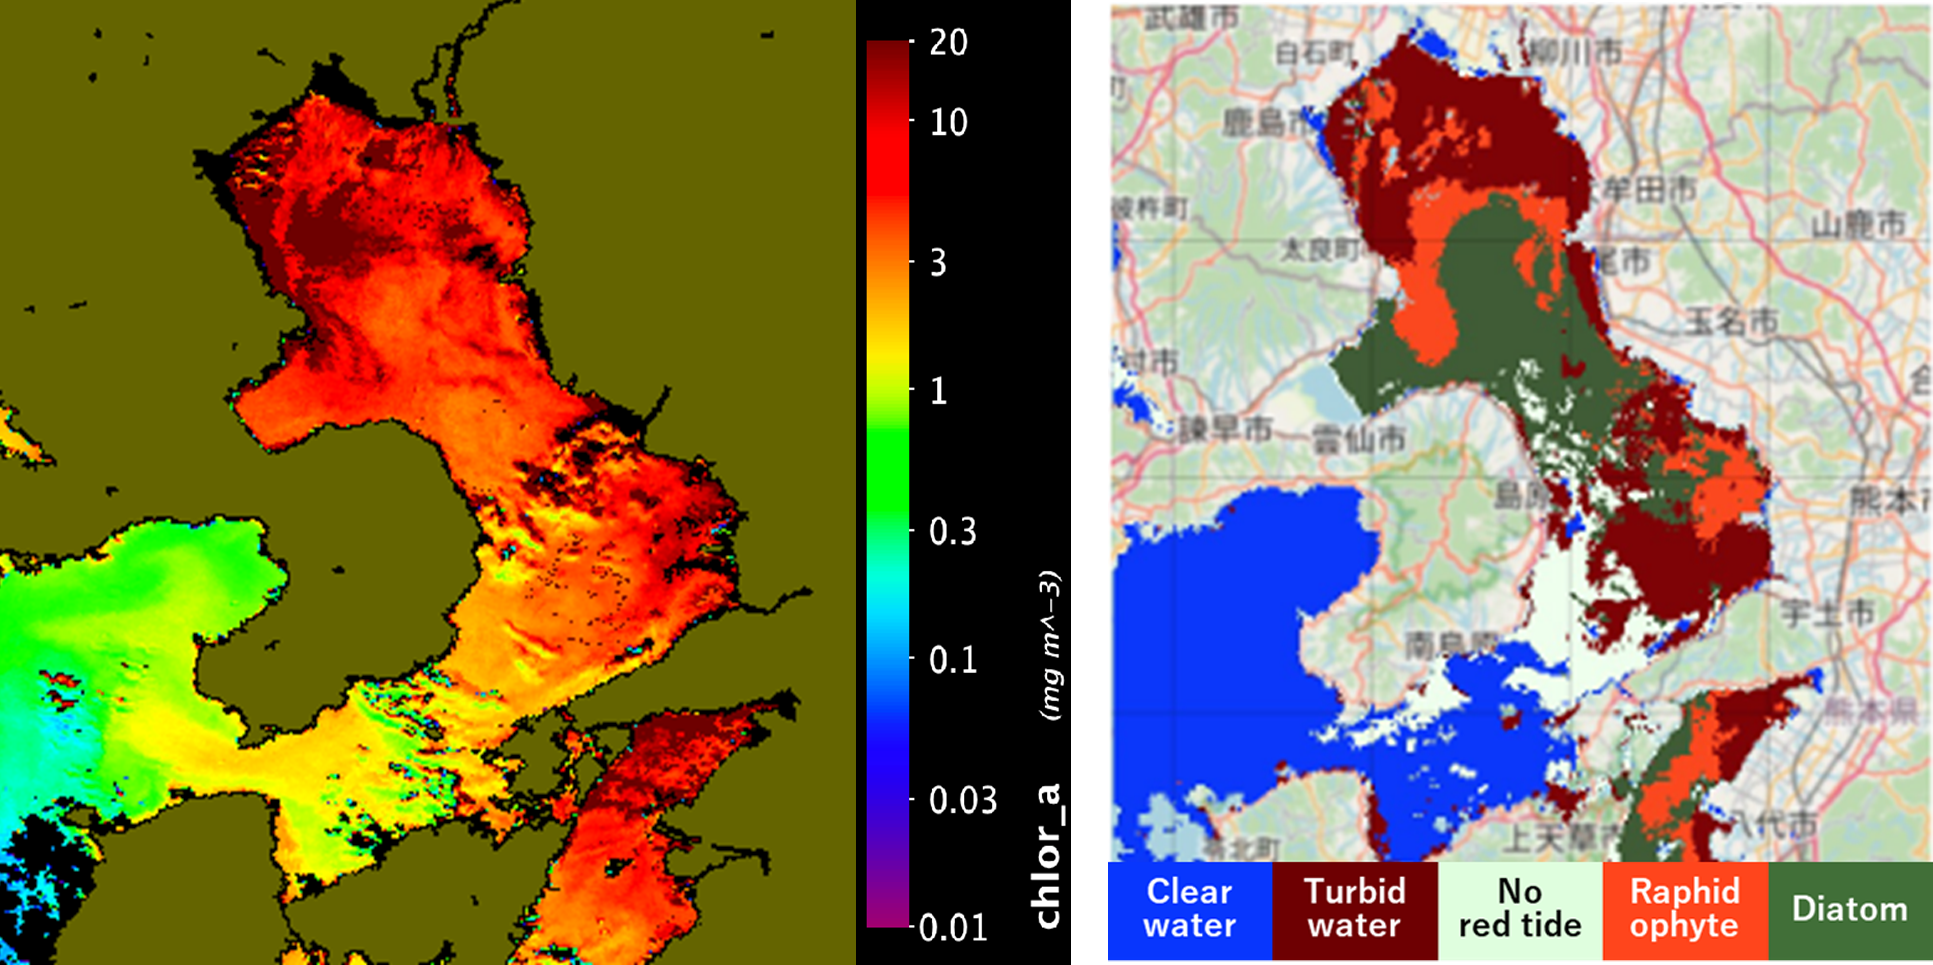
- Red tide monitor in the Ariake Bay
JAXA and JAFIC (Japan Fisheries Information Service Center) is collaborating to develop a red tide monitoring system in the Ariake Bay (Figure 9). Based on the observation results from GCOM-C and Himawari-8, the red tide monitoring system estimates the spatial coverage of red tide in the bay. The estimation results are available to the public on the website operated by JAFIC, and the utilization of GCOM-C in the field of fisheries is being promoted.
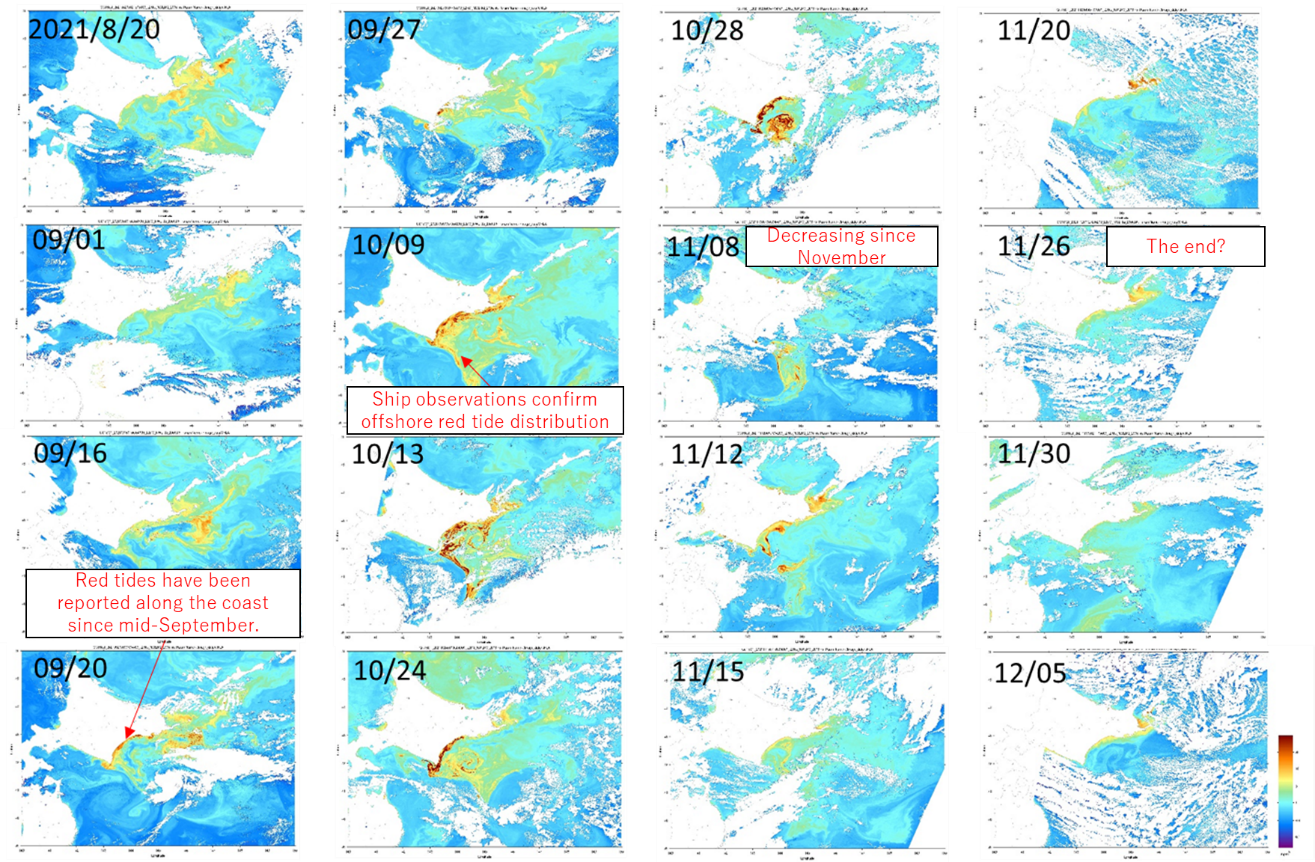
- Monitoring red tide changes off the Pacific coasts of eastern Hokkaido
An exceptional and widespread red tide occurred off the east coast of Hokkaido from September to November in 2021. Figure 10 shows the shift of the red tide from its onset to the end observed by GCOM-C with high resolution and high frequency. The GCOM-C images of Chlorophyll-a concentration capturing the red tide off the east coast of Hokkaido were utilized on NHK Hokkaido news, the press release from Hokkaido University, and the web site of Hokkaido Research Organization (HRO), Fisheries Research Department, Central Fisheries Research Institute. In the future, we look forward to continuous detailed monitoring of red tides in combination with in-situ observation data by research institutes and universities, as well as ocean environmental data from other satellites.
5. Summary
GCOM-C is conducting observations to monitor long-term ocean environmental change associated with climate change and is making significant contributions to monitoring carbon cycles, ecosystem processes and fluctuations in fishery resources.
Detailed analysis of oceanographic phenomena with relatively small spatiotemporal variations, such as understanding the spatial distribution of red tides in coastal areas and elucidating their outbreak mechanisms, has been difficult with previous ocean color satellite observations. However, by taking advantage of the GCOM-C’s excellent resolution of 250 m, such analysis and research to mitigate damage to fisheries are also being vigorously advanced.
Long-term ocean observations by GCOM-C are expected to contribute to the elucidation of the correlation between ocean fluctuations and climate change, as well as the mechanisms that cause such fluctuations. We also hope to make further contributions not only to the field of climate change, but also to the field of fisheries thorough providing information on oceanic conditions related to fishing ground search and shipping route selection.
Writings: JAXA/EORC, Taiga Nakayama (Researcher)
Search by Year
Search by Categories


Tags
-
#Earthquake
-
#Land
-
#Satellite Data
-
#Aerosol
-
#Public Health
-
#GCOM-C
-
#Sea
-
#Atmosphere
-
#Ice
-
#Today's Earth
-
#Flood
-
#Water Cycle
-
#AW3D
-
#G-Portal
-
#EarthCARE
-
#Volcano
-
#Agriculture
-
#Himawari
-
#GHG
-
#GPM
-
#GOSAT
-
#Simulation
-
#GCOM-W
-
#Drought
-
#Fire
-
#Forest
-
#Cooperation
-
#Precipitation
-
#Typhoon
-
#DPR
-
#NEXRA
-
#ALOS
-
#GSMaP
-
#Climate Change
-
#Carbon Cycle
-
#API
-
#Humanities Sociology
-
#AMSR
-
#Land Use Land Cover
-
#Environmental issues
-
#Quick Report
-
#GOSAT-GW
Related Resources


Related Tags
Research and Development Related Articles
-
 Research and Development 2026.03.09 Mon High-Resolution Predictions of Global Terrestrial Water Cycle:
Today’s Earth – Global Updated -
 Research and Development 2025.06.18 Wed Advancing Space-Based Weather Analysis and Forecasting – Renewal of JAXA’s Realtime Weather Watch ‘NEXRA3’ and Performance Evaluation with the previous system (Overview Article)
 -
 Research and Development 2025.03.27 Thu Launch of Ocean Weather Forecasts 1km resolution
 -
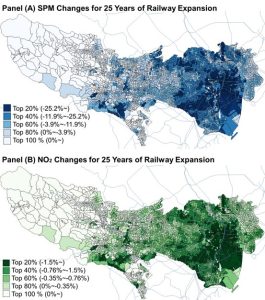 Research and Development 2024.05.27 Mon The Use of Earth Observation Satellite Data in the Humanities and Social Sciences (3)
Stay Connected
