


Research and Development
2022.06.14 Tue
“SHIKISAI” (GCOM-C) marks the fifth year since its successful launch: Achievements in the terrestrial environment
Contents:
1. About Global Change Observation Mission – Climate “SHIKISAI” (GCOM-C)
2. Detecting the essential information for photosynthetic activities estimation in terrestrial vegetation with high accuracy using GCOM-C
3. Monitoring land surface temperature at 250 m resolution
4. Challenges in estimating above-ground biomass (AGB) using the optical sensor
5. Acquiring in-situ ecological validation data on a large scale
6. Monitoring active volcanoes
7. Expectations for monitoring environmental changes by long-term observation
1. About Global Change Observation Mission – Climate “SHIKISAI” (GCOM-C)
The Global Change Observation Mission – Climate (GCOM-C), a Japanese nickname is “SHIKISAI,” was launched on an H-IIA rocket from JAXA Tanegashima Space Center in December 2017. “SHIKISAI” means “colorful” in Japanese. As the name implies, it captures the distribution and changes of vegetation, clouds, and “snow and ice” around the world in rich-vibrant colors. The name “SHIKISAI” conjures an image of the visible-light observation; however, the Second generation GLobal Imager (SGLI) onboard GCOM-C observes 19 multi-wavelengths of light, including near-ultraviolet to thermal infrared light. SGLI also observes the multi-directional light. Using such GCOM-C observation data, we can obtain valuable information regarding radiation, heat budget, and the carbon cycle.
This article, one of the series articles (see the articles here), introduces the GCOM-C’s fifth-year achievements and prospects in the terrestrial environment. GCOM-C land products are mainly followings: terrestrial ecological products (vegetation index (VI), above-ground biomass (AGB), leaf area index (LAI), etc.) based on multi-wavelength and multi-directional observations, and surface temperature products based on thermal infrared observations with a high spatial resolution (250 m resolution). GCOM-C terrestrial research group is working on monitoring the current state of the terrestrial environment with high accuracy, hoping to clarify the climate change mechanisms using GCOM-C data. The following sections introduce our efforts regarding terrestrial ecological products, active volcano monitoring, etc. Now that four-year observation data have been obtained from GCOM-C, the basis for clarifying the climate change mechanisms is finally in place.
> Link to the article about land, ocean, and snow and ice observations <
2. Detecting the essential information for photosynthetic activities estimation in terrestrial vegetation with high accuracy using GCOM-C
Global warming occurs when atmospheric concentrations of greenhouse gases, mainly carbon dioxide, increase. Since plants store carbon while absorbing carbon dioxide and generating oxygen during photosynthesis, it is crucially important to capture “the photosynthetic activity” on a global scale. GCOM-C observes nearly the entire globe in just two days and detects the essential information to estimate global photosynthesis in a timely way.
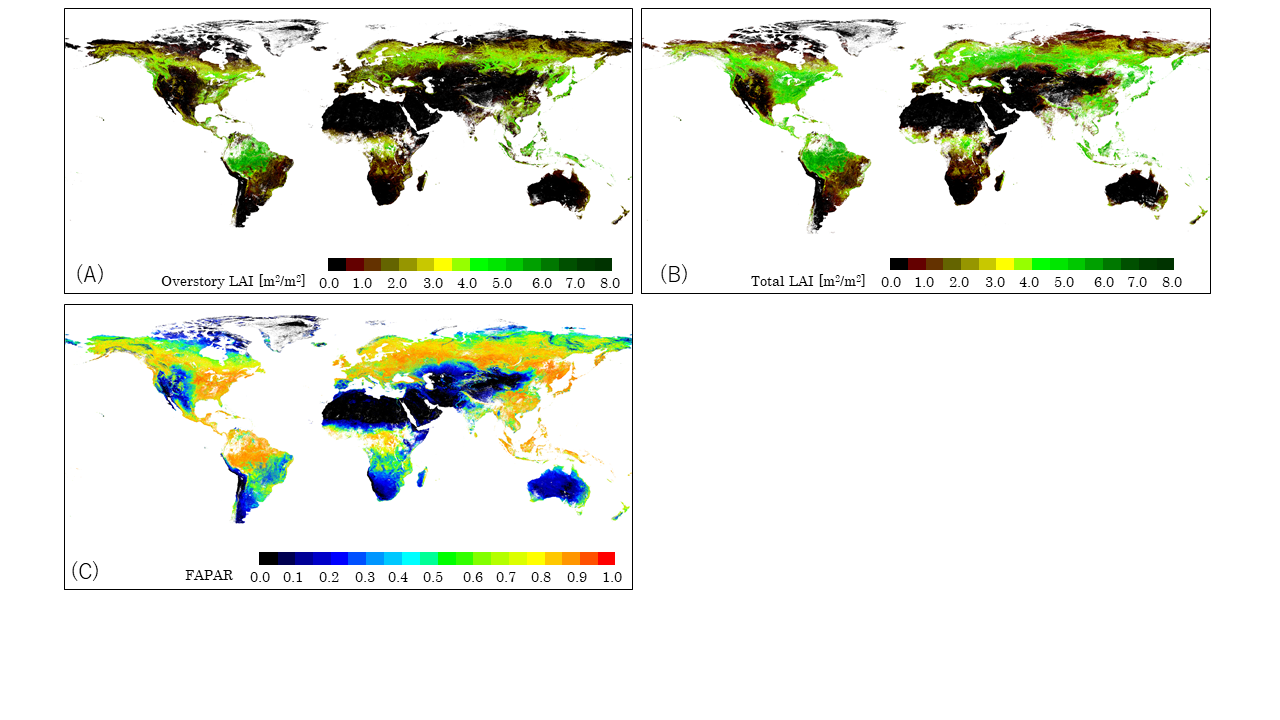
In order to estimate the amount of photosynthesis, it is important to estimate how much light, Photosynthetically Active Radiation (PAR), plants absorb. Using the Forest Light Environmental Simulator (FLiES), GCOM-C estimates the Fraction of Absorbed Photosynthetically Active Radiation (FAPAR) of terrestrial vegetation and the Leaf Area Index (LAI, green leaf area per unit ground surface area), related to photosynthetic capacity (Figure 1). The feature of the GCOM-C LAI product is to estimate the LAI in two layers (canopy and understory vegetation). Existing satellite sensor products (e.g., MODIS) estimate LAI in one layer (that is, all terrestrial vegetation from the ground surface). However, canopy and understory vegetations differ in seasonal changes in photosynthesis, etc., so understanding each LAI can help improve the accuracy of terrestrial ecosystem models and contribute to ecosystem research.
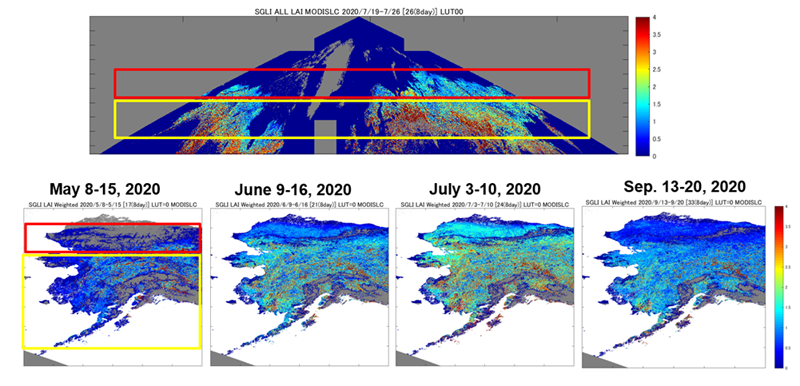
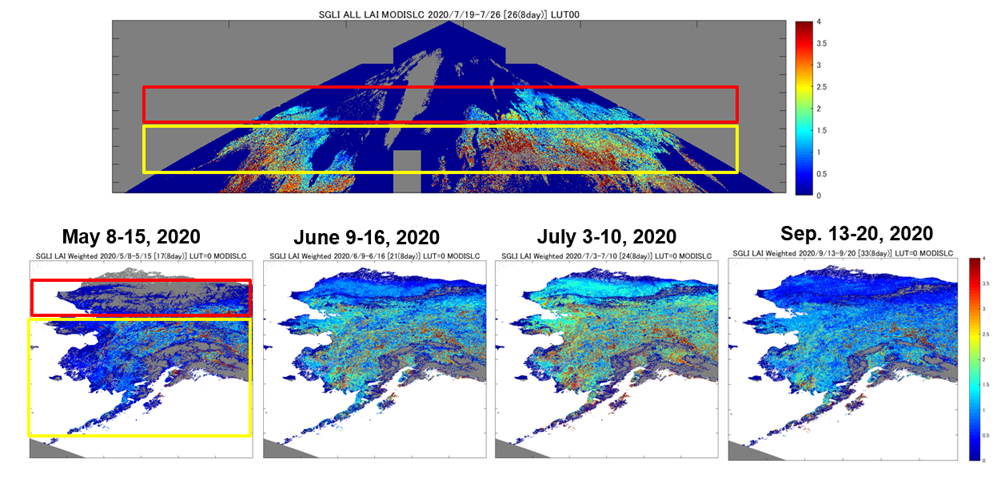
To estimate LAI with high accuracy, we continue to improve the model (e.g., improving the virtual forest used in FLiES). FLiESvox, the improved model of FLiES, can estimate the seasonal changes in LAI changes of the vegetation in the tundra area (in the red frame in Figure 2) and the coniferous forest in the subarctic region (in the yellow frame in Fig. 2), which are mostly distributed in the high latitudes of the Northern Hemisphere (Fig. 2).
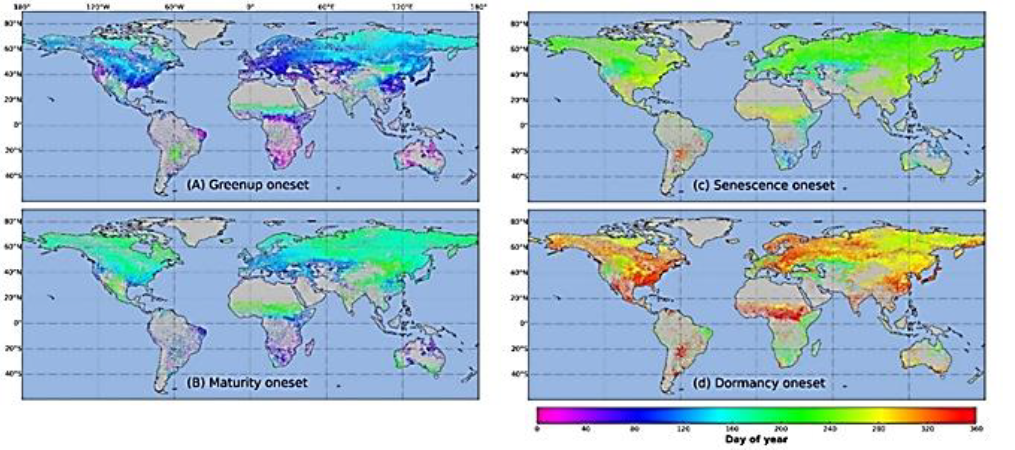
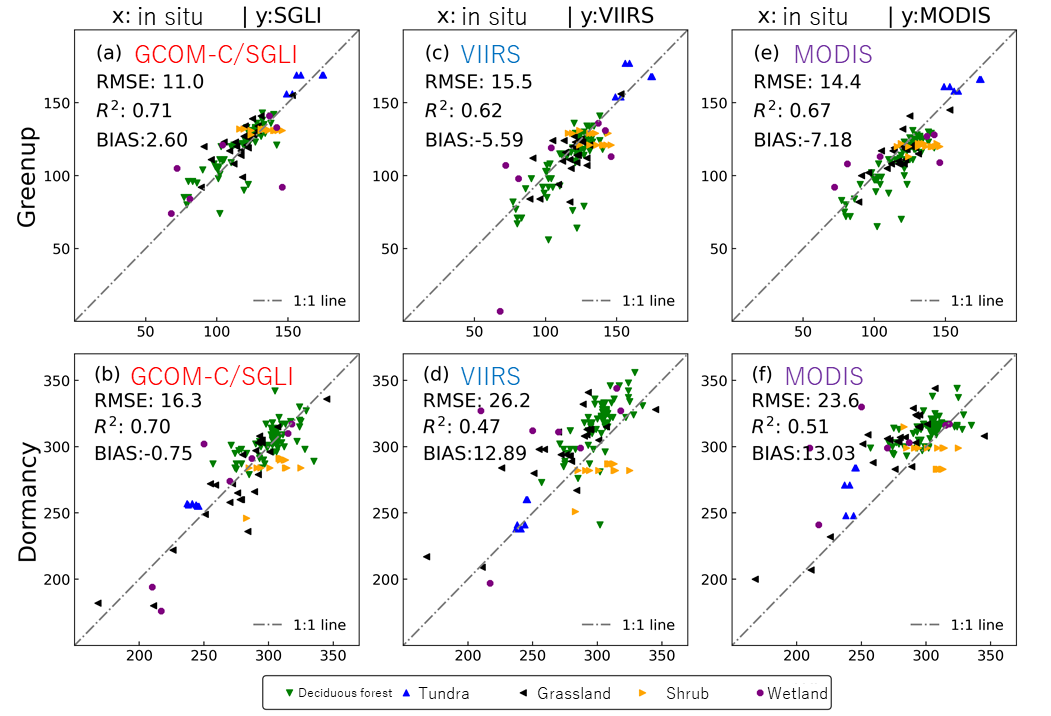
In order to estimate the amount of photosynthesis, it is also important to capture the period of photosynthetic activity. GCOM-C detects global plant phenology (i.e., the dates of leaf expansion, leaf fall, etc.) with high accuracy (Figure 3). In particular, GCOM-C detects the leaf-fall date with the highest accuracy among moderate-resolution satellite sensors (Figure 4). The plant phenology must change depending on extreme weather events and global warming. Therefore, it is necessary to continue the monitoring in the long term.
3. Monitoring land surface temperature at 250 m resolution
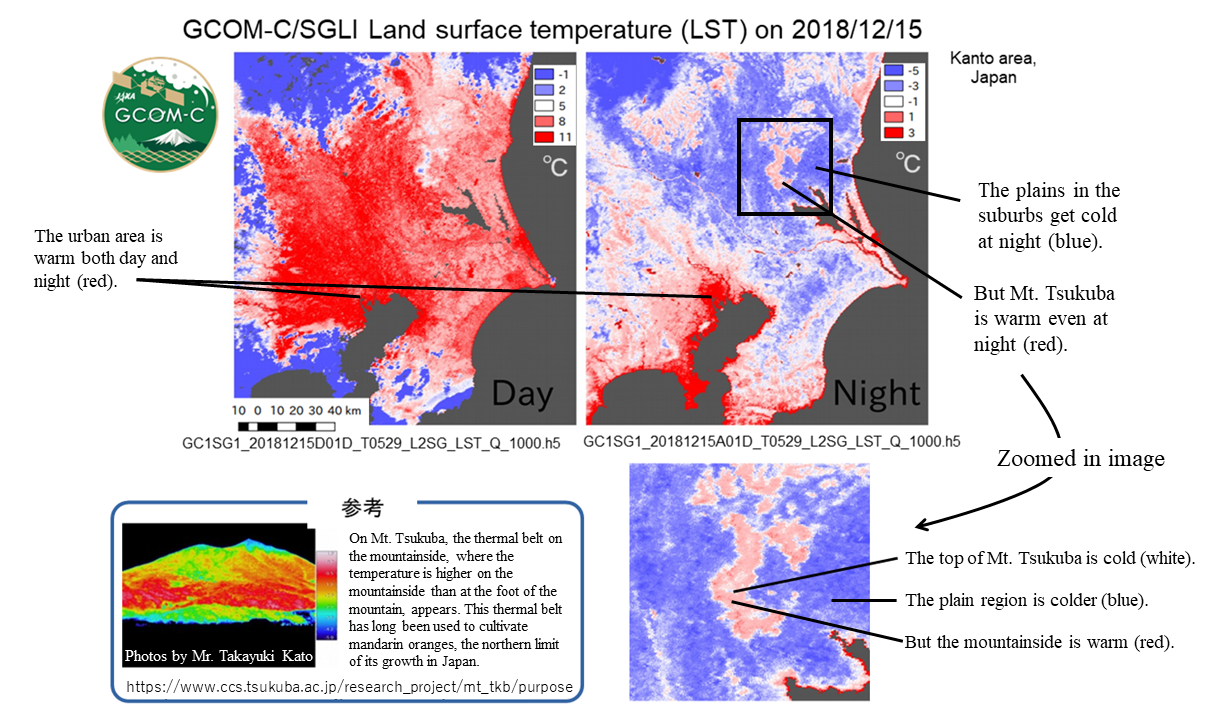
One of the GCOM-C features is to obtain land surface temperature (LST) with high resolution (250 m resolution), which enables us to detect even local phenomena such as the thermal belt on the slope of Mt. Tsukuba in Japan (Figure 5): In the daytime (upper left in Figure 5), the land surface temperature is lowest at the top of the mountain and higher at the foot depending on the elevation. In contrast, at night (the upper right figure), the temperature is higher at the mountainside than at the top and even at the foot of the mountain. Such a high-temperature area is called the thermal belt, caused by the specific physiographic feature that Mt. Tsukuba is an independent peak facing the Kanto Plain.
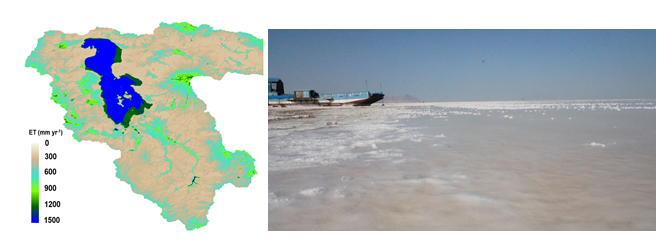
The GCOM-C LST depending on soil moisture content and plant water stress, with a high spatiotemporal resolution, can contribute to the effective and sustainable management of water resources, which might be threatened by future population growth and climate change. For example, at the Urmia Lake Basin in Iran, which faces existential difficulty, estimating evapotranspiration (ET) is crucial because water resource in a closed basin is determined by the balance of precipitation and ET (Figure 6). In Figure 6, ET was estimated using the GCOM-C LST and its behavior: LST is cooler in the water area and warmer in the non-water area (dry ground).
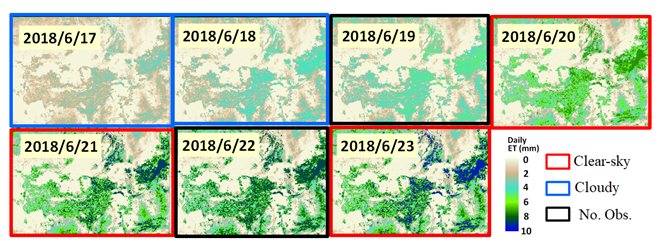
GCOM-C LST with a high spatiotemporal resolution enables us to estimate daily ET in each farm parcel (except for a smaller parcel than GCOM-C resolution) because of the increased frequency of usable clear day’s data. For example, the time series of ET estimated from GCOM-C LST enables us to monitor the irrigation condition without introducing expensive observation equipment in the field in each parcel of farm field in the western USA (Figure 7): High ET implies that irrigation is working effectively.
4. Challenges in estimating above-ground biomass (AGB) using the optical sensor
For global warming studies, it is important to estimate the amount of carbon storage in vegetation by photosynthesis (i.e., biomass) from satellites. Especially, trees play a great role in the storage of carbon in the long term because trees have a large volume and a long lifespan. Accordingly, estimating the distribution of above-ground biomass (AGB) and its amount is highly important for carbon cycle studies. Also, it is important to detect the variation of AGB because the emission of carbon stored in trees into the atmosphere, caused by deforestation, forest fires, etc., significantly impacts the carbon cycle.
The data of active sensors (such as satellite lidar and synthetic aperture radar [SAR]), which emit beams and detect the reflection from the earth’s surface, are generally used for the large-scale AGB estimation. Specifically, AGB is estimated from canopy heights acquired from the time lag between the reflected signals from the top of the tree and the ground surface.
GCOM-C onboard an optical (passive) sensor, which observes natural light reflected or emitted from the ground surface. A passive sensor is considered unsuitable for estimating accurate AGB because it has difficulty detecting tree heights (or canopy heights), which is important for AGB estimation. However, GCOM-C multi-directional observation made it possible to estimate accurate AGB by obtaining the vegetation-layer thickness, vegetation density, and vegetation coverage.
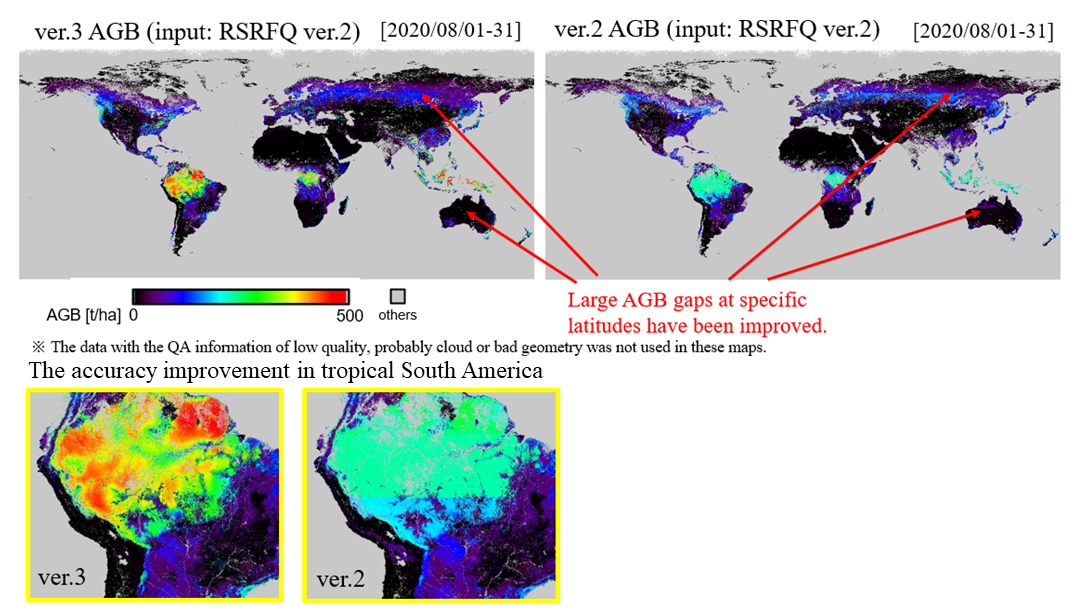
A problem with GCOM-C/SGLI AGB product version 2 (old algorithm) was the underestimation in the tropical region where large AGB exists. This fact was attributable to the rarely available in-situ data in this region. To overcome this problem, we applied the data of Global Ecosystem Dynamics Investigation (GEDI, lidar on board the International Space Station [ISS] by NASA) to the AGB estimation algorithm for the Multi-footprint Observation LIDAR and Imager (MOLI, planning to be installed on ISS by JAXA). Thus, we acquired much AGB data (instead of in-situ data). By adding those data, we achieved a high AGB estimation in the new algorithm for the GCOM-C/SGLI product (version 3) (Figure 8). The AGB estimation using satellite lidar and SAR tends to be saturated at over 150 t/ha. In contrast, GCOM-C AGB is not saturated up to 500 t/ha. Global AGB estimation with high accuracy using GCOM-C is expected to contribute to the carbon cycle research greatly.
5. Acquiring in-situ ecological validation data on a large scale
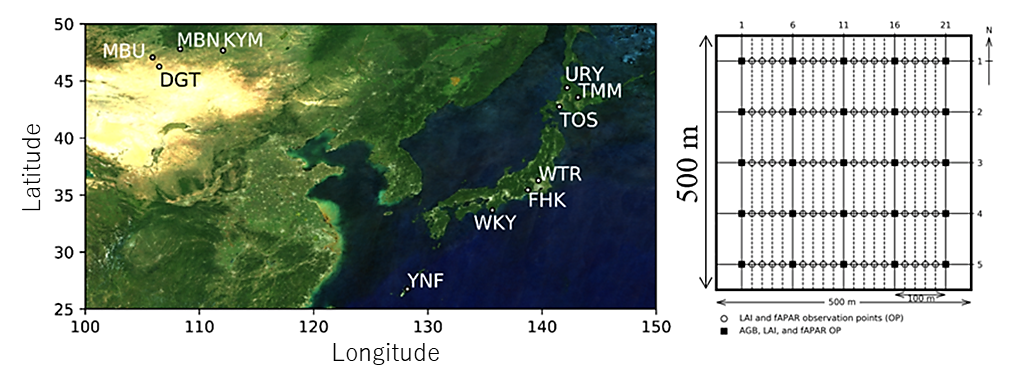
JAXA is also working on acquiring reliable in-situ ecological data for validation. Terrestrial vegetation is a complicated system in tree species composition, canopy structure, and vegetation layers (i.e., tree layer, midstory layer, herb layer, etc.). Furthermore, its distribution is highly heterogeneous. Therefore, it is difficult to obtain reliable LAI at a large scale (such as a representative LAI corresponding to a GCOM-C pixel area (250 m × 250 m)). Furthermore, there are the following issues in in-situ data for validation: the discrepancy in an area between satellite and the in-situ observation and the geolocational discrepancy between satellite and in-situ observations. To overcome such difficulties and issues, A large-scale ecological observation project, “JAXA Super Sites 500,” was initiated. We evaluated and chose the most suitable observation method for a large-scale area (500 m × 500 m) and developed the uncertainty quantification method in the ecological validation data (Figure 9). The ecological validation data acquired at three forest sites and four grassland sites in this project were used for GCOM-C validation.
6. Monitoring active volcanoes
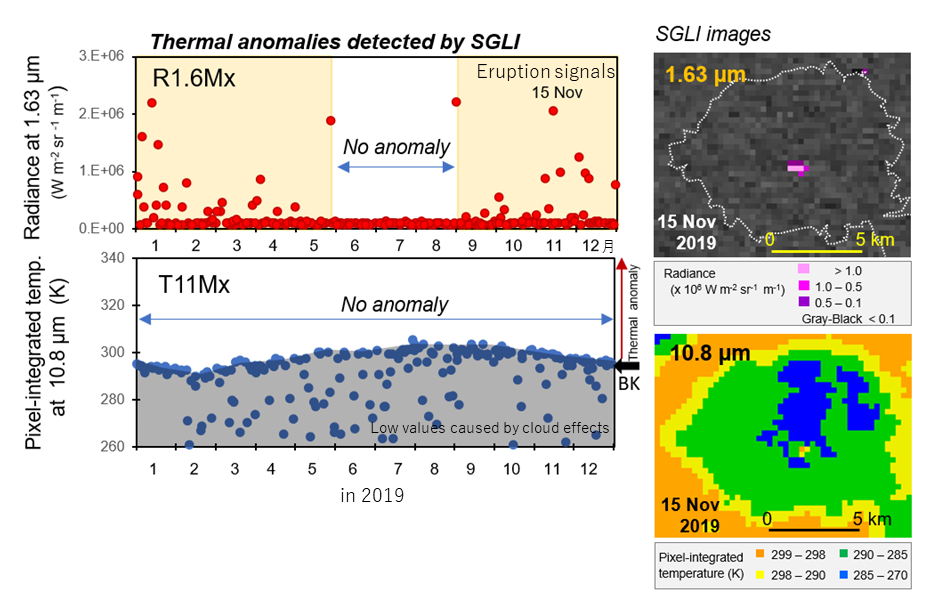
The GCOM-C terrestrial data is not only used for ecosystem monitoring but also used for monitoring active volcanoes in East Asia (http://vrsserv.eri.u-tokyo.ac.jp/realvolc/). As shown in Figure 10, small-scale eruptions of Mt. Sakurajima were detected by GCOM-C, taking advantage of its features of high spatiotemporal resolution.
7. Expectations for long-term observation to monitor environmental changes
We are developing and providing reliable GCOM-C land products through the activities to acquire reliable validation data and the leading-edge algorithm development, as described above. GCOM-C data is useful for the real-time monitoring of water use in irrigation facilities and volcanic activity. Besides, GCOM-C is expected to detect global environmental changes caused by extreme weather events and global warming by providing the essential ecological information (such as LAI, AGB, and plant phenology) for the long term.
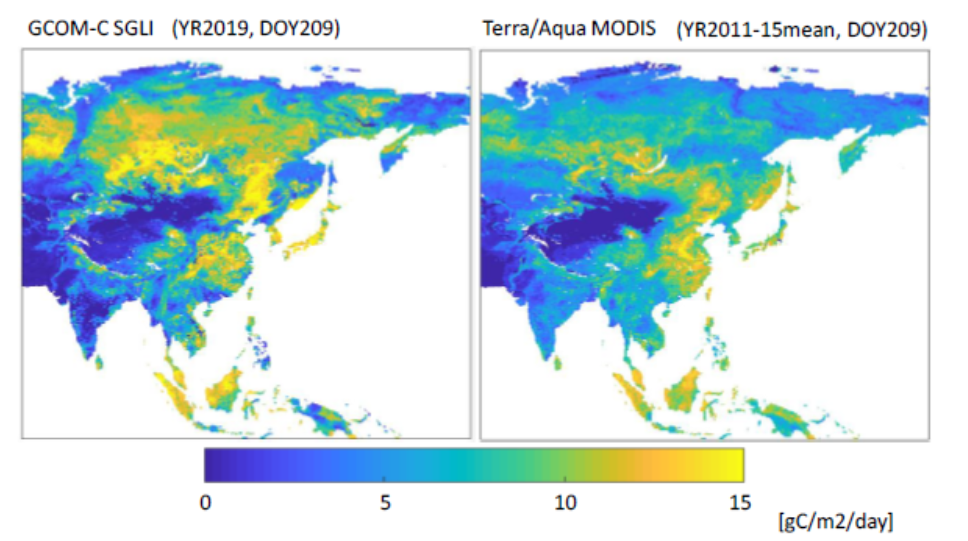
As for the total amount of carbon compounds produced by photosynthesis of plants in an ecosystem (gross primary production [GPP]), we are now developing an algorithm to estimate the value using the GCOM-C’s ecological information and land surface temperature (Figure 11), the figure shows that GPP in summer was higher in 2019 than the mean in 2011–2015 at high latitudes. This fact may detect the global warming event. Unfortunately, this event was derived from comparing the estimations using GCOM-C data in 2019 and the other sensor’s data in 2011–2015. It is not enough to detect such long-term global warming events only using GCOM-C four years’ data. We believe that GCOM-C long-term data can largely contribute to clarifying the phenomena caused by global warming in the future.
Writings: JAXA/EORC, Dr. Tomoko K. Akitsu
Search by Year
Search by Categories


Tags
-
#Earthquake
-
#Land
-
#Satellite Data
-
#Aerosol
-
#Public Health
-
#GCOM-C
-
#Sea
-
#Atmosphere
-
#Ice
-
#Today's Earth
-
#Flood
-
#Water Cycle
-
#AW3D
-
#G-Portal
-
#EarthCARE
-
#Volcano
-
#Agriculture
-
#Himawari
-
#GHG
-
#GPM
-
#GOSAT
-
#Simulation
-
#GCOM-W
-
#Drought
-
#Fire
-
#Forest
-
#Cooperation
-
#Precipitation
-
#Typhoon
-
#DPR
-
#NEXRA
-
#ALOS
-
#GSMaP
-
#Climate Change
-
#Carbon Cycle
-
#API
-
#Humanities Sociology
-
#AMSR
-
#Land Use Land Cover
-
#Environmental issues
-
#Quick Report
-
#GOSAT-GW
Related Resources


Related Tags
Research and Development Related Articles
-
 Research and Development 2026.03.09 Mon High-Resolution Predictions of Global Terrestrial Water Cycle:
Today’s Earth – Global Updated -
 Research and Development 2025.06.18 Wed Advancing Space-Based Weather Analysis and Forecasting – Renewal of JAXA’s Realtime Weather Watch ‘NEXRA3’ and Performance Evaluation with the previous system (Overview Article)
 -
 Research and Development 2025.03.27 Thu Launch of Ocean Weather Forecasts 1km resolution
 -
 Research and Development 2024.05.27 Mon The Use of Earth Observation Satellite Data in the Humanities and Social Sciences (3)
Stay Connected
