


Research and Development
2022.06.06 Mon
“SHIKISAI” (GCOM-C) marks the fifth year since its successful launch: Achievements on atmospheric environment
Contents:
1. “SHIKISAI” (GCOM-C) and atmospheric environment
2. Development of atmosphere products
●Development of cloud and aerosol products aimed at observation of long-term changes in the atmospheric environment
●Accuracy improvement of algorithm for estimating cloud properties using artificial intelligence
3. Status monitoring and long-term observation of the Earth system changing with global warming
●Monitoring extreme wildfires over the world and property analysis of fire-emitted aerosols
4. Improvement of the Earth system knowledge and future projection accuracy
●Evaluation of numerical models in the growth process of water cloud particle
●Aerosol data assimilation experiments for improving reproducibility of aerosol models
5. Summary
1. “SHIKISAI” (GCOM-C) and atmospheric environment
The atmosphere is extremely thin compared to the radius of Earth, but it is indispensable for many living things including human beings. However, since the Industrial Revolution, the environment has been threatened mainly due to human activities. Compared to the ocean, the atmosphere has a faster time scale of physical phenomena and a smaller specific heat capacity, so it can be a place where effects of climate change including global warming are likely to appear. According to the Intergovernmental Panel on Climate Change (IPCC) Sixth Assessment Report (AR6), the average global temperature was approximately 1.1 ℃ higher in 2011–2020 than pre-industrial levels. This temperature rise is an unprecedented speed over the past 2,000 years. With this rapid global warming, the frequency of extreme weather events such as heat waves, droughts, heavy rainfalls, and tropical cyclones is increasing everywhere in the world, affecting the whole global environment. Considering these facts, continuous monitoring of atmospheric conditions is highly important to understand the present and future global environment. In order to capture these climate changes, GCOM-C observes the distribution and optical properties of aerosols*1 such as PM2.5 and yellow dust, in addition to information such as global cloud distribution, altitude, and cloud particle size, by making full use of its sensor that can observe a wide range of wavelengths from the near-ultraviolet and visible to the thermal infrared region, and polarization observation that can measure not only light intensity but also its state (oscillation direction of electromagnetic waves).
In this article, we introduce the GCOM-C achievements in atmospheric observations over four years after its launch.
> Link to the article about land, ocean, and snow and ice observations <
*1 aerosol: A tiny liquid suspended in a gas or a mixture of solid particles and surrounding gas. Particle sizes range from 0.001μm to about 100μm. Yellow dust and PM2.5 are also included in aerosol.
2. Development of atmosphere products
Development of cloud and aerosol products aimed at observation of long-term changes in the atmospheric environment
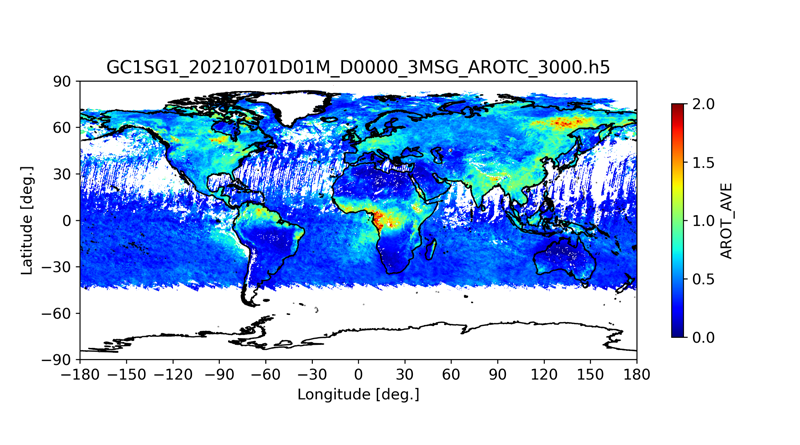
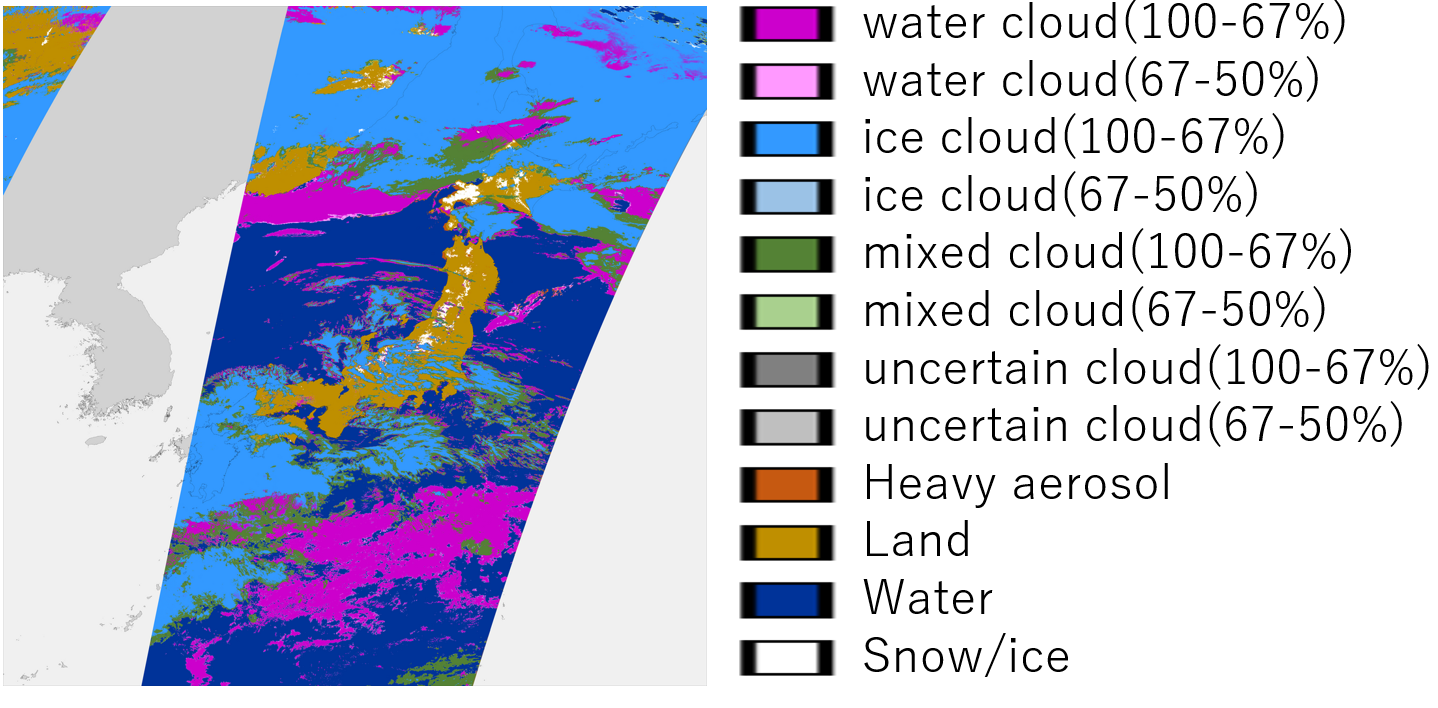
As physical quantity data related to the atmosphere, GCOM-C mainly provides cloud and aerosol products. The cloud products estimate not only cloud discrimination (Figure 1), but also physical quantities related to cloud properties such as cloud fraction for each cloud type such as cumulonimbus and stratus), cloud-top temperature, cloud top height, and radius of cloud droplets (Nakajima et al. 2019). Also, the aerosol products estimate various parameters that quantify the optical properties, such as aerosol optical thickness*2 over land and ocean (Figure 2), the single scattering albedo related to the degree of light absorption, and the Ångström exponent (AE) related to the particle size. These are important data for monitoring the atmospheric environment. In particular, the GCOM-C sensor has a function of polarization observation, which is also sensitive to small aerosol particles (< about 0.3μm) including aerosols in urban areas that cannot be captured by previous satellite observations. By combining with existing estimation methods using near-ultraviolet and visible/near-infrared light, it is possible to observe aerosols of various particle sizes. In collaboration with other research agencies, JAXA has continued to conduct accuracy validation and improvement of cloud and aerosol products. Further research achievements are expected by accumulating satellite data for a long term.

Accuracy improvement of algorithm for estimating cloud properties using artificial intelligence
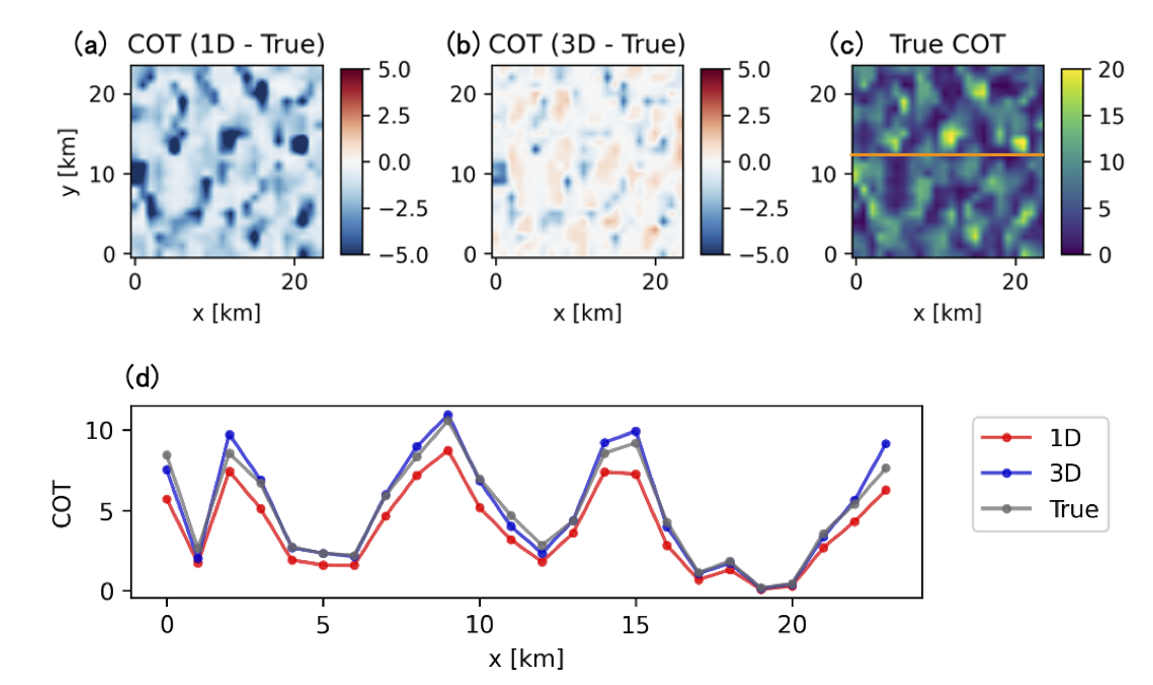
Traditional estimation methods of cloud properties often assume vertical one-dimensional (1D) atmosphere condition, so three-dimensional (3D) inhomogeneous clouds are major factor of estimation error. A research group at Tohoku University is developing a machine learning method to estimate cloud properties closer to reality by using clouds generated by 3D radiative transfer models*3 as training data. If the atmosphere can be treated as a 3D structure, it is possible to estimate cloud properties with high accuracy even in case small clouds are scattered or heterogeneity inside the cloud is large (Figure 3). These achievements are expected to help accuracy improvement of GCOM-C cloud products and calculation of radiation budget (calculation of energy entering and leaving the earth), which is important to predict global warming.
*2 optical thickness: An index of how much light reduces when it passes through an target. The larger the optical thickness of the cloud, the more it shades light.
*3 radiative transfer models: Models that calculate the process of light propagation (scattering, absorption, etc.) in the atmosphere and on the Earth’s surface based on the energy conservation law. For example, if parameters such as cloud thickness and state (water, ice) are set, it is possible to calculate the color and brightness of the clouds when observed by satellites.
3. Status monitoring and long-term observation of the Earth system changing with global warming
Monitoring extreme wildfires over the world and property analysis of fire-emitted aerosols
IPCC AR6 and the report on wildfires by the United Nations Environment Programme (UNEP) indicate that extreme wildfires will become more frequent due to regional droughts and heat waves caused by global warming. Since wildfires emit large amount of aerosols, it is likely to generate a harmful effect for respiratory system of surrounding organisms. In addition, it is known that aerosols have an impact on air quality and climate. Typically, aerosols are considered to have a cooling effect on the earth (umbrella effect) because they reflect sunlight and promote the formation of clouds that have a large impact on radiation. However, some aerosols have the effect of warming the earth, such as light-absorbing aerosols that are largely emitted from wildfires. Therefore, the uncertainty in the overall aerosol contribution to global warming is extremely large and it reduces the prediction accuracy of future temperature change. For the above reasons, satellite monitoring of wildfires is important not only as an immediate information source such as fire detection and damage monitoring, but also as research data for estimating mid- to long-term impacts on the atmospheric environment.
Figure 4 shows a visible image of the plumes from the wildfire in California captured by GCOM-C (Fig. 4(a)), aerosol optical thickness (Fig. 4(b)), and temporal (distance) change of the optical properties (Figs. 4(c) and (d)), respectively. One of the advantages of GCOM-C is to observe such sudden and large-scale event without missing, because it carries out global observation with high frequency and wide angle. The figure of temporal change of the optical properties indicates that the Ångström exponent (AE) of aerosol in plumes is smaller (=larger particle size: Fig. 4(c)) and single scattering albedo (SSA) is larger (=higher light scattering probability: Fig. 4(d)) responding to the distance from hotspot area (fire origin). This is considered to capture the process in which aerosols emitted from fires grow over time, taking moisture and other aerosols in the air. Analysis result of aerosol optical properties based on these real observation data will lead to refinement of aerosol impact on global warming and improvement in climate prediction accuracy.

4. Improvement of the Earth system knowledge and future projection accuracy
Evaluation of numerical models in the growth process of water cloud particle
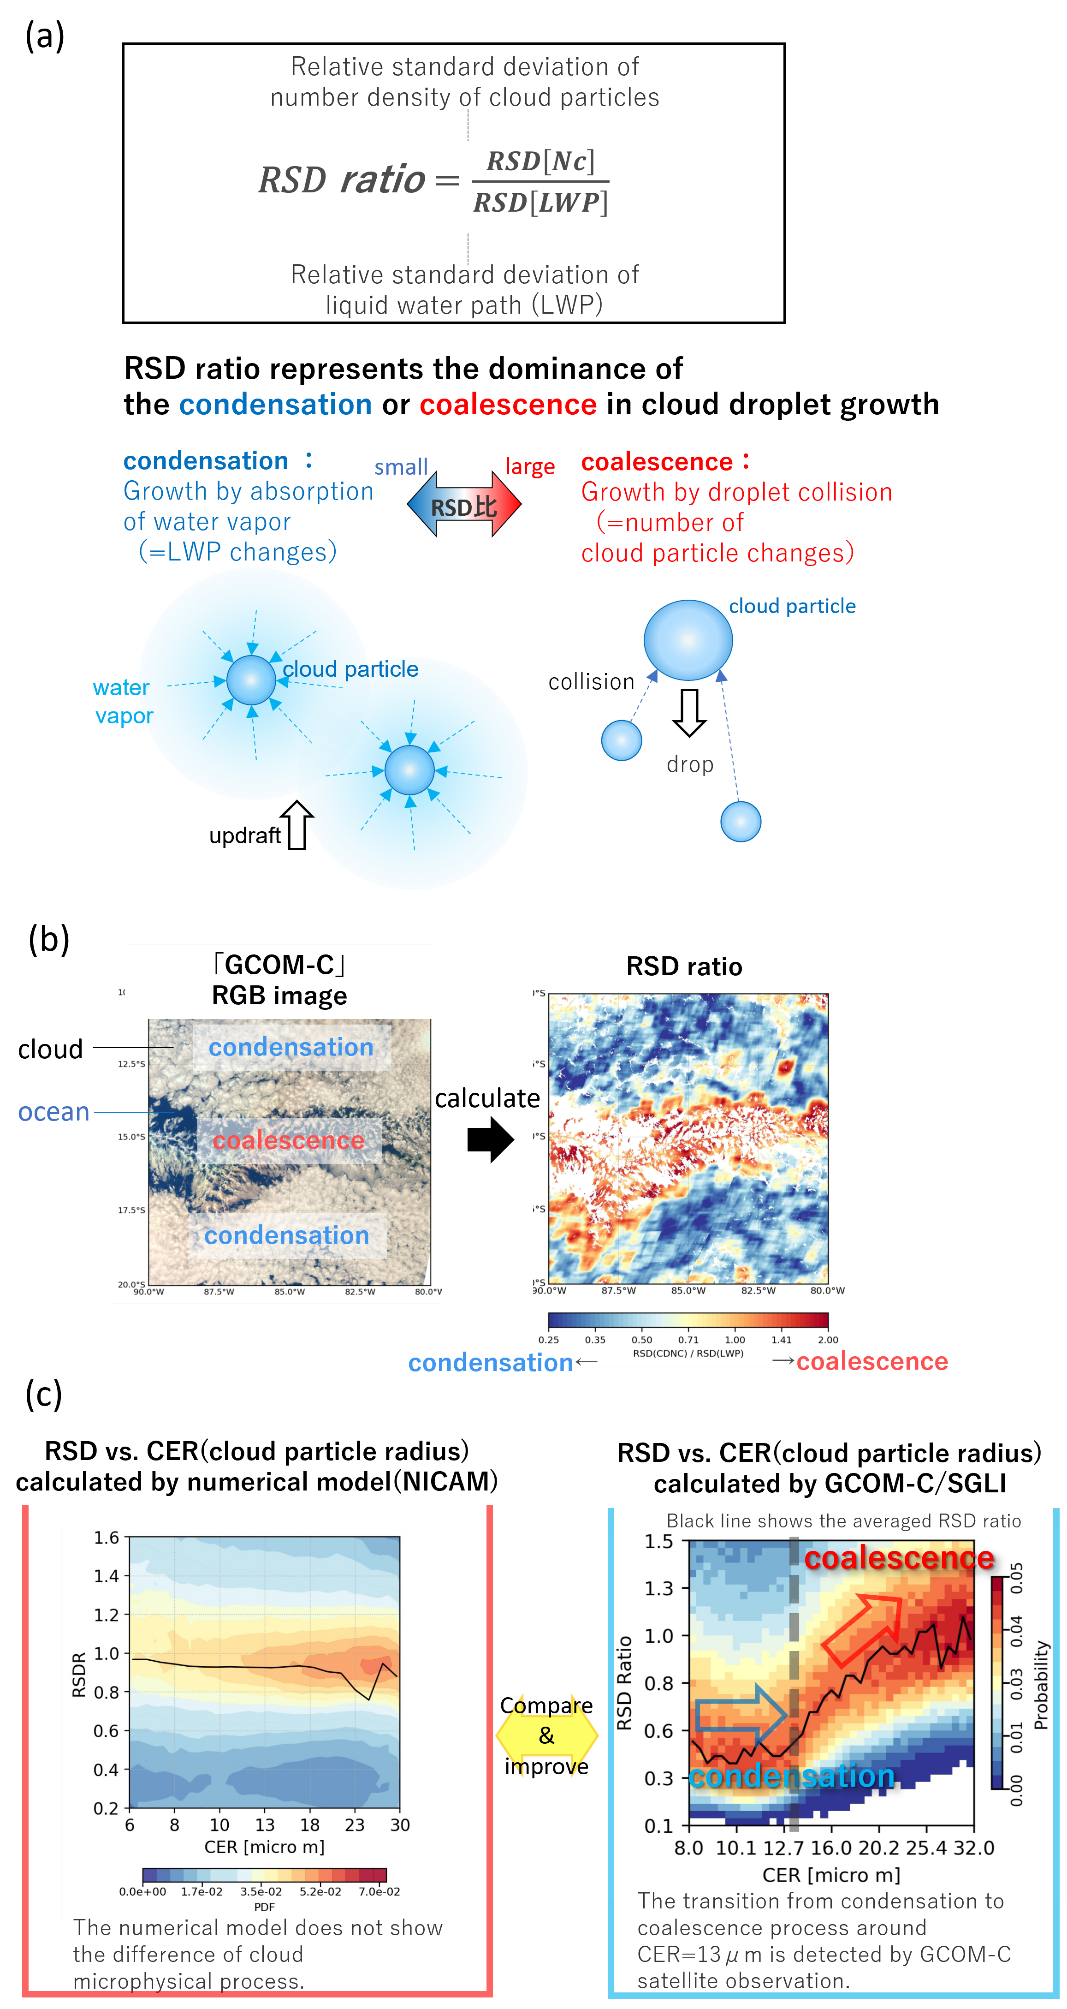
Accurate estimation of aerosol-cloud interaction*4 is highly important for predicting future climate. However, there is still a large uncertainty of setting up cloud microphysical process (the process associated with the growth of cloud particles and the formation of raindrops and ice crystals) in numerical models. For effective evaluation of cloud microphysical process in numerical models, it is essential to quantitatively estimate microphysical process of underlying actual cloud by analyzing cloud property data from satellite observation and compare it with numerical models. The Atmosphere and Ocean Research Institute at the University of Tokyo succeeded in quantitatively estimating the growth process of cloud particle by absorbing the surrounding water vapor (condensation growth) and the growth process by colliding with each other (collision-coalescence) using cloud property data from GCOM-C [Nagao, T. M., & Suzuki, K. (2020)]. Specifically, by examining the “RSD ratio”, an index focusing on the ratio of the horizontal variability (relative standard deviation) of cloud droplet number concentration and cloud water content*5 from GCOM-C data (Figure 5(a) and (b)), they found that the cloud particle growth process shifts from condensation growth to collision-coalescence process when the cloud effective radius (CER) exceeds approximately 13 μm. This relationship between CER and RSD ratio may not be represented by previous numerical models (Fig. 5(c)), and the result offers suggestions for the future improvement of the numerical model.
*4 aerosol-cloud interaction: Clouds are usually formed by aerosols as a core, so increase or decrease of aerosols have effects on cloud cover, cloud particle size, cloud reflectance, etc. These interactions are called aerosol-cloud interactions.
*5 cloud water content: Spatial mass concentration of particulate water forming clouds
Aerosol data assimilation experiments for improving reproducibility of aerosol models
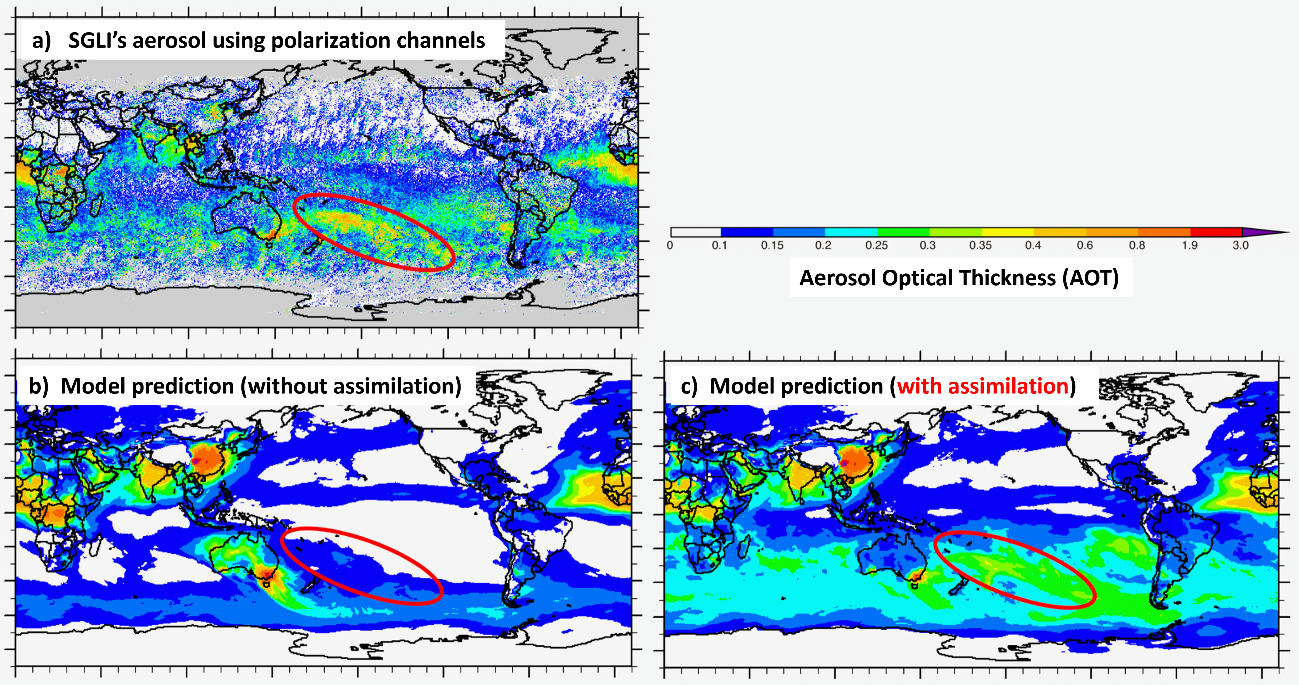
In order to estimate and predict temporal changes in aerosol distribution associated with localized and sudden events that cannot be reproduced by the model alone, it is desirable to sequentially assimilate*6 actual observation data such as satellite data into the model data. GCOM-C observes physical quantity related to global aerosols with relatively high frequency (global observation of once every two or three days) using multi-direction channel. By assimilating GCOM-C data into the model, we expect to improve prediction accuracy.
Kyushu University conducted an aerosol data assimilation experiment using GCOM-C polarization observation, targeting aerosols emitted from a large-scale wildfire that occurred on the east coast of Australia from December 2019 to January 2020. As a result, as shown in Figure 6, we can confirm that reproducibility of aerosol distribution has been greatly improved by incorporating GCOM-C data into the numerical simulation via assimilation. These results suggest the progress of accuracy in aerosol impact assessment using numerical simulations in addition to the accuracy improvement of the aerosol forecast.
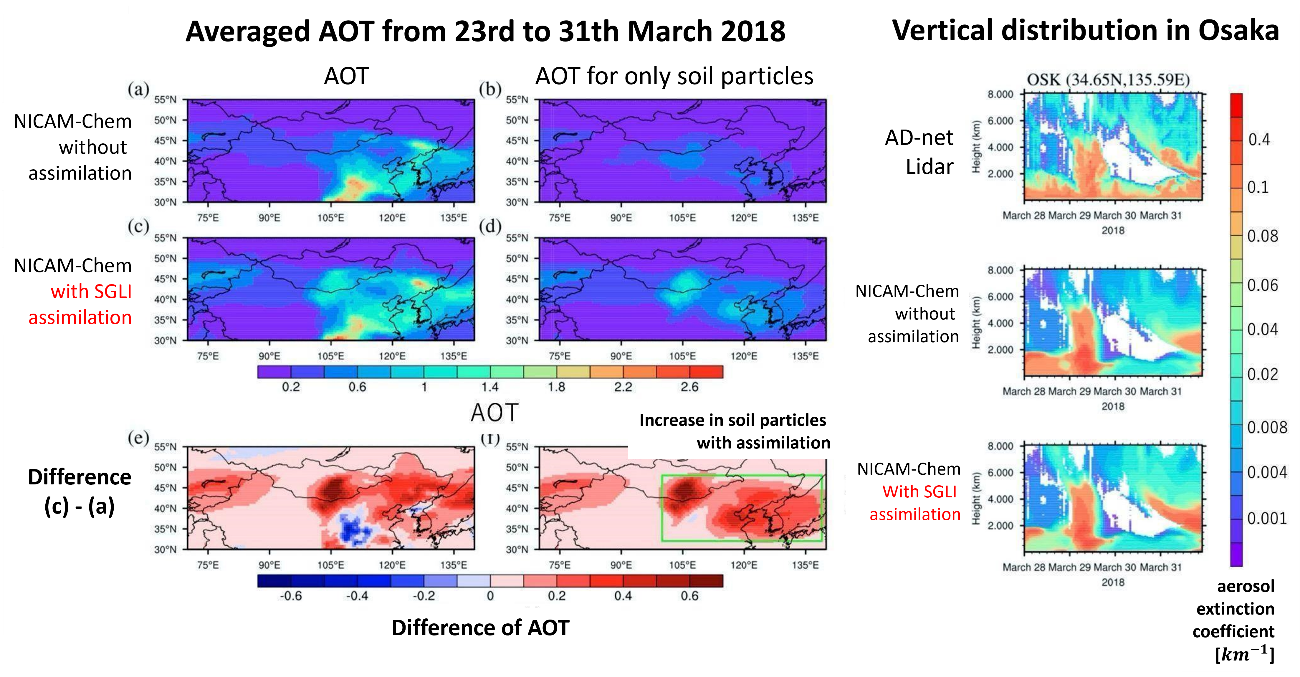
Also, aerosol data assimilation experiments using GCOM-C product have been conducted on the global atmospheric model (NICAM-Chem) developed by the National Institute for Environmental Studies (NIES) and we have continuously validated the usefulness of GCOM-C data assimilation by comparing with the data from other satellite or ground-based lidar observation (Cheng et al., 2021). Figure 7 is one example of validation results, showing that the horizontal distribution of soil particles and the vertical distribution of aerosols have been changed and improved by using assimilation.
Some of the findings and algorithms obtained from these assimilation experiments of satellite observation data and models are actually utilized for Aeolian Dust Information of the Japan Meteorological Agency. We look forward to further accuracy improvement and wider application, deepening our cooperation with other research agencies.
*6 data assimilation: A method to improve reproducibility of the numerical model by inputting actual observation data obtained from satellites.
5. Summary
In order to predict the future effects for climate change, which is one of the international issues, and to examine and conduct mitigation measures, accurate observation of the current global environment is the key. GCOM-C can accurately measure various physical quantities in the field of atmosphere, land, oceans, and snow and ice by taking advantage of its excellent resolution (250 m and 1 km), high-frequency global observation (once every two or three days), and precisely calibrated multi-wavelength sensor (17 channels). In this article, we introduced GCOM-C achievements obtained over about four years since its launch. In some cases, climate change appears as a sudden weather phenomenon, while in other cases, it appears as a gradual change as a long-term trend. Therefore, especially for promoting statistical discussion on global changes, long-term continuous monitoring, such as 10 or 20 years, is indispensable. We will continue high accuracy observation and provide additional value specific to GCOM-C by taking advantage of its features, such as polarization observation that can obtain more detailed information on aerosols and clouds, and multidirectional observation that can capture vegetation and volcanic ash, etc. in three dimensions. In addition, as introduced in this article, if our research improves and develops climate models or Earth system models, we can make a meaningful contribution to future projections of climate change.
(Analysis and writings: Earth Observation Research Center, Japan Aerospace Exploration Agency, Kazuhisa Tanada (Researcher) and Hiroshi Murakami (Manager for GCOM-C Research) / Research and Information Center, Tokai University, Prof. Takashi Nakajima / Graduate School of Science, Tohoku University, Associate professor Hironobu Iwabuchi / Atmosphere and Ocean Research Institute, the University of Tokyo, Prof. Kentaro Suzuki and Takashi Nagao (Project Researcher) / Research Institute for Applied Mechanics, Kyushu University, Prof. Keiya Yumimoto / Regional Atmospheric Modeling section, National Institute for Environmental Studies, Daisuke Goto (Senior Researcher) / Remote Sensing Technology Center of Japan, Mayumi Yoshida (Senior Researcher))
Search by Year
Search by Categories


Tags
-
#Earthquake
-
#Land
-
#Satellite Data
-
#Aerosol
-
#Public Health
-
#GCOM-C
-
#Sea
-
#Atmosphere
-
#Ice
-
#Today's Earth
-
#Flood
-
#Water Cycle
-
#AW3D
-
#G-Portal
-
#EarthCARE
-
#Volcano
-
#Agriculture
-
#Himawari
-
#GHG
-
#GPM
-
#GOSAT
-
#Simulation
-
#GCOM-W
-
#Drought
-
#Fire
-
#Forest
-
#Cooperation
-
#Precipitation
-
#Typhoon
-
#DPR
-
#NEXRA
-
#ALOS
-
#GSMaP
-
#Climate Change
-
#Carbon Cycle
-
#API
-
#Humanities Sociology
-
#AMSR
-
#Land Use Land Cover
-
#Environmental issues
-
#Quick Report
-
#GOSAT-GW
Related Resources


Related Tags
Research and Development Related Articles
-
 Research and Development 2026.03.09 Mon High-Resolution Predictions of Global Terrestrial Water Cycle:
Today’s Earth – Global Updated -
 Research and Development 2025.06.18 Wed Advancing Space-Based Weather Analysis and Forecasting – Renewal of JAXA’s Realtime Weather Watch ‘NEXRA3’ and Performance Evaluation with the previous system (Overview Article)
 -
 Research and Development 2025.03.27 Thu Launch of Ocean Weather Forecasts 1km resolution
 -
 Research and Development 2024.05.27 Mon The Use of Earth Observation Satellite Data in the Humanities and Social Sciences (3)
Stay Connected
