


Disaster
2022.01.28 Fri
“ALOS-2” observation of the oil spill in the Peruvian coast caused by tsunami linked to a Tonga volcanic eruption
On January 15, 2022, a massive eruption occurred at Hunga Tonga-Hunga Ha’apai volcano in the South Pacific Kingdom of Tonga. As a result of this eruption, tsunamis were observed along the Pacific coast far away from the volcano, including Japan. Especially in Peru, a large amount of crude oil that was being unloaded from a tanker to an oil refinery at Kayao, a suburb of the capital city of Lima (Figs. 1 and 2), spilled into the ocean due to high waves and drifted ashore on the coastline. According to the Ministry of Environment of Peru, an estimated 6,000 barrels of oil have been spilled into Peru’s Pacific region which has rich biodiversity, causing extensive damages to fishes and birds. Fishing activities are impossible in this situation. For this reason, Peru declared an environmental emergency for 90 days.
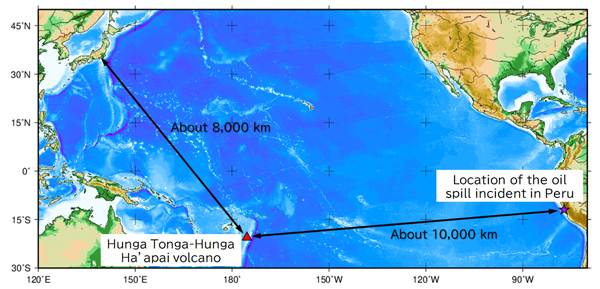
The distance between Tonga and Peru is about 10,000 km.
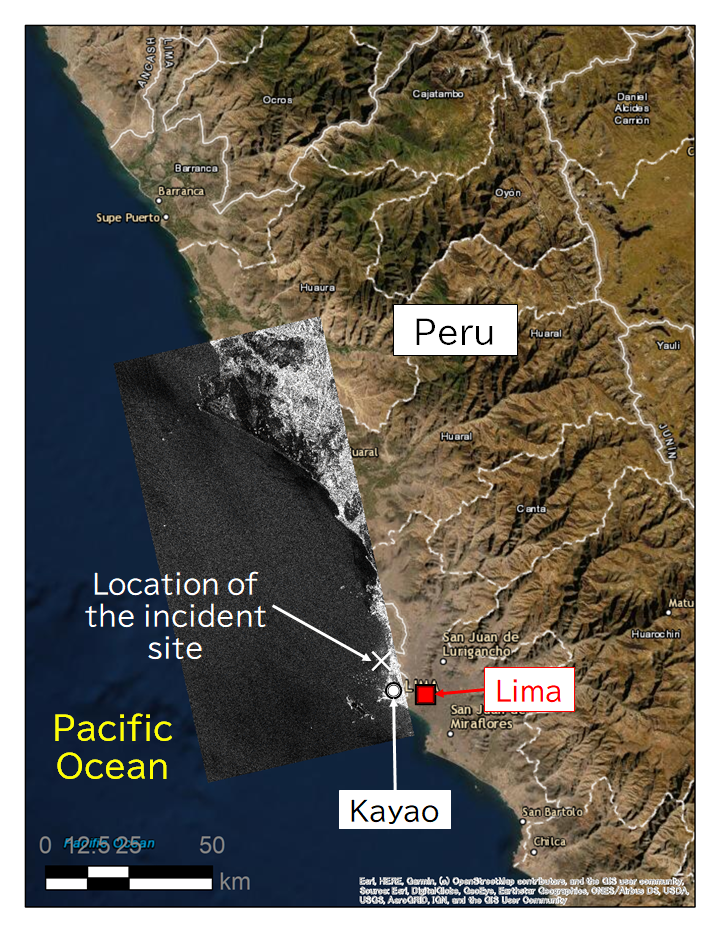
The location of the incident site (×) is about 30 km from Lima, the capital of Peru.
Emergency observation of the oil spill by “ALOS-2”
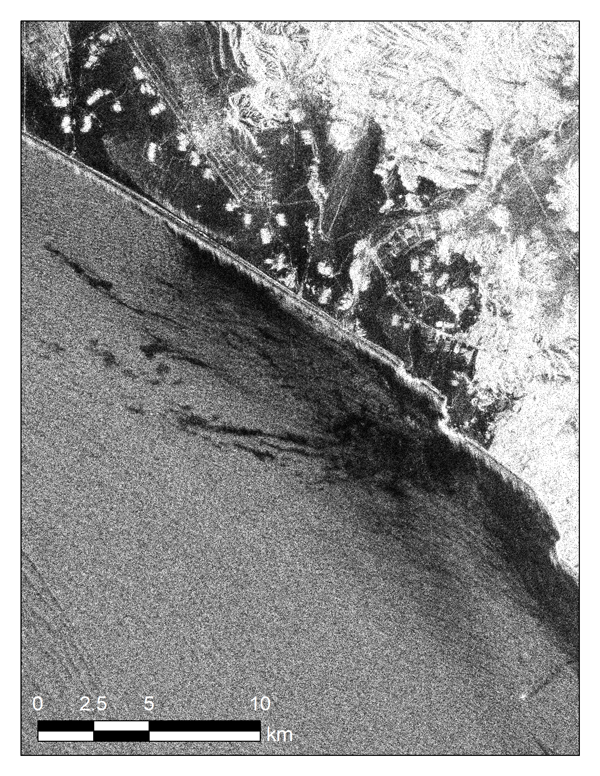
The oil spill incident occurred near the La Pampilla refinery in Kayao. “ALOS-2” performed emergency observation of the Peruvian coast at 05:26 on January 21, 2022 (UTC), 5 days after the incident.
In the image of synthetic aperture radar, lands (islands) and ship with strong radio reflection toward radar are seen bright (white color). On the other hand, ocean surface looks dark (black color) due to the weakness of reflection. Location where oil is floating looks much darker (black). (For the details, please refer to the explanation on the article about the oil spill incident in Mauritius coast in 2020.)
In order to confirm the existence of oil, we compared the image taken this time with the previous observation images (April 13, 2021 and May 9, 2021) in Figure 3. The stronger the ocean wind, the higher the waves and the image appears brighter due to the strong radio reflection from ocean surface. As the entire ocean surface was wavy on April 13 (Fig. 3A), the ocean surface looks bright. On the other hand, the ocean winds were calm near the coast on May 9 (Fig. 3B), so the image seems to be dark. In the current observation (Fig. 3C), dark areas near the coast could be calm. However, since there are much darker streaky areas, we estimated that these areas are most likely to be oil (circled in yellow).
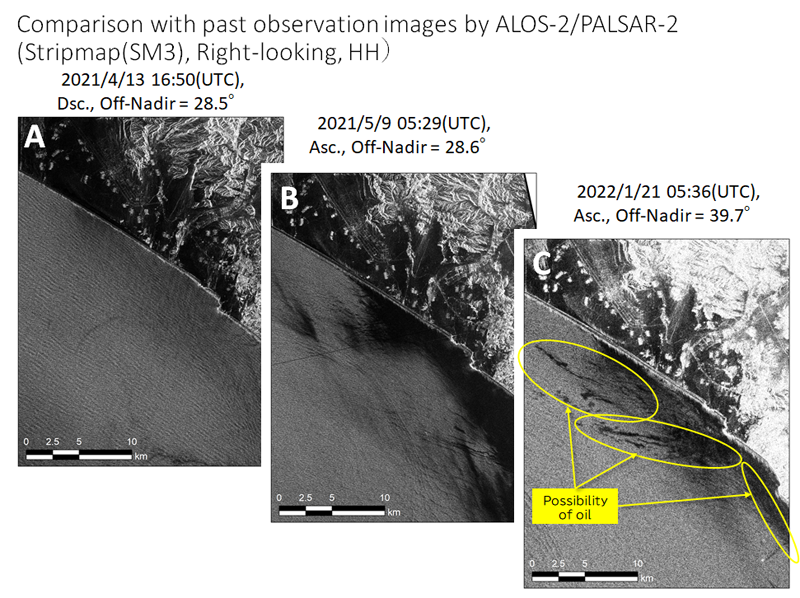
A: (Before the oil spill) April 13, 2021 16:50(UTC), Off-Nadir angle 28.5°, Descending
B: (Before the oil spill) May 9, 2021 05:29(UTC), Off-Nadir angle 28.6°, Ascending
C: (After the oil spill) January 21, 2022 05:36(UTC), Off-Nadir angle 39.7°, Ascending
In the image C, the area near the coast could be calm. However, since there are much darker streaky areas, we estimated that these areas are most likely to be oil (circled in yellow).
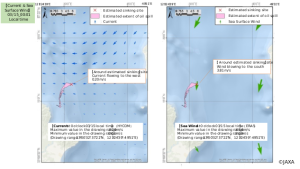
Figure 4 shows ALOS-2/PALSAR-2 observation image of the Peruvian coast and its partially enlarged images. Same as Fig. 3C, we determined that oil is most likely spreading in areas that appear suddenly dark (black) compared to the surrounding sea surface brightness in this figure. The areas are circled in yellow. There are many vessels in the ocean near the oil spill and we can also see the crude oil tanker caused the oil spill is still at anchor (Fig. 4B). Although the oil is spreading near the incident site (Fig. 4B), it can be found that more oil is reaching the northern coastal area (Fig. 4C, D). We consider this is because the oil has flowed to the north following the southern wind or the surface current from the south during five days after the oil spill incident.
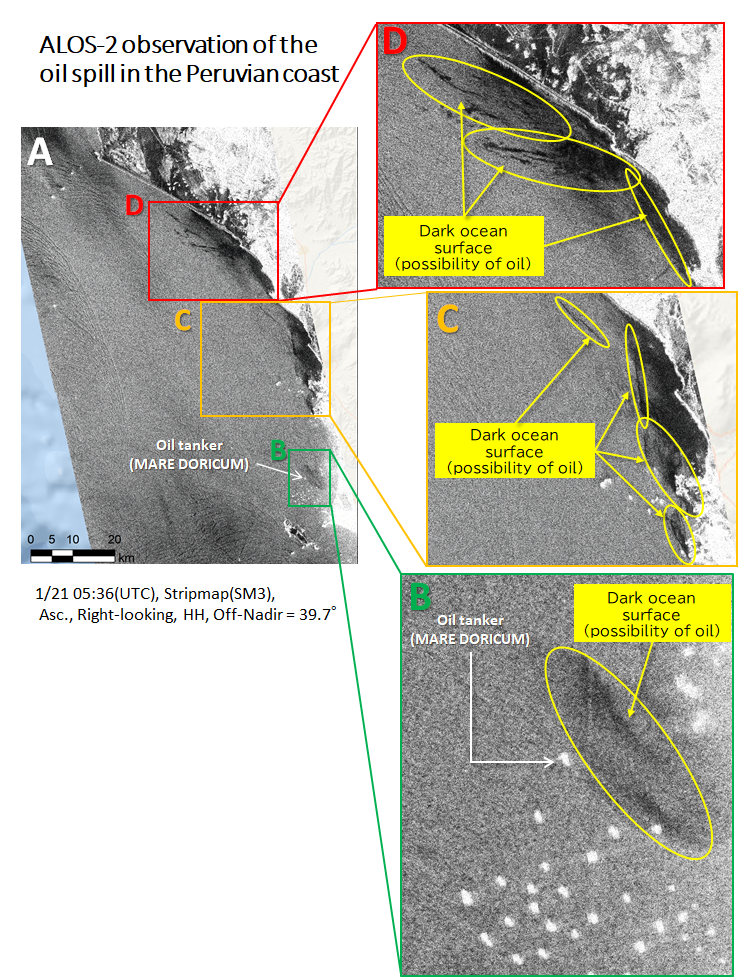
(January 21, 2022 05:36 (UTC), Off-Nadir angle 39.7° , High resolution mode (resolution 10 m), Ascending, Right-looking, HH polarized wave)
The areas which are most likely to be oil are circled in yellow. Bright spots on the ocean show the vessels including the crude oil tanker caused the oil spill.
After the emergency observation, JAXA provided ALOS-2 data to “International Disasters Charter”.
The International Disasters Charter is an international collaboration, through which satellite data are made available for the benefit of disaster management in case of huge disasters. Launched in 1999, the International Charter is currently composed of 17 member organizations including JAXA. Since JAXA became a member, JAXA has provided its “ALOS” and “ALOS-2” data many times in response to requests made to the International Disaster Charter in case of huge disasters.
(For the details of “International Disasters Charter”, please see here.)
Related Sites
Cooperation for the oil spill incident in Mauritius coast by using “ALOS-2” observation
Search by Year
Search by Categories


Tags
-
#Earthquake
-
#Land
-
#Satellite Data
-
#Aerosol
-
#Public Health
-
#GCOM-C
-
#Sea
-
#Atmosphere
-
#Ice
-
#Today's Earth
-
#Flood
-
#Water Cycle
-
#AW3D
-
#G-Portal
-
#EarthCARE
-
#Volcano
-
#Agriculture
-
#Himawari
-
#GHG
-
#GPM
-
#GOSAT
-
#Simulation
-
#GCOM-W
-
#Drought
-
#Fire
-
#Forest
-
#Cooperation
-
#Precipitation
-
#Typhoon
-
#DPR
-
#NEXRA
-
#ALOS
-
#GSMaP
-
#Climate Change
-
#Carbon Cycle
-
#API
-
#Humanities Sociology
-
#AMSR
-
#Land Use Land Cover
-
#Environmental issues
-
#Quick Report
-
#GOSAT-GW
Related Resources


Disaster Related Articles
-
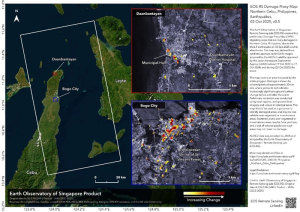 Disaster 2025.10.23 Thu ALOS-2 Observations of the Earthquakes in the Philippines
(Cebu Island and Mindanao Island) -
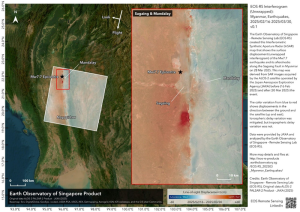 Disaster 2025.04.04 Fri ALOS-2 Observation of the M7.7 Earthquake in Myanmar
 -
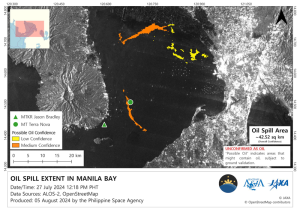 Disaster 2024.09.09 Mon ALOS-2 Observation of the Oil Spill Caused by the Sinking of a Tanker in Manila Bay, Philippines
 -
 Disaster 2023.04.07 Fri ALOS-2 observation: Oil spill from sunken oil tanker off Mindoro Island, Philippines (follow-up report)
Stay Connected
