Mount Nyiragongo located in the eastern area of the Democratic Republic of the Congo began erupting on May 22, 2021. The lava flow reached residential area and caused severe damage. Regarding this eruption, we will introduce observation results by Advanced Land Observing Satellite-2 “DAICHI-2” (ALOS-2) and Global Change Observation Mission – Climate “SHIKISAI” (GCOM-C). Some information has been provided to local agencies such as the Rwanda Space Agency (RSA) through the Japan International Cooperation Agency (JICA). Also, the observation data has been provided to the International Disasters Charter.
Observation results of crustal movement and the surround of the crater by ALOS-2
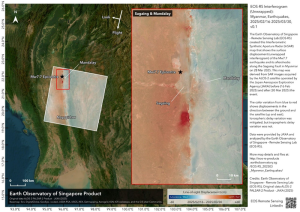
Figure 1 shows the observation area of the Phased Array type L-band Synthetic Aperture Radar-2 (PALSAR-2) onboard ALOS-2 on May 28, 2021 and June 3, 2021 (local time). Observation mode is high resolution with 10m (observation range; approx. 70km). Figure 2 (left) is InSAR image obtained by observation data on May 28, 2021 and before the eruption (March 6, 2020). Figure 2 (right) is interferometric SAR (InSAR) image obtained by the data on June 3, 2021 and before the eruption (July 30, 2020). InSAR image shows the ground surface displacement as cyclic fringes like contour lines. There is a large displacement at the center around the area where the fringes are concentrated, indicated black arrows in the figures. The earth’s surface displaced more than about 1m by eruption activity.
Figure 3 uses two InSAR images of Fig. 2 and calculated the ground surface displacement. Fig. 3 (left) shows the movement of the earth’s surface in the east-west direction. Right side of the image is bule and left side is red, this indicates the ground is spreading in the direction that seems to split into east and west. Fig. 3 (right) shows the movement of the earth’s surface in the vertical direction. Overall, the color is light red, which means that the ground is rising, but we can find that only the area near the center of the displacement shown by the black arrow in the figure appears blue, which means that the ground is subsiding. These are typical movement patterns showing magma intrusion (magma rises splitting the ground) under the ground around this arrow. PALSAR-2 observes using L-band waves which have relatively long wavelength, so coherence is high even in case of the data with long time lag like one year. Also, measurement of the detailed variation is possible even when the crustal variation is big, exceeding 1m as this time. This image also uses the data of May 14, 2021 as a pre-eruption data. Since this pre-eruption data was obtained by wide observation mode(resolution; approx. 100m), resolution is coarse in analysis result but the effect of temporal change is smaller because it is more recent data.
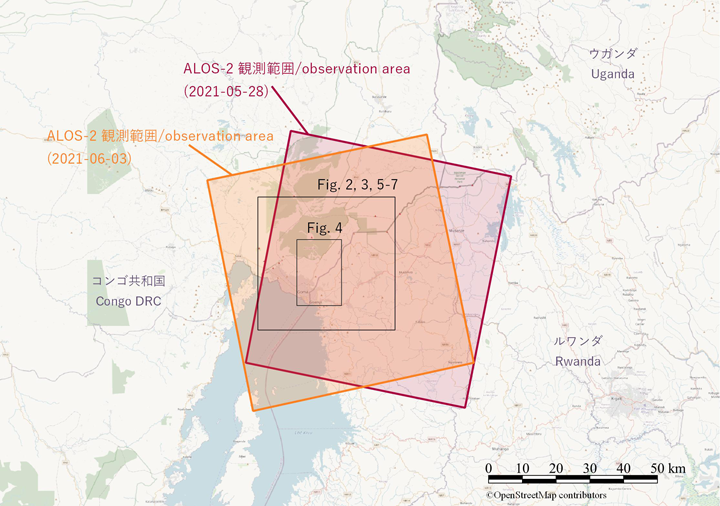
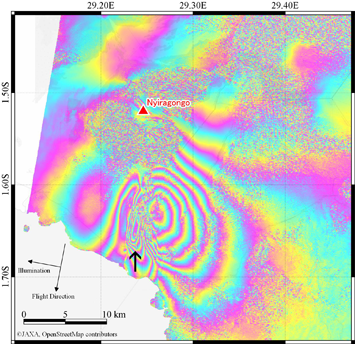
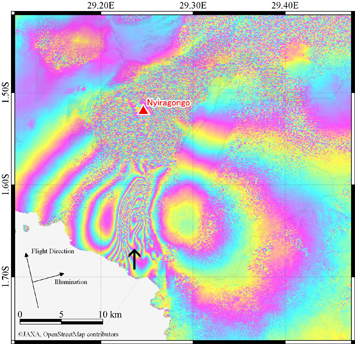
Figure 2. InSAR images obtained by ALOS-2 observation data on May 28, 2021 (left) and June 3, 2021 (right)
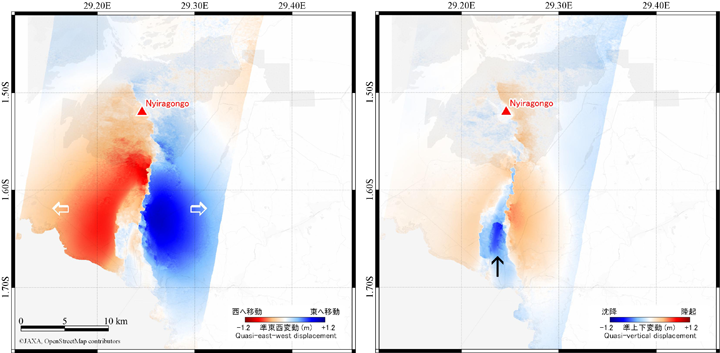
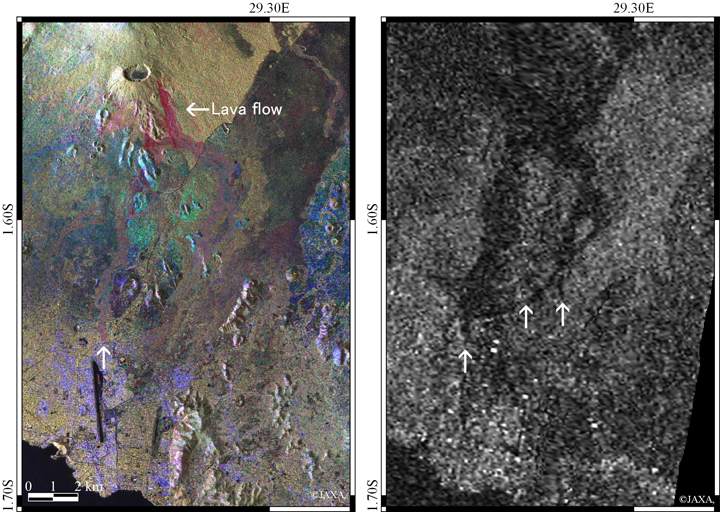
Figure 4 is a visualized image of the lava flow on the ground. Fig. 4 (left) is a color composite image of intensity image of HH polarized wave on March 6, 2020 (before eruption) allocated to red and intensity images of HV, HH polarized wave on May 28, 2021 (after eruption) allocated green and bule, respectively. The lava flow reaching around the mountain top and the airport indicated by white arrows appear red. Fig. 4 (right) is a coherence image obtained by interferometric processing and the dark parts show rough distribution of the lava flow. We can see the lava flow on the east side which is rather difficult to see in intensity image. The lava is flowing to the area indicated by white arrows.
The result of thermal infrared observation by GCOM-C
Figures 5-7 show the thermal infrared images observed by Global Change Observation Mission – Climate “SHIKISAI” (GCOM-C) at night-time from May 19 to May 23, 2021. The white part in Fig. 5 and 7 is Lake Kivu and the gray parts are the area discriminated as cloud. During this period, cloudy days continued in the daytime around the Nyiragongo Volcano. However, GCOM-C observed area around volcano through cloud gap at night-time on May 19 and 23 utilizing thermal Infrared channel of Second generation GLobal Imager (SGLI). The whole area was covered by clouds etc. on May 22 and the blue part shows low temperature. SGLI of GCOM-C observes at thermal infrared wavelength 10.8µm with ground resolution of 250m, this is the highest ground resolution among the satellites which observe the globe more than once in two days on average.
In Fig. 5, there was a lava lake with high temperature at the crater of the Nyiragongo Volcano even before eruption and strong infrared radiation was observed. In Nyiragongo Volcano, the crater with high temperature shown in Fig. 5 has repeatedly been captured since 2018, when GCOM-C was launched.
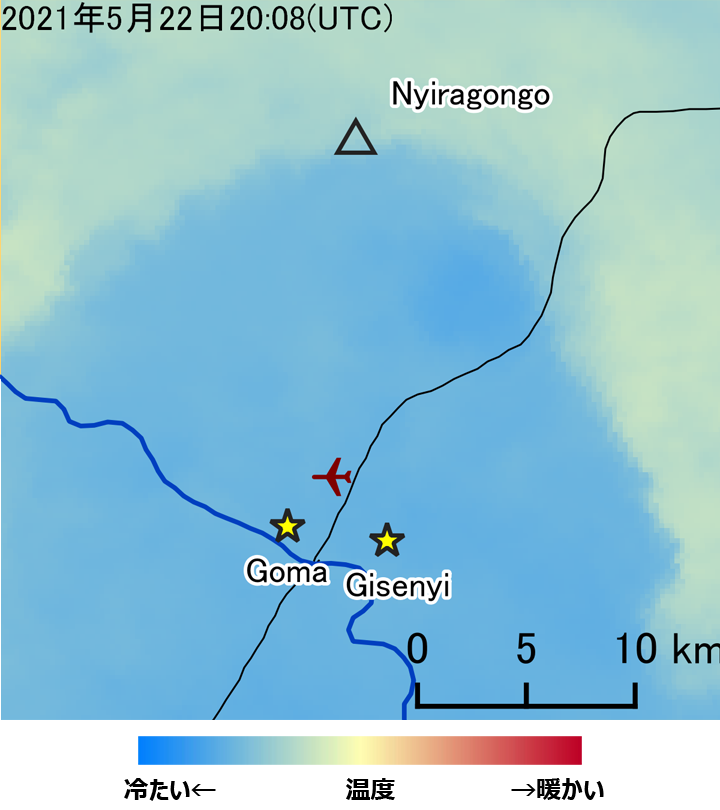
Figure 6 is a thermal infrared image at night-time on the eruption day – May 22, 2021. The whole area is discriminated as clouds, but we can find the still lower temperature parts which appear to be volcanic plumes flowing toward south.
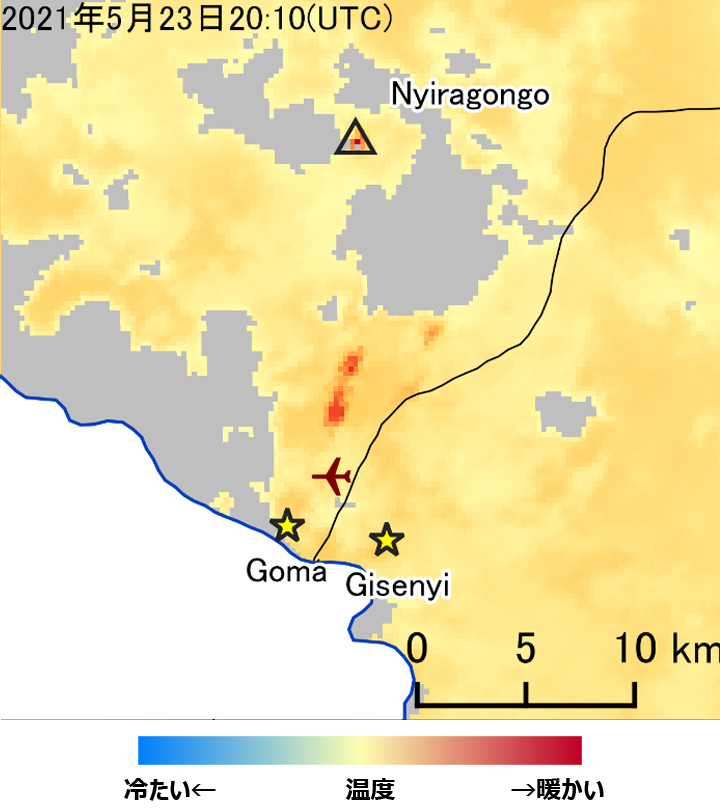
Figure 7 is a thermal infrared image at night-time on the next day of eruption – May 23, 2021. Through cloud gap, a part of the lava flow was observed as relatively high temperature than surroundings and we can find it was flowing down about 13 km toward Goma city from Nyiragongo Volcano. The lava flow split into two on the way (under the cloud) and flowed down toward south. We can find that two area – north of the airport and around the boarder – show high temperature.

In this way, multiple use of the Earth observation satellites enables us to obtain various information about volcanic disaster such as crustal variation and lava flows. JAXA will continue volcano observation by request from agencies.
Explanation of the Images
Figure 2
| Satellite | Advanced Land Observing Satellite-2 “DAICHI-2” (ALOS-2) |
|---|---|
| Sensor | Phased Array type L-band Synthetic Aperture Radar-2 (PALSAR-2) |
| Date | May 28, 2021 (left) June 3, 2021 (right) |
Figures 3 and 4
| Satellite | Advanced Land Observing Satellite-2 “DAICHI-2” (ALOS-2) |
|---|---|
| Sensor | Phased Array type L-band Synthetic Aperture Radar-2 (PALSAR-2) |
| Date | May 28, 2021 |
Figures 5, 6 and 7
| Satellite | Global Change Observation Mission – Climate “SHIKISAI” (GCOM-C) |
|---|---|
| Sensor | Second generation GLobal Imager (SGLI) |
| Date | May 19, 2021 20:16 (UTC) (Fig. 5) May 22, 2021 20:08 (UTC) (Fig. 6) May 23, 2021 20:10 (UTC) (Fig. 7) |
Related Sites
-
- Mount Nyiragongo (Smithsonian Museum)
- Volcano monitoring system (under research)
- Eruption of La Soufrière volcano in St Vincent
- Activities of Kilauea volcano in May 2018, observed by “Shikisai”
- Volcanic Plumes from Anatahan Island in Mariana Islands
- Smoke from volcano on Paramushir Island of Chishima Islands (Kurile Islands) observed by GLI
- Seen from Space Category : Disaster