


Disaster
2020.08.11 Tue
Satellite Observations Regarding the Heavy Rainfalls in July 2020
With influence of warm and wet air flowing toward the rainy front, there had been localized heavy rainfalls in Kagoshima and Kumamoto Pref., Japan during July 3-4, 2020. Rivers around the Kuma River in Kumamoto Pref. had overflowed and caused washout. Inland overflow happened at Suwa River in Omuta city, Fukuoka Pref. during July 6-7. Also, overflow happened in Chikugo River, which is flowing from Oita to Fukuoka. Moreover, landslide disasters which might be due to the heavy rainfalls occurred frequently in Oita, Nagasaki, Saga Pref. and so on. The area center on Kyushu region suffered severe damage. We wish to extend our deepest sympathy to all those who have suffered hardship from the disasters.
Even after the time, localized heavy rains intermittingly continued every region in Japan until late July 2020 with stagnant rainy front (called “Baiu Front”). The damage expanded huge area all over Japan. The rainy season ended during late July to August in Japan. At some area, it was said that sunshine duration in July 2020 was about 30 % compared with average year. It was concerned that growing of crop plants and vegetable etc. has possibility to be affected.
JAXA/EORC has continued analysis regarding the heavy rainfalls and related disasters this time by using combined analysis with numerical simulation and the data obtained from currently operating earth observation satellites and geostationary meteorological satellite. One of the results will be shown here.
Change of the sea surface temperature and water vapor content around Japan compared with normal years
Water vapor in the atmosphere is major source of rain. One of its sources is a warm ocean area. Generally, if sea surface temperature is high in some regions, there might be much water vapors around.
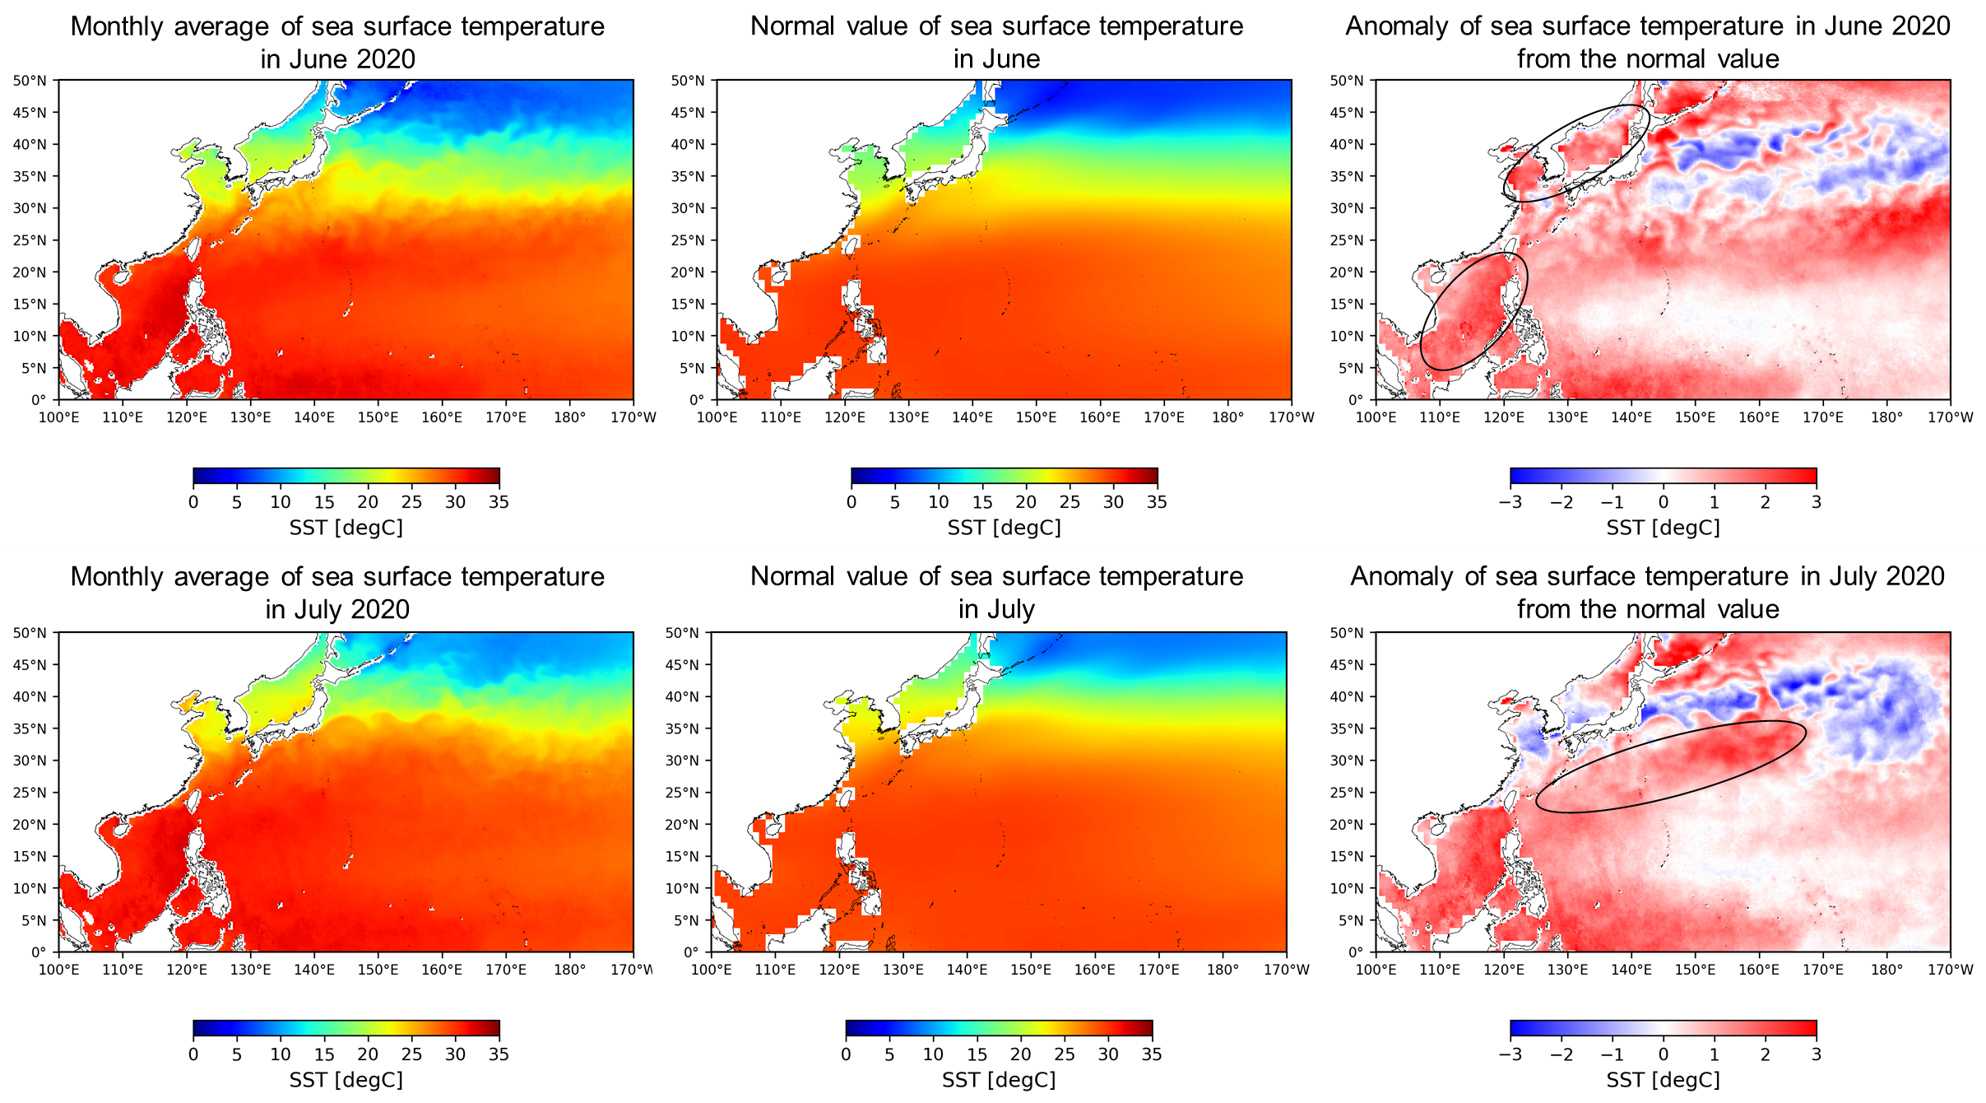
Figure 1-1 shows the anomaly of monthly average of sea surface temperature in June and July 2020 compared with monthly average of the past 30 years in the areas surrounding Japan, from the South China Sea to the Northwest Pacific. It was captured by the Advanced Microwave Scanning Radiometer 2 (AMSR2) onboard the Global Change Observation Mission – Water “SHIZUKU” (GCOM-W). Compared to the normal years, anomalous condition could be found that sea surface temperatures were higher than normal years over a wide area from the South China Sea to the Japan Sea (the black circle in Fig. 1-1, top right) in June this year. Then, the sea surface temperatures became higher even over a wide area from Okinawa to the south of Japan (the black circle in Fig. 1-1, bottom right). On the other hand, we can see the sea surface temperature was getting colder than normal years in the Yellow Sea, the Japan Sea and the Pacific. This could be due to reasons such as continued rainfalls and less sunlight because of the rainy front.
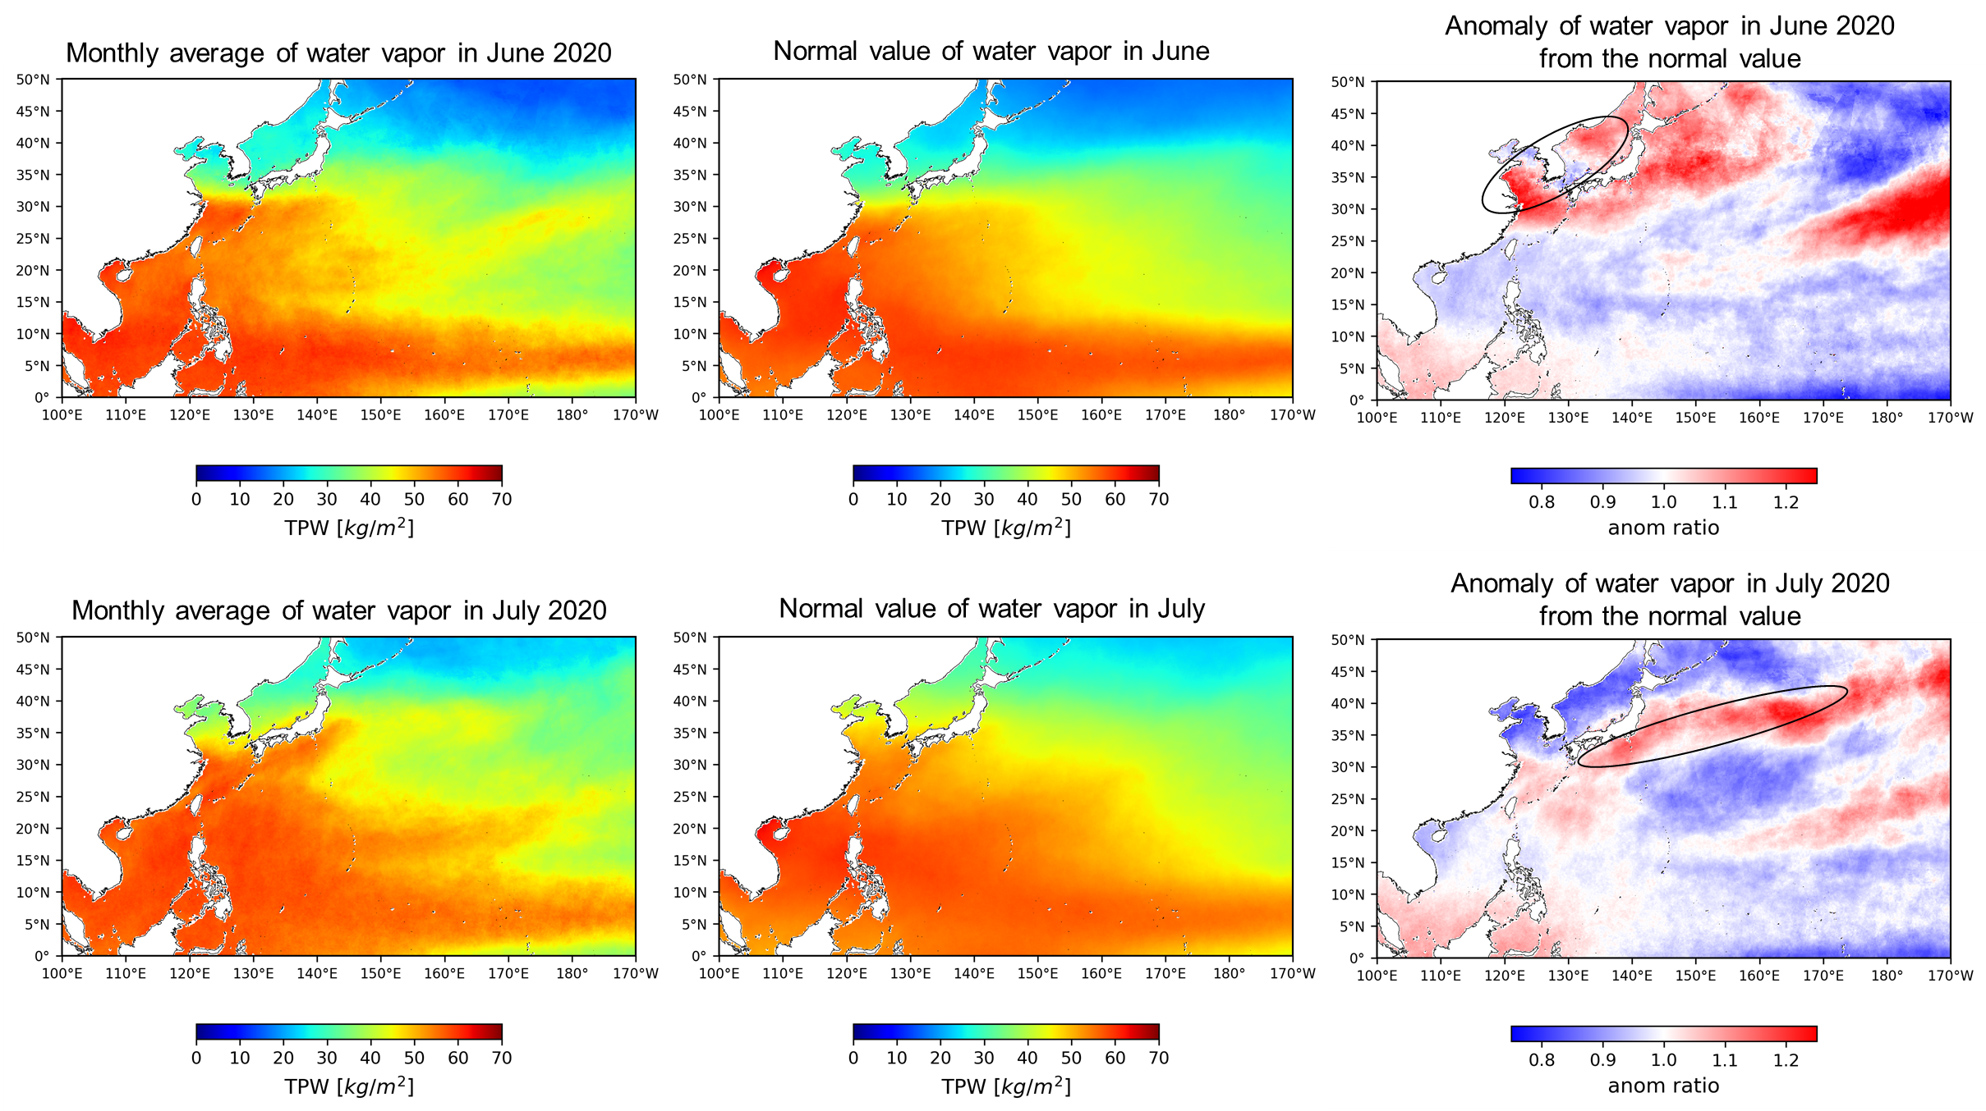
Let’s see the amount of water vapor which greatly related with sea surface temperature. Figure 1-2 shows the monthly average of integrated water vapor content (i.e., the vertically integrated water vapor content in the atmosphere) for June and July 2020, also observed by GCOM-W.
The anomalies from the normal value (in this case, monthly average for the period of 2012-2019 observed by GCOM-W) is shown as a ratio (the observed value was divided by the normal value). An anomaly ratio of “1” indicates that condition is same as normal year, while a ratio greater than 1 indicates an above normal. From June to July, the amount of atmospheric water vapor were 1.1-1.2 times higher than the average of past eight years, corresponding to a wide area around the rainy front, especially the area where sea surface temperatures were higher than normal (the black circles in Fig. 1-2, right) around Japan. This suggests the possibility that higher-than-normal sea surface temperatures continuously providing moist air above the sea to the rainy front led to the persistent downpours caused by the localized heavy rainfall.
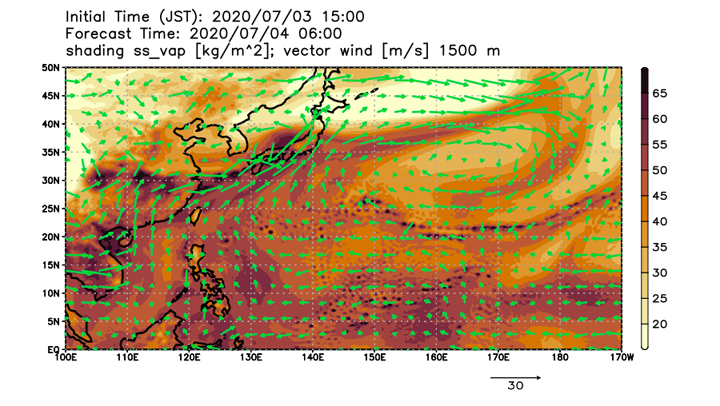
In order to analyze the atmospheric field this time, numerical simulations of horizontal grid spacing 14 km were conducted using NICAM-LETKF JAXA Research Analysis (NEXRA) together with JAXA/EORC and Prof. Masaki Satoh’s research group in Atmosphere and Ocean Research Institute, the University of Tokyo. NEXRA has been jointly developed by JAXA, the University of Tokyo and RIKEN. NEXRA is calculated by an atmospheric data assimilation system using large scale computational performance of JAXA supercomputer. It has an advantage of improving weather prediction accuracy by assimilating rainfall data from Global Satellite Mapping of Precipitation (GSMaP). NEXRA makes it possible to provide the weather information such as tropospheric wind vector information, which is difficult for satellite observation to obtain directly. Regarding the detail of NEXRA, please refer to the article “Challenges in Typhoon Track Predictions~ Typhoon KROSA (TY1910) in 2019” on “Seen from Space 2020”.
Figure 1-3 shows the simulation result of vertically integrated water vapor of the atmosphere (color; kg/m2) and the wind field (arrow; m/sec) at 1500 m above the ground at 06:00 (JST) on July 4, 2020. The simulation results well represent the large amount of water vapor over the southwest coast of Kyushu Island (July 2-7, 2020 (JST)) as captured by “SHIZUKU”. At the same time, it shows the condition that water vapor was flowing into the vicinity of Japan by atmospheric flows from the East China Sea, mainland China and the southern oceans. From the results of this simulation, it assumes that the large amount of water vapor inflow over several days led to a prolonged period of heavy rainfall in the Kyushu region.
Observation of precipitation amount with rainy front and localized heavy rainfall
How much precipitation was being observed by satellite during this period? Analysis was conducted by using observation data from Global Satellite Mapping of Precipitation (GSMaP). Figure 2-1 shows the time change of precipitation (Fig. 2-1, top) and accumulated precipitation amount (Fig. 2-1, bottom) over July 2-7, 2020 (JST) by Global Satellite Mapping of Precipitation (GSMaP). Looking at the time change of precipitation, the precipitation zone associated with the rainy season front extends not only around Japan, but also from east to west, including over the sea. Around Kyushu region, a series of rain clouds were developing and moving west to east, bringing intermittent heavy rainfall around Kyushu. Total rainfall amount shows that more than 500 mm of rain has been observed over a wide area of Kyushu during the first five days of rainfall since July 2.
Figure 2-1. Temporal change of hourly precipitation amount [mm/h] (top) and accumulated precipitation amount [mm] (bottom) by Global Satellite Mapping of Precipitation (GSMaP) during July 2-7, 2020 (JST).
Adding to the regional scale observation of rainfall distribution by GSMaP, the three-dimensional structure of precipitation from space can be observed with much circumstance by Dual-frequency Precipitation Radar onboard Global Precipitation Measurement Core Observatory. Figure 2-2 shows the three-dimensional structure of heavy precipitation associated with localized heavy rainfall distributed around Kyushu as observed by the rain cloud scan radar on July 24, 2020. We can see that heavy rains are being observed again around Kyushu, including the disaster areas by the heavy rains in early July.
Figure 2-2. Three-dimensional structure of the localized heavy rainfall that occurred in the Kyushu region at around 7:00 a.m. on July 24, 2020.
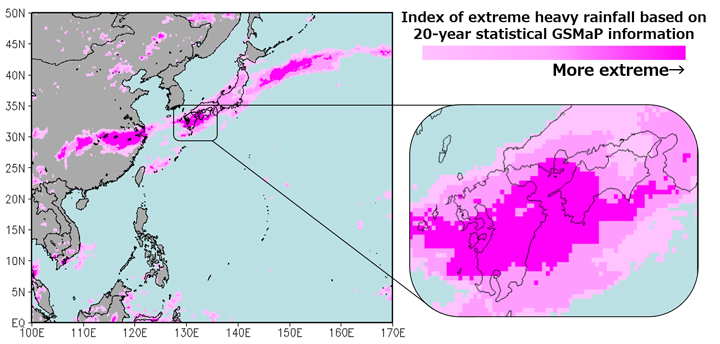
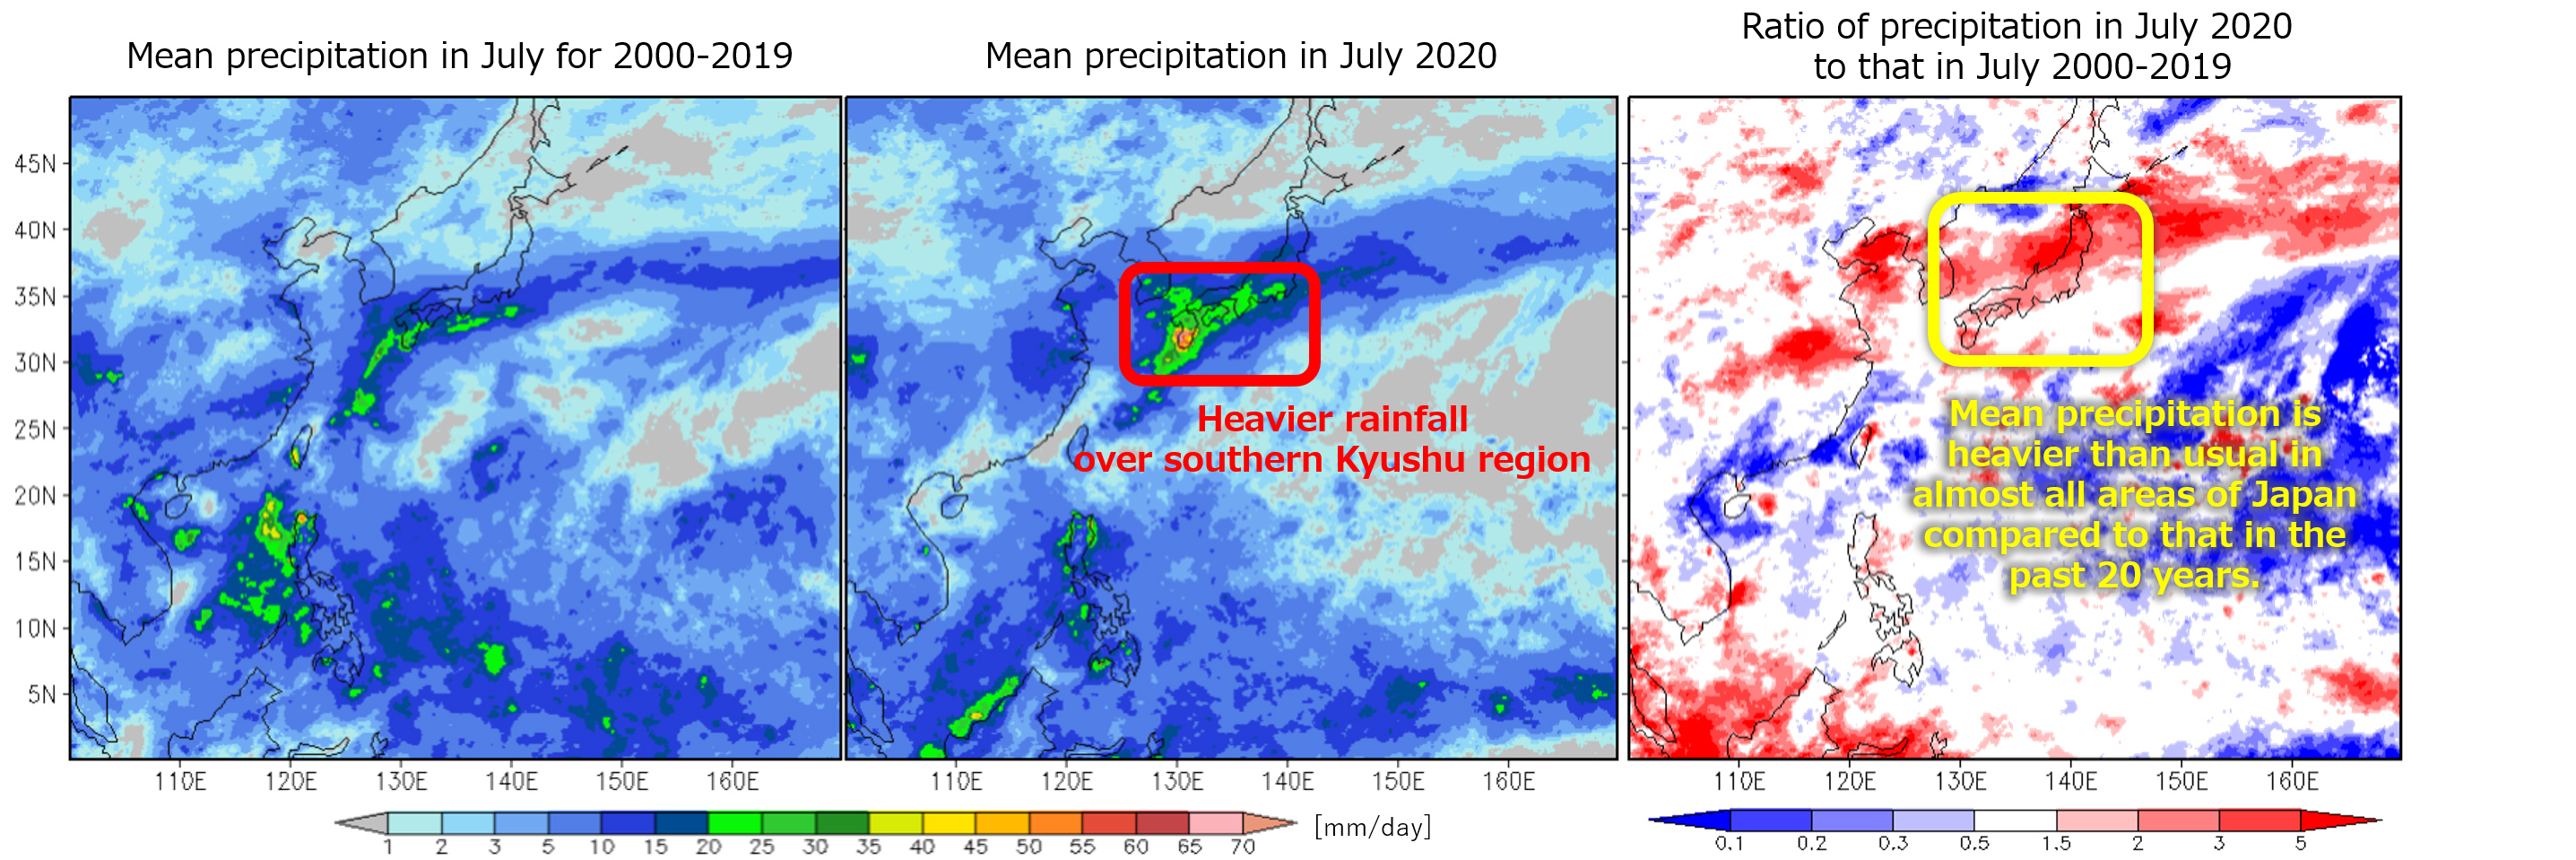
Figure 2-3 shows the heavy rainfall index obtained by statistically analyzing GSMaP. The pink area shows how extremely wet the July 1-7 of 2020 (UTC) was compared to the average precipitation amount during July 1-7 (UTC) for the past 20 years, capturing the strong heavy rainfall trend around Kyushu.
The rainy season front moved north and south around Japan and continued to stagnate, causing intermittent heavy rainfall in many areas. Therefore, we can confirm that even the amount of precipitation for a month shows difference from previous years. Comparison of precipitation in July 2020 (Fig. 2-4, middle) and the average precipitation in July of the past 20 years (Fig. 2-4, left) shows that July this year brought much more rainfall, especially around Kyushu. In addition, even after the early July shown in Figures 2-1 and 2-3, it rained more than twice as much rainfall over a wide area of Japan as the average for July in the past 20 years in July 2020. One of the reasons is the intermittent heavy rainfall in various areas including the Chubu region and Yamagata Prefecture in mid- to late July. Especially in the Tohoku region, this year’s rainfall was more than five times as much in some areas, for the average rainfall over the past 20 years has not been as high as in Kyushu and other areas.
Flood risk estimation of terrestrial hydrological simulation system “Today’s Earth”
By GSMaP, we can see where and how much rain is falling. From the perspective of disaster prevention, it is important to provide information not only on the amount and location of rainfall, but also when and where that rainwater collects, and whether there is an actual risk of river flood or not. For this purpose, it is necessary to conduct simulations to calculate and estimate the water cycle on land.
JAXA has developed “Today’s Earth – Japan” (TE-Japan) cooperating with the University of Tokyo. It is the simulation system of terrestrial water cycle. It is possible for TE-Japan to estimate water related variables such as river discharge, flooded area, etc. all over Japan. Figure 3-1 shows an animation of flooded area fraction in Japan estimated by TE-Japan from July 3 to 6, 2020. This estimated result shows the flood risk of rivers in Japan, color-coded by time. We can see how the flood risk increases in Kyushu, Shikoku, Kinki, Tokai, Shinshu, and Kanto regions and so on. Especially, we found that the risk of flooding brought by this localized heavy rainfall event could be estimated qualitatively, as high risk levels were calculated on July 3 and 4 toward the Kuma River in Kumamoto and Yatsushiro Cities, which is downstream of the Kuma River, where heavy damage actually occurred. TE-Japan is conducting real time operation, and everyone can confirm the current river situation in Japan through webpage without time lag. We will proceed further validation of the prediction toward water related disaster mitigation.

Estimation of inundated area due to river flood
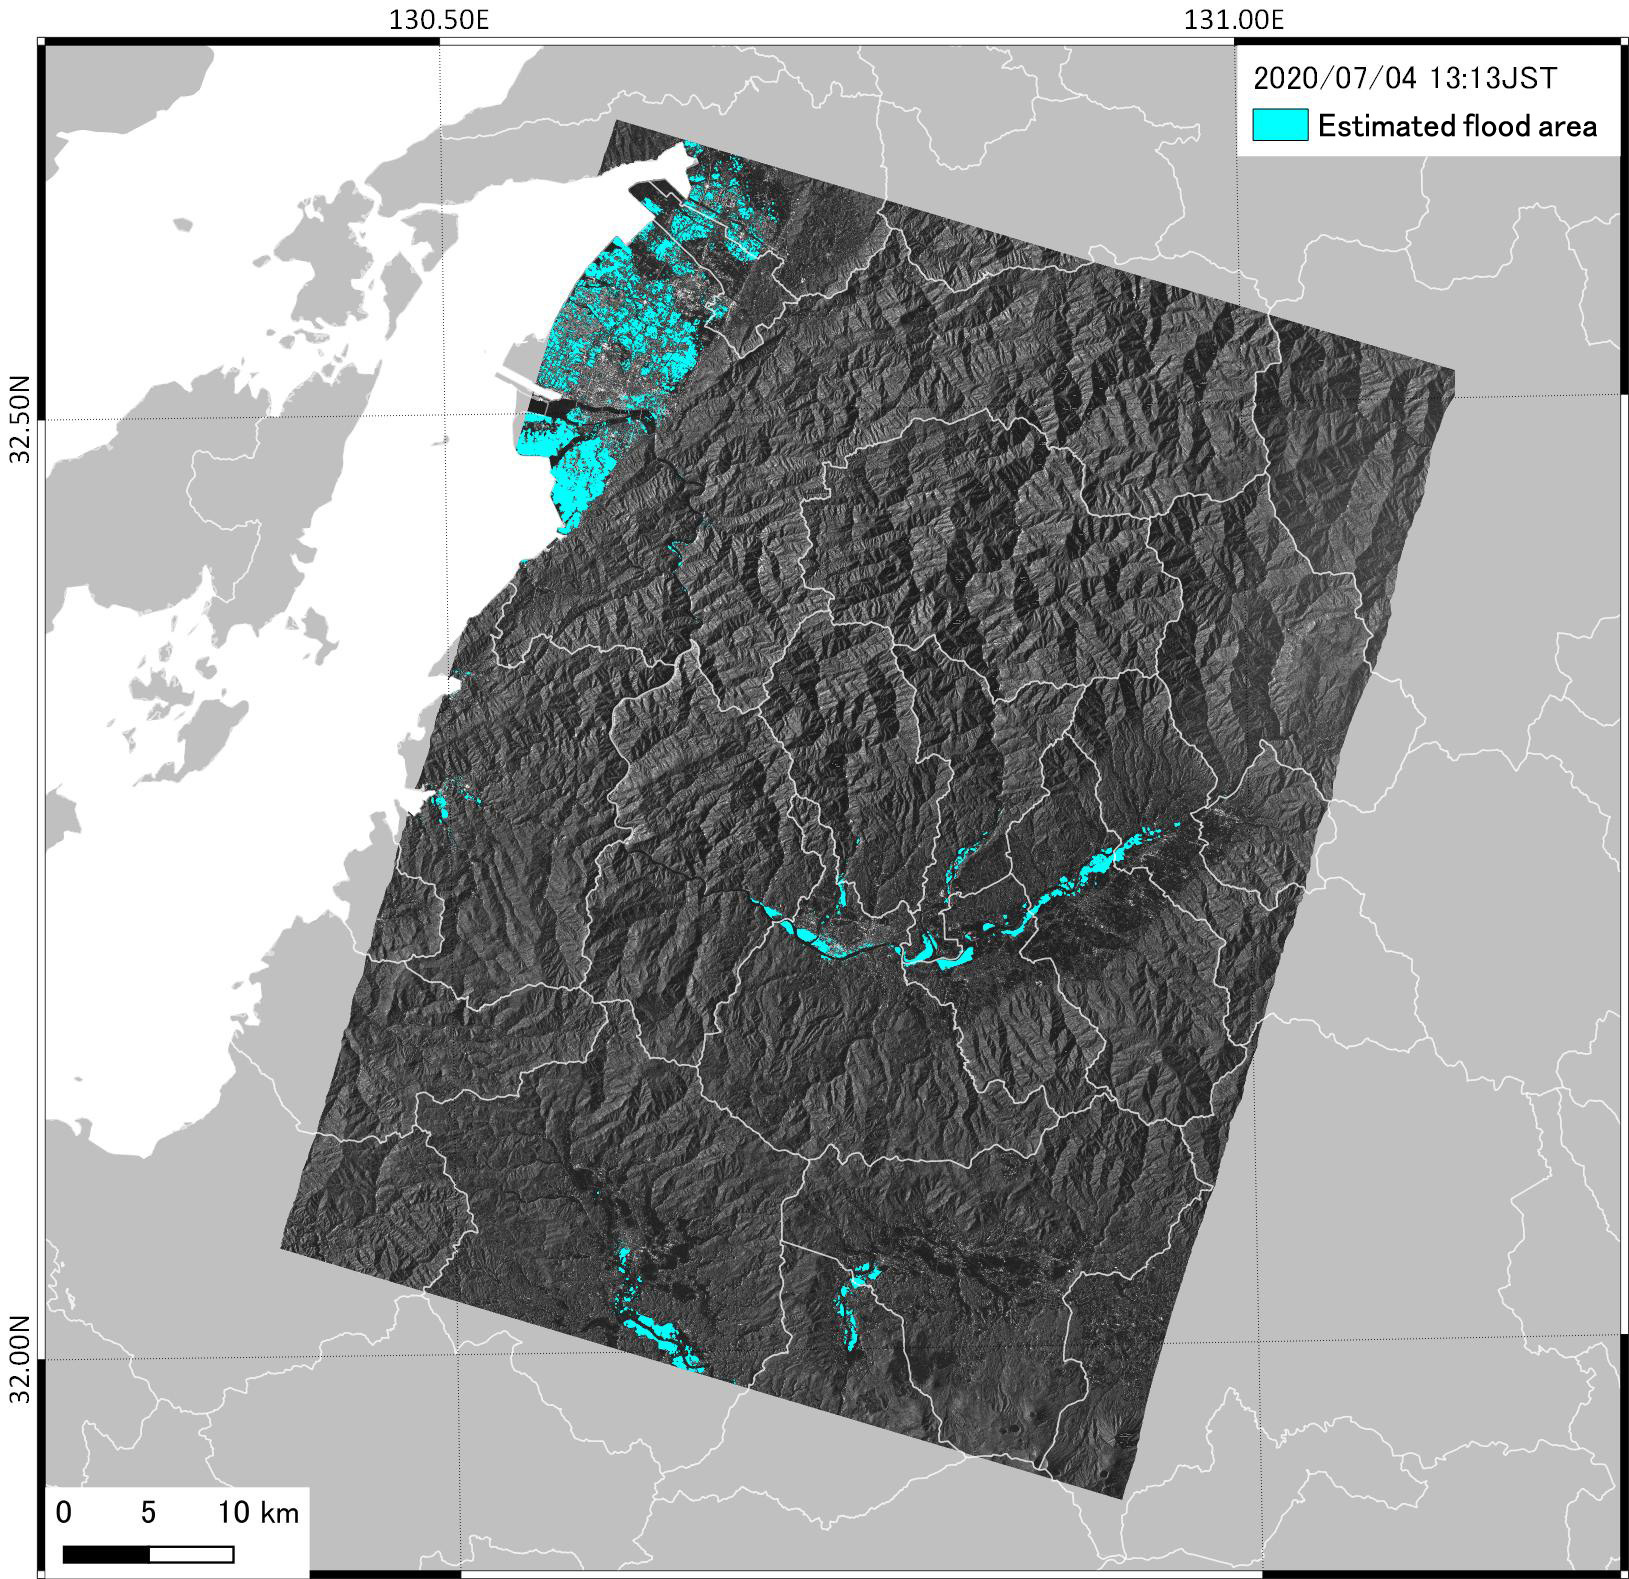
River flood forecasting information by “TE-Japan” is also used in the analysis of satellite data for inundation area estimation. As a result of the extreme rains that began on July 3, rivers overflowed, and landslides occurred mainly in Kumamoto on July 4. JAXA conducted emergency observations by the Phased Array-type L-band Synthetic Aperture Radar-2 “PALSAR-2” onboard the “DAICHI-2” (ALOS-2) at 1:13 p.m. on July 4, at 0:04 a.m. on July 5, and at 12:18 a.m. on July 6 (all JST), based on a request from the Ministry of Land, Infrastructure, Transport and Tourism (MLIT). We estimated the inundation areas caused by the recent heavy rain and river flood and provided the results to MLIT and other disaster prevention organizations.
Figure 4-1 shows the inundation areas in light blue estimated from the observation data by PALSAR-2 images taken at 1:13 p.m. on July 4, 2020. The inundation area was automatically estimated by combining PALSAR-2’s emergency observation data, past data observed so far, and TE-Japan’s inundation area ratio data. This result has the possibility to contain the change of surface of the ground, for example, natural waterlogging from farmland and so on which is not directly relates with river flooding this time. Same analysis has been conducted for emergency observation data captured by PALSAR-2 on July 5 and 6.
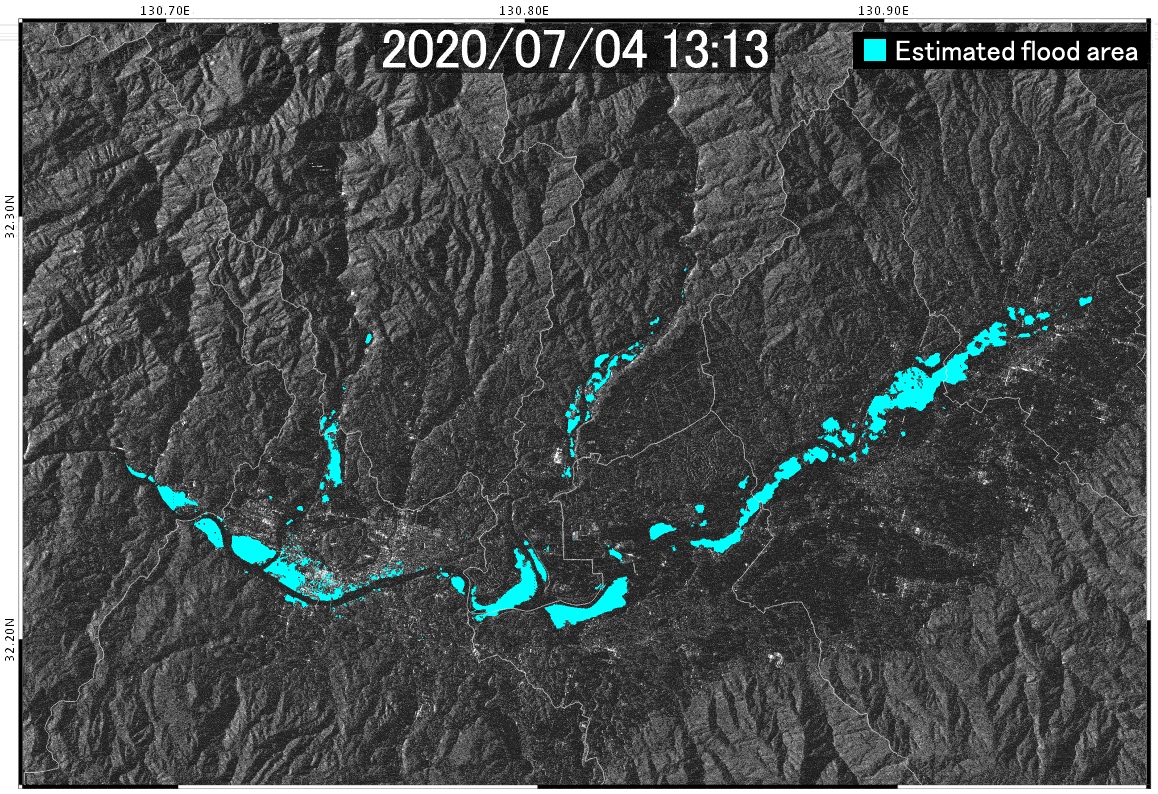
Figure 4-2 is an animation regarding the enlarged inundation areas around Hitoyoshi City and Kuma County, Kumamoto Pref., estimated from the PALSAR-2 observation data for the past three days. We can see that the inundation area is shrinking as time proceeds. Note that the reason especially the mountain slopes in Figure 4-2 look stretched is because the PALSAR-2 image was processed to fit the map, not because it captured the actual scene.
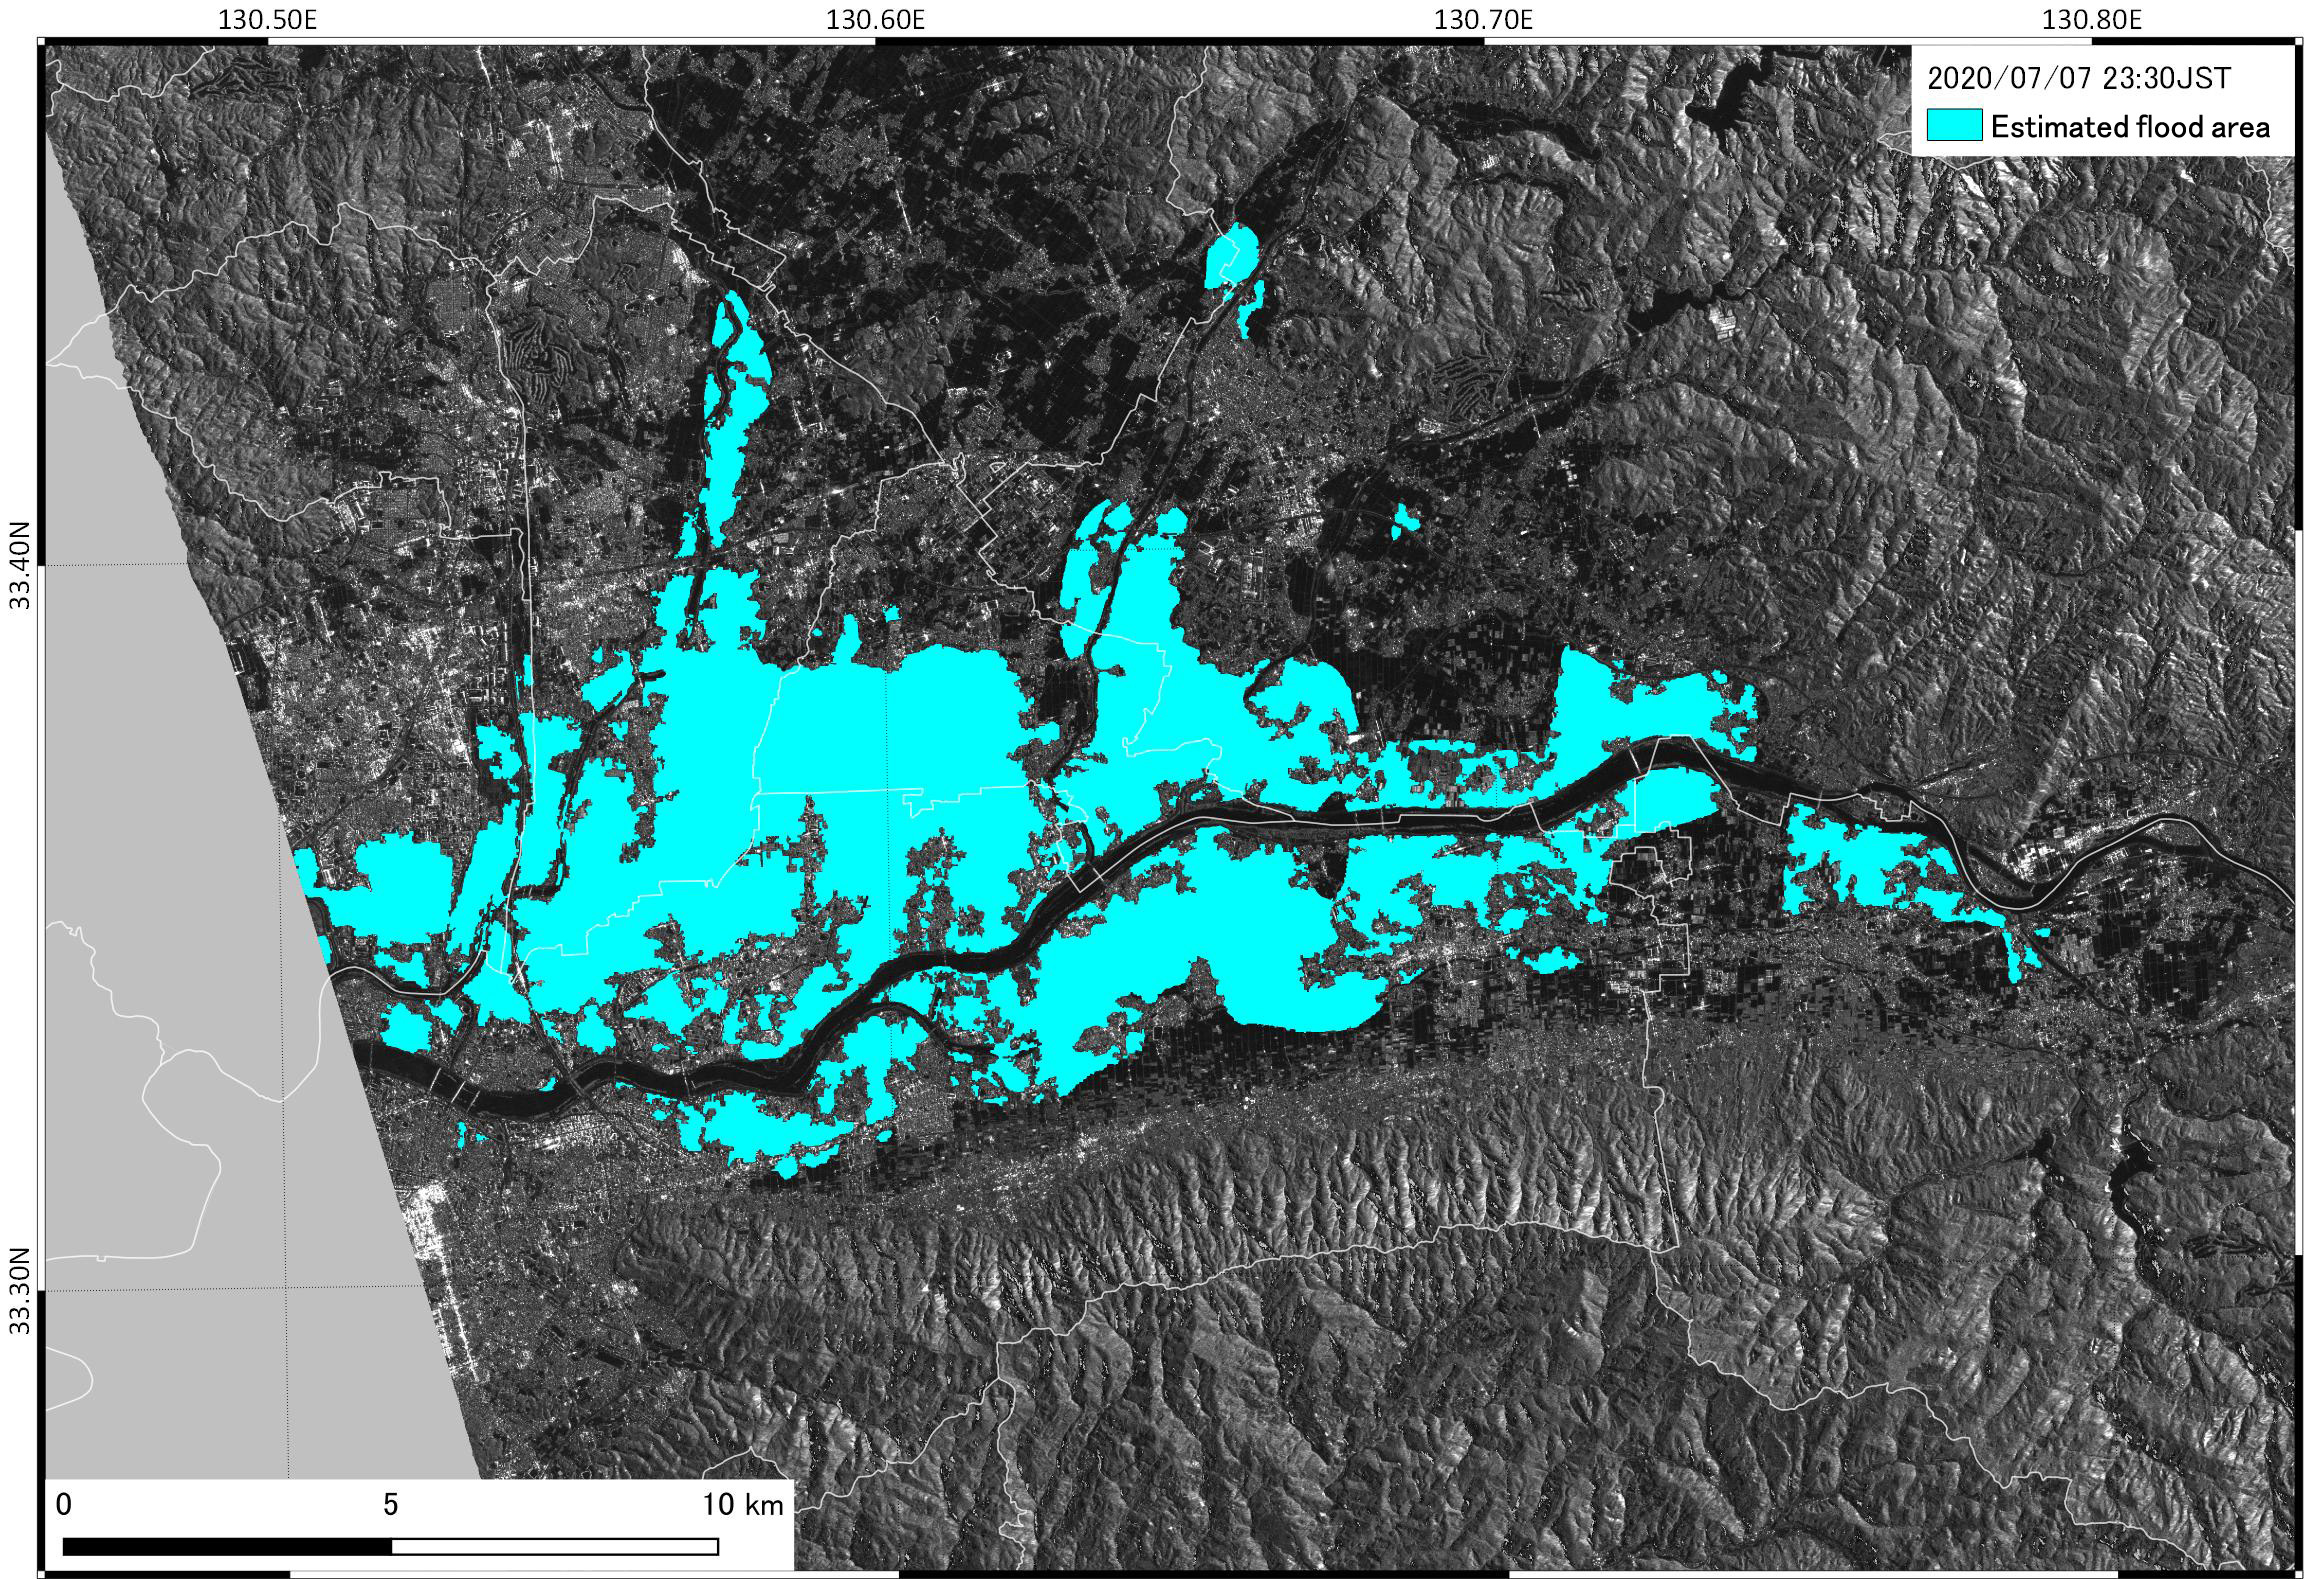
Similarly, Figure 4-3 is an enlarged image of the inundation area (light blue) around Kurume City, Ogori City, Tachiarai Town, and Asakura City in Fukuoka, which was estimated by PALSAR-2 data at around 23:30 on July 7, 2020 (JST). It is possible for Synthetic Aperture Radar (SAR), which uses microwaves, to make such observations even at night.
Decreasing the amount of solar irradiance due to the continual rainy weather
Because it has been raining since the beginning of July 2020, there are concerns about the influence on the growth of food crops with lack of solar irradiance compared to normal years. Satellite observation makes it possible to observe the solar irradiance broadly and homogeneously.
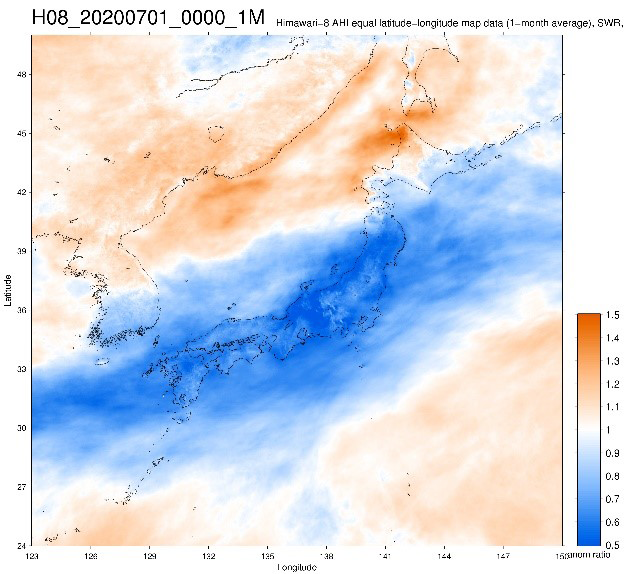
Figure 5-1 shows the anomaly in comparison to previous years regarding solar irradiance around Japan estimated by observation of the meteorological satellite “Himawari-8”. It shows the ratio of the average value for July 1-15, 2020 to the average value for its period from 2015 to 2019. Blue color areas indicate less solar irradiance this year, red indicates more irradiance. Figure 5-1 shows that most of the area in Japan from Kyushu to the northeast, experienced a decrease in solar irradiance in July 2020.
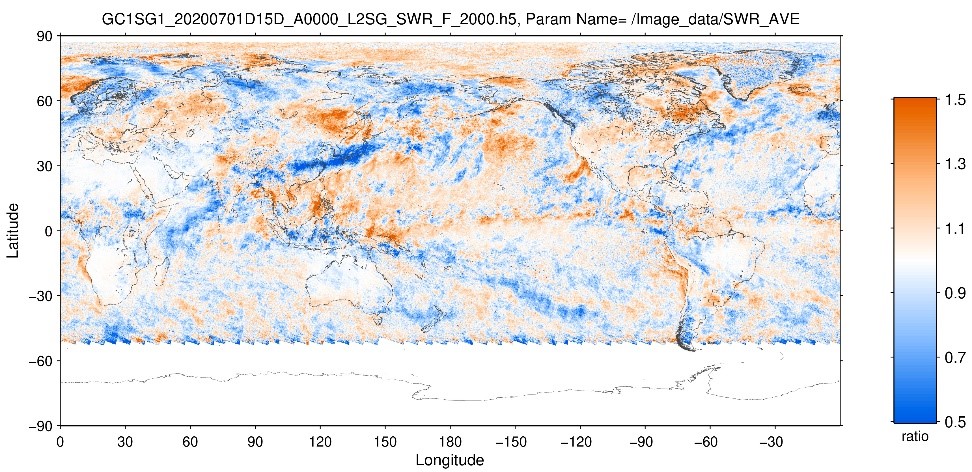
It is effective to use polar-orbiting earth observation satellites for a global view. Figure 5-2 shows the anomaly of global solar irradiance estimated by observation data from Second generation GLobal Imager (SGLI) onboard Global Change Observation Mission – Climate “SHIKISAI” (GCOM-C). Here, it shows the ratio of the average value for July 1-15, 2020 to the average value for June 16-July 31, 2018-2019. Looking at Figure 5-2, a wide area from east to west around Japan shows a dark blue color around 0.5 (corresponding to 50 %) in solar irradiance in early July this year, which almost corresponds to the area of high water vapor observed by “SHIZUKU” (the lower part of Figure 1-2). It indicates that there was a remarkable decrease in solar irradiance on a global scale. The solar irradiance represents the solar radiation energy that actually reaches the earth’s surface, including sunlight that penetrates through clouds on cloudy days, thus the amount of decrease mentioned at above is smaller than sunshine duration (hours of direct sunlight). Still, it is an important parameter as a quantitative information related to the heat budget of the earth’s surface and photosynthesis in plants.
JAXA/EORC will continue to utilize the data obtained from various earth observation satellites, “SHIZUKU”, “SHIKISAI”, “GPM Core Observatory”, “DAICHI-2” etc. and the information by integrated dataset with multi-satellites and/or models, GSMaP, TE-Japan, and NEXRA etc. As described above, we will conduct the researches to provide the information that leads to disaster prevention and disaster mitigation as well as to contribute to the understanding of earth science fields such as water cycle research on the earth.
Explanation of the Images
Figures 1-1 and 1-2
| Satellite | Global Change Observation Mission – Water “SHIZUKU”(GCOM-W) |
| Sensor | Advanced Microwave Scanning Radiometer 2 (AMSR2) |
| Date | June, 2020(Figure 1-1. Top line) July, 2020(Figure 1-1. Bottom line) June, 2020(Figure 1-2. Top line) July, 2020(Figure 1-2. Bottom line) |
Figure 2-1
| Satellite | Global Precipitation Measurement Core Observatory(GPM Core Observatory) |
| Sensor | Global Satellite Mapping of Precipitation(GSMaP) |
| Date | July 2-7, 2020 (JST) |
Figure 2-2
| Satellite | Global Precipitation Measurement Core Observatory(GPM Core Observatory) |
| Sensor | Dual-frequency Precipitation Radar(DPR) |
| Date | July 24, 2020 around 07:00 |
Figures 4-1, 4-2, and 4-3
| Satellite | Advanced Land Observing Satellite-2 “DAICHI-2” (ALOS-2) |
| Sensor | Phased Array type L-band Synthetic Aperture Radar-2(PALSAR-2) |
| Date | July 4, 2020 around 13:13(Figure 4-1) July 4, 2020 13:13, July 5 00:04, July 6 12:18 (Figure 4-2) July 7, 2020 around 23:30 (Figure 4-3) |
Figure 5-1
| Satellite | Geostationary Meteorological Satellite “Himawari-8” |
| Sensor | Advanced Himawari Imager(AHI) |
| Date | July 1-15, 2020 |
Figure 5-2
| Satellite | Global Change Observation Mission – Climate “SHIKISAI”(GCOM-C) |
| Sensor | Second generation GLobal Imager(SGLI) |
| Date | July 1-15, 2020 |
Related Sites
Search by Year
Search by Categories


Tags
-
#Earthquake
-
#Land
-
#Satellite Data
-
#Aerosol
-
#Public Health
-
#GCOM-C
-
#Sea
-
#Atmosphere
-
#Ice
-
#Today's Earth
-
#Flood
-
#Water Cycle
-
#AW3D
-
#G-Portal
-
#EarthCARE
-
#Volcano
-
#Agriculture
-
#Himawari
-
#GHG
-
#GPM
-
#GOSAT
-
#Simulation
-
#GCOM-W
-
#Drought
-
#Fire
-
#Forest
-
#Cooperation
-
#Precipitation
-
#Typhoon
-
#DPR
-
#NEXRA
-
#ALOS
-
#GSMaP
-
#Climate Change
-
#Carbon Cycle
-
#API
-
#Humanities Sociology
-
#AMSR
-
#Land Use Land Cover
-
#Environmental issues
-
#Quick Report
-
#GOSAT-GW
Related Resources


Related Tags
Disaster Related Articles
-
 Disaster 2025.10.23 Thu ALOS-2 Observations of the Earthquakes in the Philippines
(Cebu Island and Mindanao Island) -
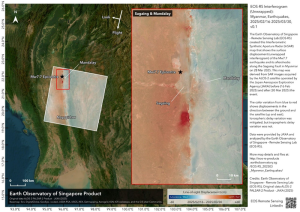 Disaster 2025.04.04 Fri ALOS-2 Observation of the M7.7 Earthquake in Myanmar
 -
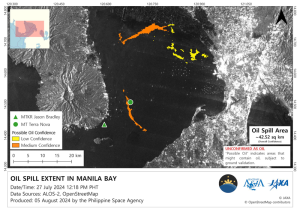 Disaster 2024.09.09 Mon ALOS-2 Observation of the Oil Spill Caused by the Sinking of a Tanker in Manila Bay, Philippines
 -
 Disaster 2023.04.07 Fri ALOS-2 observation: Oil spill from sunken oil tanker off Mindoro Island, Philippines (follow-up report)
Stay Connected
