


Latest Observation
2019.05.14 Tue
Detecting the spring leaf expansion in the Japanese archipelago captured by GCOM-C
The season has arrived, and in mid-May 2019, when we can witness the poetic scenes of farmers picking tea and planting rice.
In April, cherry blossoms started blooming later than last year in most parts of Japan, from the southern Tohoku to Kyushu regions. Despite the concern over the late cherry blossoms blooming, a sign of chilly spring, we witnessed the usual, beautiful new greenery following the rapid temperature rises in May. This report presents the spring leaf expansion in Japanese forests, a phenomenon captured by GCOM-C, which is capable of high-frequency observation at 250m resolution.
Figure 1 illustrates the vegetation color changes of the Japanese archipelago from April to May 2019, detected by the Second generation GLobal Imager (SGLI) onboard GCOM-C. This time-series animation shows the deciduous forest area as brown and green before and after the leaf expansion seasons, respectively. Also, we can see that the green leaf-expanded areas gradually spread into the mountainous regions of eastern Japan.
Figure 2 is the other SGLI observation images capturing the leaf expansion around Toyama Prefecture in spring in 2019. As you can see, the snow melts, and leaves emerge toward the mountain regions from April (left image) to May (right image). According to the national vegetation survey by Biodiversity Center of Japan, the dark green colored area (arrow A in a left image) corresponds to evergreen conifer forests. The area kept its color until May (see right arrow A). The brown-colored area corresponds to deciduous broadleaved forests of oak and beech (left arrow B). The area changed its color to light green in May (right arrow B) due to the leaf expansion in deciduous broadleaf forests.
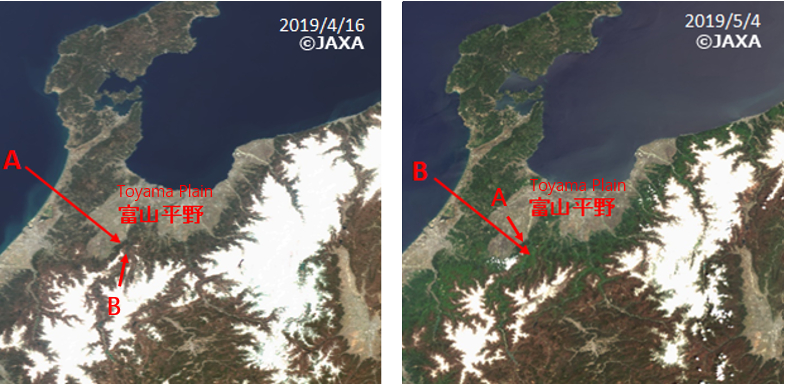
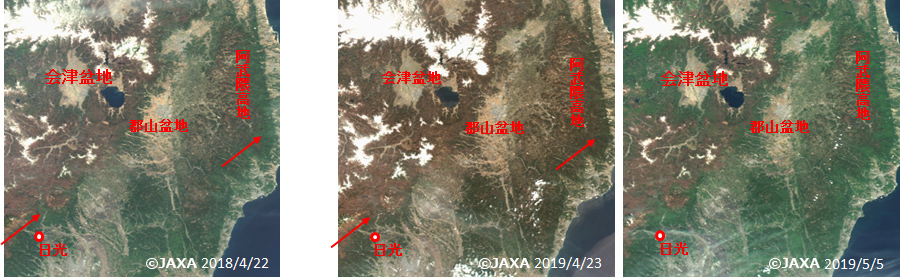
Figure 3 shows two years’ worth (2018–2019) of SGLI images in spring around Fukushima Prefecture in Japan. As you can see from the images in 2019 (center and right images), the leaves are gradually expanding, and the snow is melting. On the other hand, a closer look at the left and center images (April 2018 and April 2019, respectively) reveals a yearly difference in spring phenology. The proportion of green areas in the Abukuma Highlands and mountains in the northern Kanto region was smaller than in April 2018 (for example, compare the green proportion around red arrows), suggesting that the leaf expansion stage was less advanced than last year. According to information on cherry blossom bloom by the Japan Meteorological Agency, the full bloom date of cherry trees in the cities in this region (Fukushima, Mito, Utsunomiya, and others) was 6 to 11 days later than last year. Thus, the spring leaf expansion phenology in this region might have been later than last year, as well as the blooming of cherry blossoms.
JAXA provides GCOM-C data, such as the vegetation indices (NDVI and EVI) corresponding to vegetation density and health, and the leaf area index (LAI), which indicates leaf area per unit ground. We will continue to create and provide data that will help elucidate the mechanisms of carbon-cycle change and improve the accuracy of numerical climate models.
Description of the used satellite data in Figure 1-3
Target area

| Satellite | Global Change Observation Mission – Climate “SHIKISAI” (GCOM-C) |
|---|---|
| Sensor | Second generation GLobal Imager (SGLI) |
| Date |
Figure 1 : April-May, 2019 Figure 2: April 16, 2019 (left) and May 4, 2019 (right) Figure 3: April 22, 2018 (left), April 23, 2019 (middle), May 5, 2019 (right) |
Related links
Search by Year
Search by Categories


Tags
-
#Earthquake
-
#Land
-
#Satellite Data
-
#Aerosol
-
#Public Health
-
#GCOM-C
-
#Sea
-
#Atmosphere
-
#Ice
-
#Today's Earth
-
#Flood
-
#Water Cycle
-
#AW3D
-
#G-Portal
-
#EarthCARE
-
#Volcano
-
#Agriculture
-
#Himawari
-
#GHG
-
#GPM
-
#GOSAT
-
#Simulation
-
#GCOM-W
-
#Drought
-
#Fire
-
#Forest
-
#Cooperation
-
#Precipitation
-
#Typhoon
-
#DPR
-
#NEXRA
-
#ALOS
-
#GSMaP
-
#Climate Change
-
#Carbon Cycle
-
#API
-
#Humanities Sociology
-
#AMSR
-
#Land Use Land Cover
-
#Environmental issues
-
#Quick Report
-
#GOSAT-GW
Related Resources


Latest Observation Related Articles
-
 Latest Observation 2026.06.05 Fri [Quick Report] Typhoon No. 6, “JANGMI”, brought heavy rain to Japan. – Results of satellite data analysis –
 -
 Latest Observation 2026.04.16 Thu [Quick Report] EarthCARE Captured the Eye of Typhoon Sinlaku
 -
 Latest Observation 2025.12.03 Wed [Quick Report] Analysis results from satellite precipitation data on the record-breaking heavy rainfall occurring in Southeast Asia in late November 2025
 -
 Latest Observation 2025.10.01 Wed [Quick Report] Hurricane Humberto “Eye” captured by EarthCARE satellite (Hakuryu)
Stay Connected
