


Meteorology and the Environment
2019.02.04 Mon
Air Particles in Indochina Captured by GCOM-C
The Global Change Observation Mission – Climate (GCOM-C) was launched from the JAXA Tanegashima Space Center in 2017, and has been successfully observing the Earth. We will introduce the state of air pollutants captured by GCOM-C.
Satellites can observe air pollutants on a large scale. JAXA’s GCOM-C is capable of observing atmospheric particles such as PM2.5 and dust on a global scale. In particular, the use of polarization measurement, which is one of the features of GCOM-C, makes it easier to detect small particles such as PM2.5 than before.
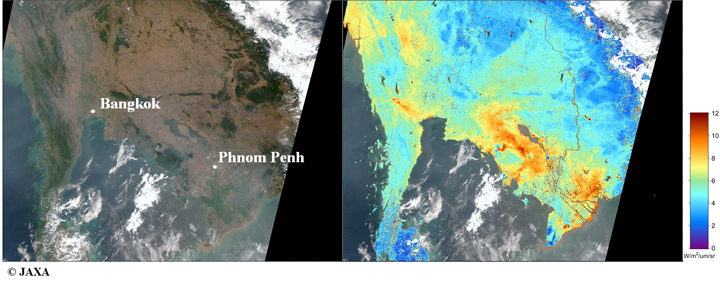
Figure 1 are images observed by GCOM-C at around 10:00 on January 29, 2019 (Indochina time). The left figure is an RGB image close to what the human eye sees (image with red, green, and blue band observation data allocated to RGB). The land of the right figure is a polarization image (polarization radiance (unit) W/m2/µm/sr). In the right figure, when the polarization radiance is high (shown by the red color), it indicates that the concentration of smaller particles is higher. At this date and time, high polarized radiance is observed from western and southern Thailand to southern Cambodia and Vietnam.
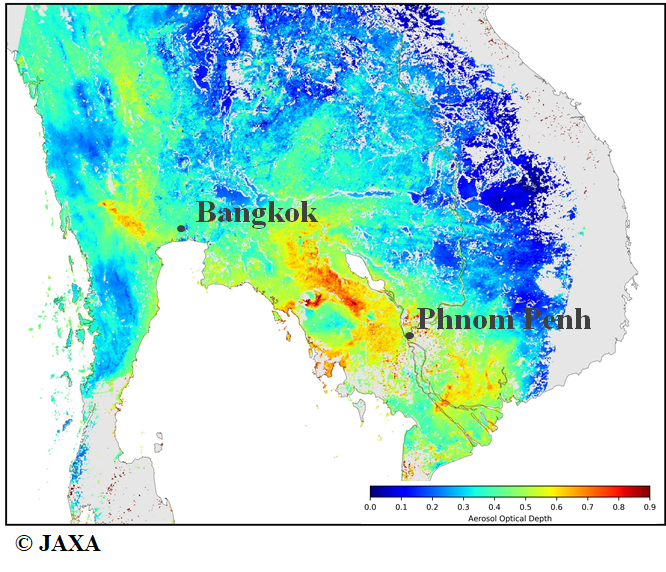
By analyzing the data observed by GCOM-C, the level of pollution caused by atmospheric particles can be measured quantitatively. Figure 2 shows the estimated atmospheric opacity, called “aerosol optical thickness”, at the same observation date and time as Figure 1. If the value is less than 0.1, the atmosphere is relatively transparent; if the value is close to 1.0, it is very turbid. The image shows a high value (from yellow to red) from the area around Bangkok, the capital of Thailand, to the area around Phnom Penh, the capital of Cambodia, we can see the detail distribution of atmospheric particles in over a very large area by GCOM-C.
The radiance data and aerosol optical thickness data introduced here are provided by JAXA’s Globe Portal System (G-Portal).
Observation images
Figures 1-2
| Satellite | Global Change Observation Mission – Climate “SHIKISAI” (GCOM-C) |
|---|---|
| Sensor | Second generation GLobal Imager (SGLI) |
| Date | Around 10:00 on January 29, 2019 (Indochina Time) |
Related information
Search by Year
Search by Categories


Tags
-
#Earthquake
-
#Land
-
#Satellite Data
-
#Aerosol
-
#Public Health
-
#GCOM-C
-
#Sea
-
#Atmosphere
-
#Ice
-
#Today's Earth
-
#Flood
-
#Water Cycle
-
#AW3D
-
#G-Portal
-
#EarthCARE
-
#Volcano
-
#Agriculture
-
#Himawari
-
#GHG
-
#GPM
-
#GOSAT
-
#Simulation
-
#GCOM-W
-
#Drought
-
#Fire
-
#Forest
-
#Cooperation
-
#Precipitation
-
#Typhoon
-
#DPR
-
#NEXRA
-
#ALOS
-
#GSMaP
-
#Climate Change
-
#Carbon Cycle
-
#API
-
#Humanities Sociology
-
#AMSR
-
#Land Use Land Cover
-
#Environmental issues
-
#Quick Report
-
#GOSAT-GW
Related Resources


Related Tags
Meteorology and the Environment Related Articles
-
 Meteorology and the Environment 2025.11.05 Wed The Breakup of the World’s Largest Iceberg, “A23a”: The Trajectory of Iceberg A23a Observed by “GCOM-W”, “ALOS-2”, “ALOS-4” and the Latest Satellite, “GOSAT-GW”
 -
 Meteorology and the Environment 2025.10.02 Thu Satellite Observations and Flood Forecasts for Line-shaped Rainbands in August 2025
 -
 Meteorology and the Environment 2025.05.20 Tue February 2025: Global Sea Ice Extent Reaches its Lowest in the History of Satellite Observations
 -
 Meteorology and the Environment 2023.10.11 Wed Climate Change 2023 (2) : Antarctic Winter Sea Ice Extent Lowest Ever Recorded
Stay Connected
