


Meteorology and the Environment
2019.01.18 Fri
Japanese Satellites Contribute to Improving Accuracy of PM2.5 Concentration Prediction
From January 13 to 15, 2019, PM2.5 concentrations exceeded 100 micrograms per cubic meter over Seoul, South Korea. At the peak time of the concentration, visibility decreased to 2 to 3 km, and people were urged to refrain from unnecessary outdoor activities as well as public construction and transportation operations were restricted. Numerical simulations suggested that this high concentration is caused by not only air pollutants from local sources in Seoul, but also the transboundary air pollution from North China region. Along with the reduction of greenhouse gas emissions, substantial measures for air pollutants are also important.
On January 15 2019, PM2.5 concentrations became higher than normal in the Kyushu region, however, the level did not exceed the warning level (70 micrograms per cubic meter). This was thought to be due to the air pollutants from around China and South Korea were traveled and diluted across the ocean. Several forecasting systems of PM2.5 concentration are operated in Japan including SPRINTARS developed by Kyushu University and widely used by mass medias. However, SPRINTARS somewhat underpredicted the high concentration event in the Kyushu region in the case on January 15. Data from Japanese satellites is expected to improve accuracy of the prediction.
Observation of aerosols by GCOM-C and Himawari
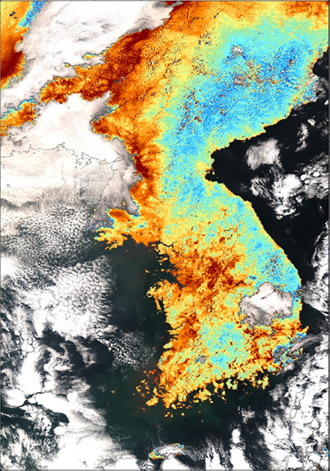
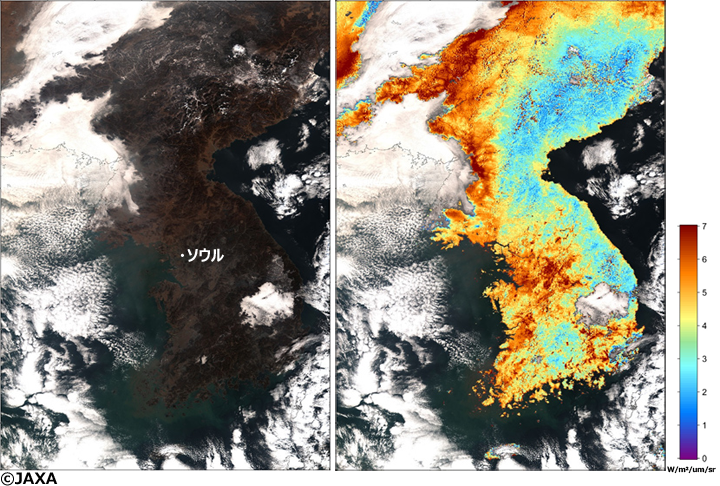
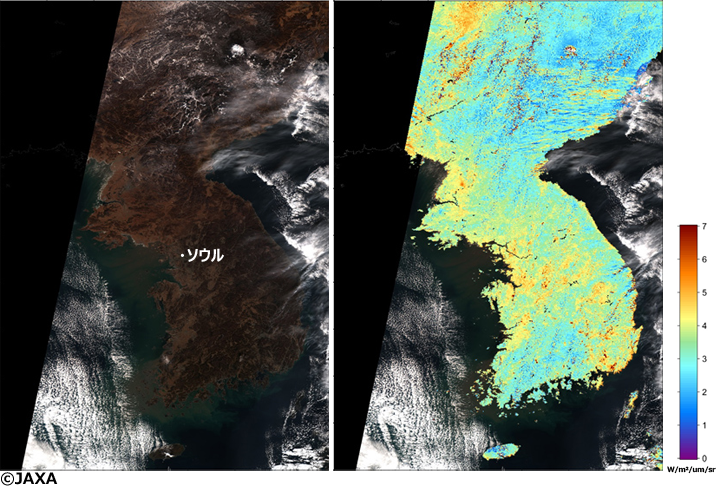
PM2.5 is a type of small floating particles in the atmosphere. Such the atmospheric particle can be measured on the ground, however, satellites have merit to be able to observe over a wide area. JAXA’s Global Change Observation Mission – Climate “SHIKISAI” (GCOM-C) is currently in operation, and it can observe the atmospheric particle quantitatively. One of the features of GCOM-C is an ability to measure polarized light, which makes it easier to capture small particles such as PM2.5. Figure 1 shows images observed by GCOM-C at around 11:00 am (Japan local time) on January 13 2019. The left image is a true-color RGB image, and the right one is a polarized radiance image over land areas (ocean and white cloud areas are the RGB image). In the right figure, the redder color corresponds to the higher concentration of small particles. We could clearly see the concentration of small atmospheric particle in the western side of the Korean Peninsula was higher on January 13 (Figure 1) than one on January 6 when the concentration of the particle was relatively low (Figure 2).
The Japan Meteorological Agency’s Himawari-8 satellite, which provides the cloud images in daily weather forecasts, can also observe atmospheric particles. It was difficult to observe atmospheric particles quantitatively until Himawari-7, however since Himawari-8, it became possible to measure the amount of atmospheric particles by many wavelengths of visible light. Conventional atmospheric particle observation by satellites has been conducted by polar-orbiting satellites, which can observe the entire Earth but only once a day. On the other, Himawari-8, a geostationary meteorological satellite, can observe atmospheric particles over the Asia-Oceania region every 10 minutes. Figure 3 shows the movement of atmospheric particles captured by Himawari-8 on the same day as Figure 1. Every 10 minutes observations allow to capture the transport of atmospheric particles in detail. Figure 3 shows that atmospheric particles are flowing from the northwest to the southeast. This indicates that atmospheric particles are accumulating behind the trough (cold front) and flowing with the southeastward movement of the trough.
Improving the accuracy of PM2.5 predictions using Japanese satellites
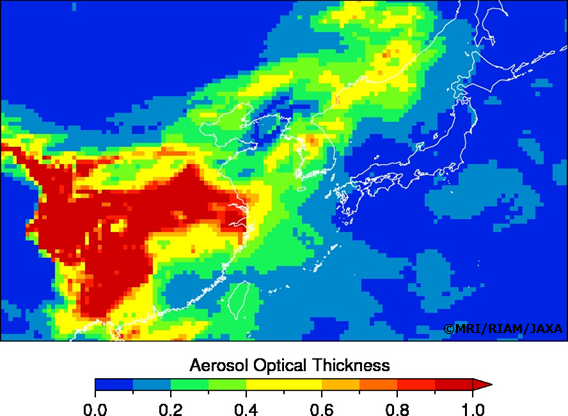
Observations by GCOM-C, Himawari-8, and other satellites have enabled us to reach a detailed understanding of the atmospheric particles. These satellite data are no longer simply used to monitor the concentration, but become to be used as input for PM2.5 prediction models. Conventional forecasts of PM2.5 and yellow dust had been made based only on changes in weather conditions without using near real-time observation of the atmospheric particles. By inputting the observed concentration of atmospheric particles into the prediction system, it is possible to correct the nowcast concentration and improve the prediction accuracy. The process of inputting observed data into the prediction model is called “data assimilation”. In Japan, Kyushu University, JAXA, the Meteorological Research Institute of the Japan Meteorological Agency, and the National Institute for Environmental Studies are jointly developing data assimilation systems for atmospheric particles. Figure 4 shows an index of atmospheric particle concentration at 15:00 (JST) on January 14, as calculated by the assimilation system MASINGAR developed by this collaborative research project. Continuous satellite observations are essential to maintain and improve the accuracy of PM2.5 and yellow dust predictions using data assimilation. You can view this data on the “JAXA Himawari Monitor”.
(Written by Toshihiko Takemura, Kyushu University, Research Institute for Applied Mechanics, January 18, 2019; English translated by JAXA)
Explanation of the Images
Figs.1 and 2
| Satellite | Global Change Observation Mission – Climate “SHIKISAI” (GCOM-C) |
|---|---|
| Sensor | Second generation GLobal Imager (SGLI) |
| Date | Figure 1. January 13, 2019 at around 11:00 (JST) Figure 2. January 6, 2019 at around 11:00 (JST) |
Fig. 3
| Satellite | Geostationary meteorological satellite Himawari-8 |
|---|---|
| Sensor | Advanced Himawari Imager (AHI) |
| Date | January 13, 2019, around 10:00 – 16:00 (JST) |
Related information
SPRINTARS
JAXA Himawari Monitor
GCOM-C
Updates on Earth; Meteorology and the Environment
Search by Year
Search by Categories


Tags
-
#Earthquake
-
#Land
-
#Satellite Data
-
#Aerosol
-
#Public Health
-
#GCOM-C
-
#Sea
-
#Atmosphere
-
#Ice
-
#Today's Earth
-
#Flood
-
#Water Cycle
-
#AW3D
-
#G-Portal
-
#EarthCARE
-
#Volcano
-
#Agriculture
-
#Himawari
-
#GHG
-
#GPM
-
#GOSAT
-
#Simulation
-
#GCOM-W
-
#Drought
-
#Fire
-
#Forest
-
#Cooperation
-
#Precipitation
-
#Typhoon
-
#DPR
-
#NEXRA
-
#ALOS
-
#GSMaP
-
#Climate Change
-
#Carbon Cycle
-
#API
-
#Humanities Sociology
-
#AMSR
-
#Land Use Land Cover
-
#Environmental issues
-
#Quick Report
-
#GOSAT-GW
Related Resources


Related Tags
Meteorology and the Environment Related Articles
-
 Meteorology and the Environment 2025.11.05 Wed The Breakup of the World’s Largest Iceberg, “A23a”: The Trajectory of Iceberg A23a Observed by “GCOM-W”, “ALOS-2”, “ALOS-4” and the Latest Satellite, “GOSAT-GW”
 -
 Meteorology and the Environment 2025.10.02 Thu Satellite Observations and Flood Forecasts for Line-shaped Rainbands in August 2025
 -
 Meteorology and the Environment 2025.05.20 Tue February 2025: Global Sea Ice Extent Reaches its Lowest in the History of Satellite Observations
 -
 Meteorology and the Environment 2023.10.11 Wed Climate Change 2023 (2) : Antarctic Winter Sea Ice Extent Lowest Ever Recorded
Stay Connected
