
Latest Observation
2018.12.20 Thu
The Japanese archipelago in early winter captured by GCOM-C
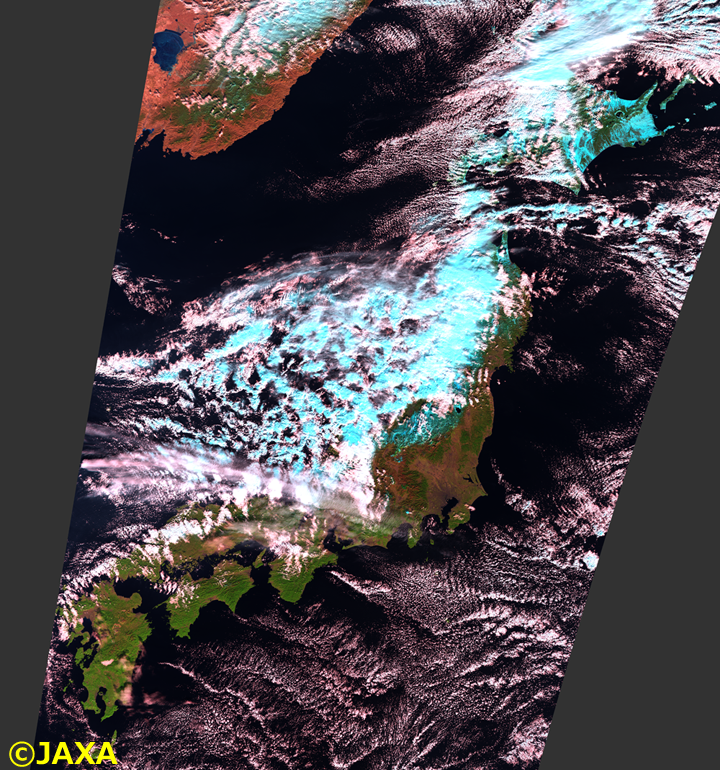
In Northen-Japan Sapporo, it was warmer than usual in 2018 as the first snowfall was recorded on November 20, the latest in a century. However, after late November, the Japanese archipelago has often been covered by winter pressure patterns, and the snow season has arrived at a stretch.
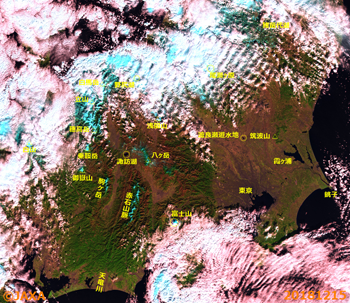
We can find the large snow-covered areas of the Japanese archipelago on December 19, 2018, from an image captured by the Second generation GLobal Imager (SGLI) onboard Global Change Observation Mission – Climate “SHIKISAI” (GCOM-C), which was launched from the Tanegashima Space Center on December 23, 2017 (Figure 1). The image was created as an SGLI false color composite using visible and short-wavelength infrared bands, with water clouds appearing in white, ice clouds and snow in light blue, vegetation in green, bare land in brown, and water surfaces in black. The Pacific side of the Japanese archipelago, western and eastern Japan, was covered with a clear sky under high atmospheric pressure, but the Sea of Japan side was covered with water and ice clouds. In addition, snow-covered areas (cyan-colored areas) can be seen in no-cloud-covered areas in eastern Japan and northern Japan Hokkaido.

Let’s examine Hokkaido and central Honshu using enlarged images at GCOM-C’s 250 m resolution.
Seasonal changes in Hokkaido
The seasonal change from autumn to early winter in 2018 in Hokkaido can be seen in false color images captured by GCOM-C (Figure 2).
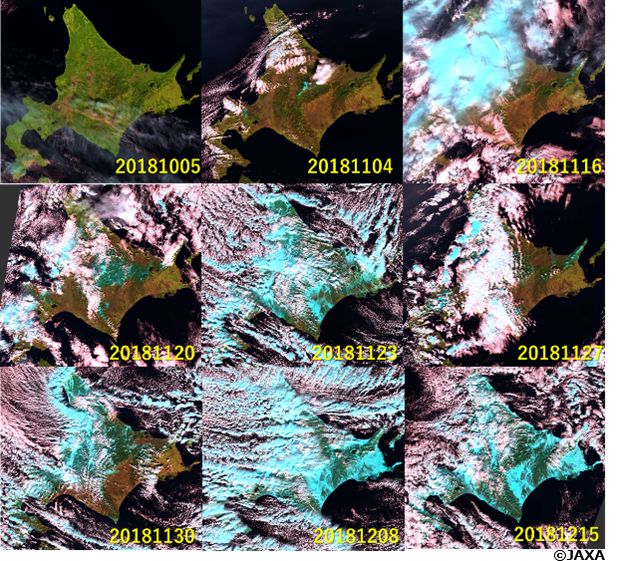
In early October, the plant kept its high activity; accordingly, green-colored areas spread widely on land. In November, the plant reduced its activity; the leaves began to change color. You can see that the green-colored areas changed to brown, indicating a bare soil surface (Figure 2). Look at an image on November 4. You can see the cyan-colored areas, indicating snow-covered areas, at the top of Mount Daisetsu. Likewise, you can find the snow-covered area on the top of Mount Rausu in Shiretoko on November 16. When the first snowfall was recorded in Sapporo city on November 20, a wide area from Mt. Daisetsu in central Hokkaido to Lake Kussharo was covered with snow (cyan color). Then, on November 23, the snow-covered areas rapidly spread throughout much of Hokkaido. The snow-covered areas on the plains temporarily disappeared on November 27-30 but recovered in December.
Seasonal changes in central Honshu
Let’s switch the target area to central Honshu (Kanto, Chubu, and Hokuriku). The following were the time series images captured by GCOM-C from September 19 to December 19, 2018 (see Figure 3).
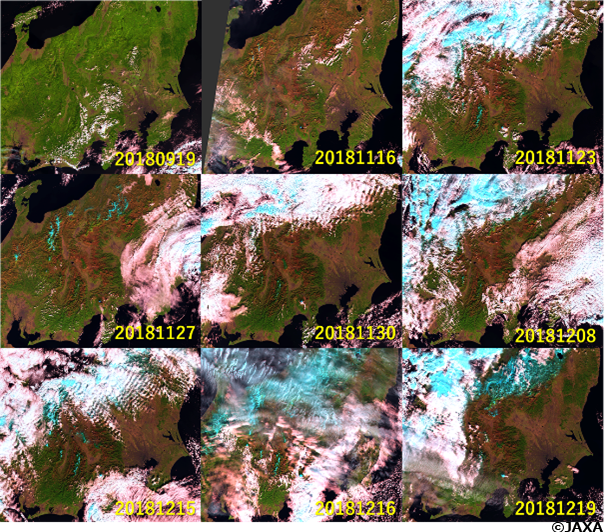
Figure 3. The time series of false-color images of central Honshu captured by GCOM-C from September 19 to December 19, 2018 (Color composition was assigned the same as in Figure 1).
In Honshu, deep-green areas widely spread in autumn (September 19), and in November, when the leaves changed to autumn color (red and yellow), brown-colored areas spread to the mountainsides. Until November 16, we found no snow anywhere except on the top of Mt. Fuji. On November 23, ice clouds covered the side of the Sea of Japan. On November 27, the clouds disappeared, and we can find that the mountains on the Sea of Japan side, such as the Northern Alps and Mt. Hakusan, were covered with snow. Since the side of the Sea of Japan side had been covered with clouds for a while, we could not catch the snow cover distribution from space. However, on December 16 and 19, we found snow-covered areas widely spread along the mountains on the side of the Sea of Japan. Meanwhile, looking at the Southern Japanese Alps (Akaishi Mountains and Mt. Komagatake), we can find the top of the mountains was covered with snow on November 23. The snow, probably resulting from a south-coast cyclone over the southern Sea of Japan around December 12, appeared again on December 15 after temporarily disappearing.
Distribution of land surface temperatures in central Honshu
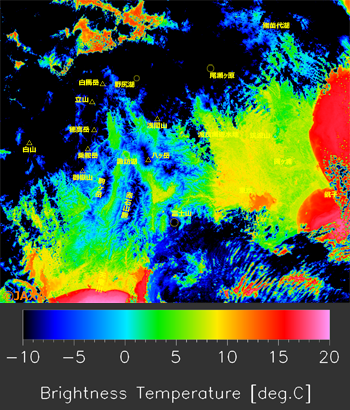
So far, we have seen changes in plant activity and snow cover distribution from reflected light from the ground surface (visible to short-wavelength infrared light) captured by GCOM-C. GCOM-C can also measure thermal infrared radiation emitted from the ground surface, enabling us to retrieve the distribution of the land surface temperature (or the cloud-top temperature for cloud-covered areas). See the right image of Figure 4, which is a thermal infrared image in the same area and time as Figure 3 on December 15 (the left image is the same as Figure 3 on December 15). We can see that the snow-covered mountain top was cold at -10℃ or lower, while the central Tokyo located on the plane was warmer around 8℃. Now, look at the water areas. The Pacific Ocean near the mouth of the Tenryu River was warm at approximiately20℃. In contrast, the temperature of Tokyo Bay was approximately 12℃, inland Lake Kasumigaura 7℃, and Lake Suwa over 750m above sea level 2℃.
Figure 4. Satellite images around central Honshu captured by GCOM-C on December 15, 2018. Left: A false-color image created using reflectance (Color composition was assigned the same as in Figure 1). Right: an image of brightness temperature created using SGLI TI01 (wavelength 10.8 µm), coloring using the color bar shown at the bottom of the image. Black and blue indicate low temperature, and white and pink indicate high temperature. Note that the brightness temperature is 1–3℃ lower than the actual surface temperature.
Release of GCOM-C observation data
In this way, GCOM-C could capture the seasonal changes in the distribution of vegetation, snow cover, and land surface temperature throughout the Japanese archipelago from autumn to early winter with a spatial resolution of 250 m at high frequency. GCOM-C, launched on December 23, 2017, has routinely been observing Japan and the globe since it captured the first images on January 1, 2018 and completed the initial functional verification tests on March 28.
The GCOM-C data, 28 physical products in vegetation, snow and ice, ocean, and atmosphere, are now released and freely available via JAXA’s Globe Portal System (G-Portal) (since December 20, 2018). For details about the data, please refer to G-Portal and the GCOM-C website. GCOM-C’s near real-time observation images are also available here.
JAXA continues GCOM-C observations to detect signs of climate change and various abnormal phenomena occurring on the Earth and accumulate observation data to understand climate change mechanisms.
Explanation of images
Figs. 1 to 4
| Satellite | Global Change Observation Mission – Climate “SHIKISAI” (GCOM-C) |
|---|---|
| Sensor | Second generation GLobal Imager (SGLI) |
| Date | (Fig. 1) December 19, 2018 (Fig. 2) October 5, November 4, November 16, November 20, November 23, November 27, November 30, December 8, December 15, 2018 (Fig. 3) September 19, November 16, November 23, November 27, November 30, December 8, December 15, December 16, December 19, 2018 (Fig. 4) December 15, 2018 |
Related information
G-Portal
GCOM-C
JAXA Satellite Monitoring for Environmental Studies (JASMES)
Public page for SGLI near-real-time observation images on JASMES
Updates on Earth; Latest Observation
Search by Year
Search by Categories
Tags
-
#Earthquake
-
#Land
-
#Satellite Data
-
#Aerosol
-
#Public Health
-
#GCOM-C
-
#Sea
-
#Atmosphere
-
#Ice
-
#Today's Earth
-
#Flood
-
#Water Cycle
-
#AW3D
-
#G-Portal
-
#EarthCARE
-
#Volcano
-
#Agriculture
-
#Himawari
-
#GHG
-
#GPM
-
#GOSAT
-
#Simulation
-
#GCOM-W
-
#Drought
-
#Fire
-
#Forest
-
#Cooperation
-
#Precipitation
-
#Typhoon
-
#DPR
-
#NEXRA
-
#ALOS
-
#GSMaP
-
#Climate Change
-
#Carbon Cycle
-
#API
-
#Humanities Sociology
-
#AMSR
-
#Land Use Land Cover
-
#Environmental issues
-
#Quick Report
Related Resources
Related Tags
Latest Observation Related Articles
-
 Latest Observation 2025.10.01 Wed [Quick Report] Hurricane Humberto “Eye” captured by EarthCARE satellite (Hakuryu)
 -
 Latest Observation 2025.02.28 Fri The world’s largest iceberg, A23a, may have run aground on the continental shelf of South Georgia:
The trajectory of iceberg A23a observed by “GCOM-W”, “ALOS-2” and “ALOS-4” -
 Latest Observation 2024.11.06 Wed [Quick Report] Heavy rainfalls in eastern Spain, as seen by the Global Satellite Mapping of Precipitation (GSMaP)
 -
 Latest Observation 2024.10.11 Fri Antarctic Winter Sea Ice Extent Second lowest in Satellite History


