


Research and Development
2018.11.07 Wed
Operation of “Ocean Weather Forecast” system using satellite sea surface temperature
JAXA has observed the Earth by satellites and provided various useful data. Combined use (or integration) of satellite data and numerical model enables to produce continuous data without missing area and geophysical parameters that cannot be obtained by the satellite. This is also recent global trend.
One of major example is improvement of accuracy of weather forecasts by assimilating satellite data into the numerical weather prediction models operated by the meteorological agencies. Recently, researches utilizing satellite data in various models are also in progress.
In this article, we introduce the latest research about collaboration between satellite data and ocean model, called “Ocean Weather Forecast.”
The “Ocean Weather Forecast” is developed by assimilating satellite-based sea surface temperature with the high-spatial resolution regional ocean model. It can provide not only vertical information under sea surface that cannot be observed by the satellite, but also forecast information.
On the other hand, ocean model is able to reproduce the more realistic ocean status by assimilating the satellite sea surface temperature data.
Overview and aim of “Ocean Weather Forecast”
The information obtained by the ocean observations of the satellite is limited to the sea surface distributions and does not include direct information about ocean currents. Therefore, in collaboration with the Japan Ocean Research and Development Organization (JAMSTEC), JAXA developed a capability to make “weather forecasts for underwater” near Japan, using a data assimilation system that synthesizes satellite sea surface temperature products provided by JAXA, and then outputs ocean models with high spatial-temporal resolution (about 3 km, hourly). Using this system, we can forecast up to about two weeks in advance with an update frequency of six days a week, excluding Saturdays. Data obtained by this ocean weather forecast will be released on the visualization site provided by JAXA, which was released today.
We increased spatial-temporal resolution of ocean model for the Ocean Weather Forecast to improve the reproducibility of small-scale variation in coastal area, although spatial-temporal resolution and update frequency of the existing regional (around Japan) ocean assimilation product operationally have provided by JAMSTEC is about 10km-daily and twice a week. Furthermore, we expect to obtain the more realistic ocean variation, using new ocean model including tidal effect and directly assimilating the satellite sea surface temperature data. Objective of the research is to enable better utilization of the satellite-based ocean information by providing high-spatial and -temporal resolution ocean analysis and forecast data frequently.
Through this activity, we expect to also hope to contribute to more efficient for fishery operations by the regular use of fisherman, researcher of fisheries science, and all people working in connection with ocean.
Assimilating satellite sea surface temperature data into the ocean model
Generally, data assimilation technology is a technique to obtain analytical values closer to actual values by combining output of numerical model with observation data such as satellite, ship, and buoy (Fig. 1). By using these more accurate analytical values as initial values for forecasting, more accurate predictions can be made. Data assimilation is a remarkable research field, with various assimilation methods being developed by researchers around the world. More sophisticated and complex assimilation methods become practical use, as computing abilities are increasing.
The ocean model used for the numerical calculation of this product is the high-resolution regional ocean model developed by JAMSTEC, named as JCOPE-T. This model was constructed for the purpose of investigating tidal phenomena on time scales of less than one day. Thus, the frequency of time in output is hourly. The target area is around Japan (117°E – 150°E, 17°N – 50°N), and the spatial resolution is a about 3 km (1/36 deg.) grid.
Assimilated observation data are the satellite sea surface temperature data obtained by four satellites (GCOM-W/AMSR2, Himawari-8/AHI, GPM main satellite/GMI, and Coriolis/WindSat), which are developed by the JAXA Earth Observation Research Center, satellite sea surface height data and in situ data (temperature and salinity) obtained by ships and buoys.
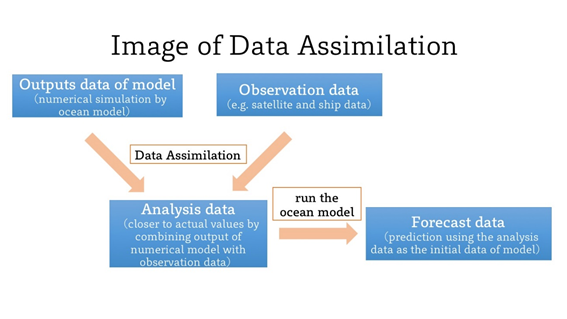
Figure 1: General flow chart of data assimilation and forecast
An example of “Ocean Weather Forecast”
One of the advantages of using this ocean data assimilation system is its ability to interpolate “strong wind area” and “heavy rain area” which are difficult to detect the sea surface conditions by satellite, and “cloud covered area” which is difficult to observe by high-resolution (several km scale) sensors*1, following the physical principle. As an example, using this system, we were able to capture the clearly decreasing of sea surface temperature along the route of Typhoon No. 21 (Fig. 2), which traveled northward on the Pacific Ocean to Japan from September 1 to 4, 2018 (Fig. 3, 4). There is a possibility that this decrease of sea surface temperature is due to the upwelling of relatively cold water under the sea surface by the strong winds associated with the typhoon.*2
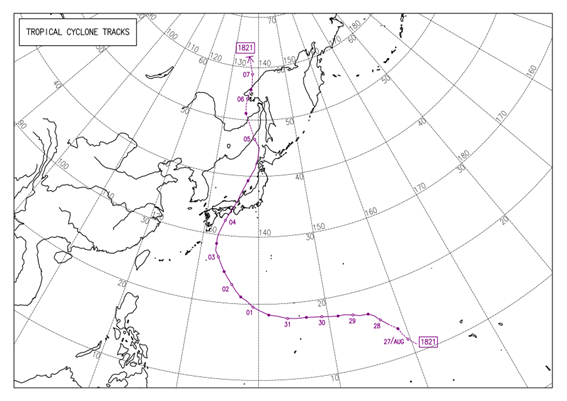
Figure 2: Typhoon 21 Route Diagram
Quoted from JMA web page.

Introducing the “Ocean Weather Forecast” visualization web pages
The JAXA Earth Observation Research Center has released two web pages. One shows images of the ocean weather forecasting system including the horizontal, zonal meridional and vertical distributions of temperature and salinity on the 30-layers (0-500-m depth), and sea surface height (Fig. 5). Another shows the maps of the ocean weather forecasting system (temperature and salinity) and Himawari-8 data (sea surface temperature and chlorophyll-a on the surface) at same time in order to compare comfortably these maps. (Fig. 6).
JAXA began providing only the sea surface temperature data of the ocean weather forecasting system with the P-Tree system of the Himawari Monitor. For other data, including depth data, please contact the JCOPE group in Japan Agency for Marine-Earth Science and Technology/ Application Laboratory, which is Joint Research Group in this project.e-mail: ![]()
![]()
![]()
![]()
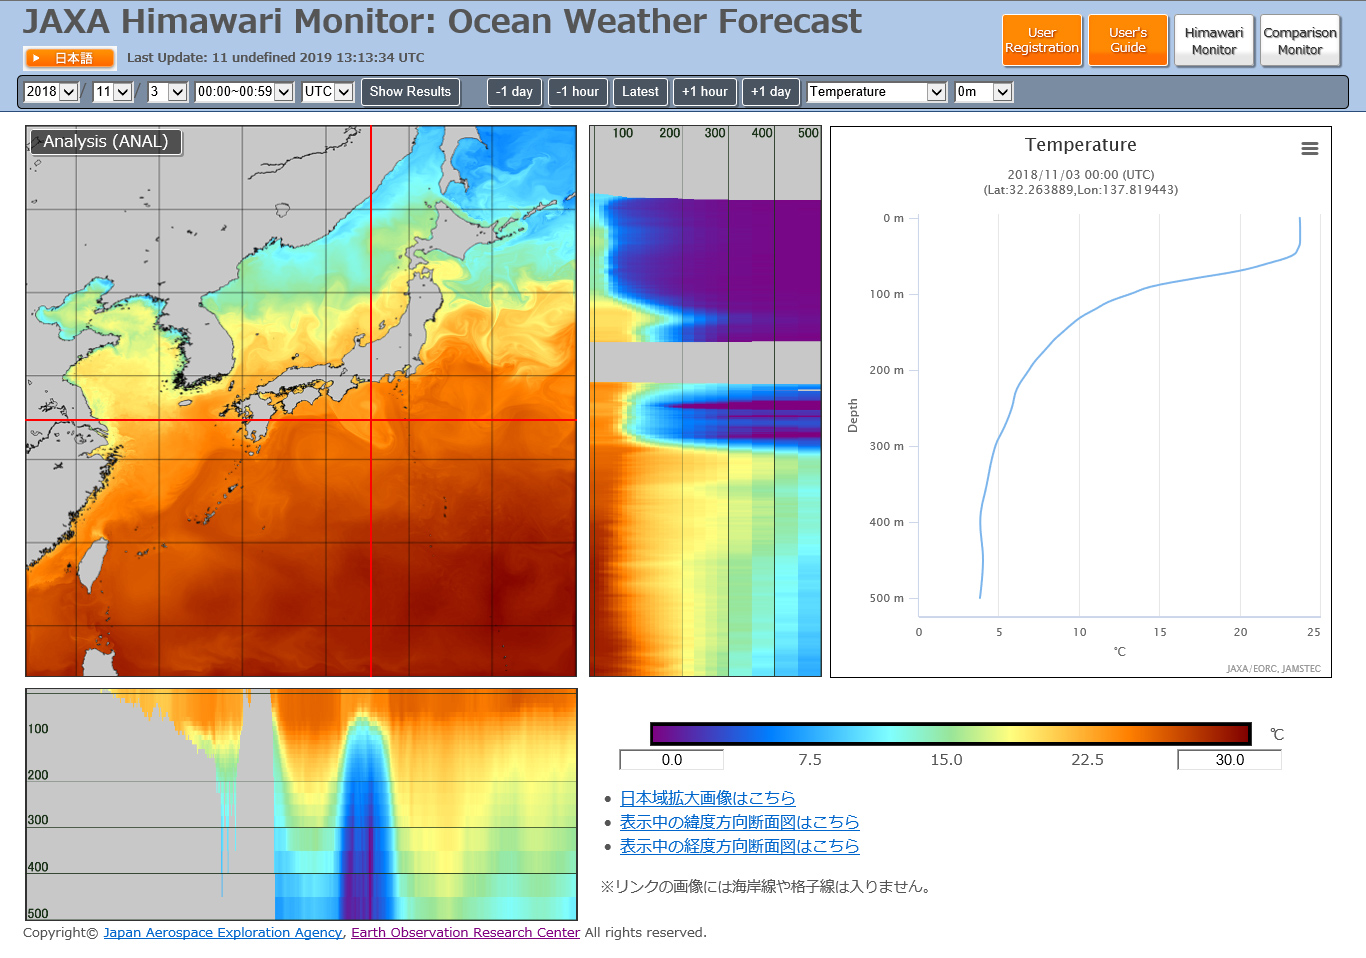
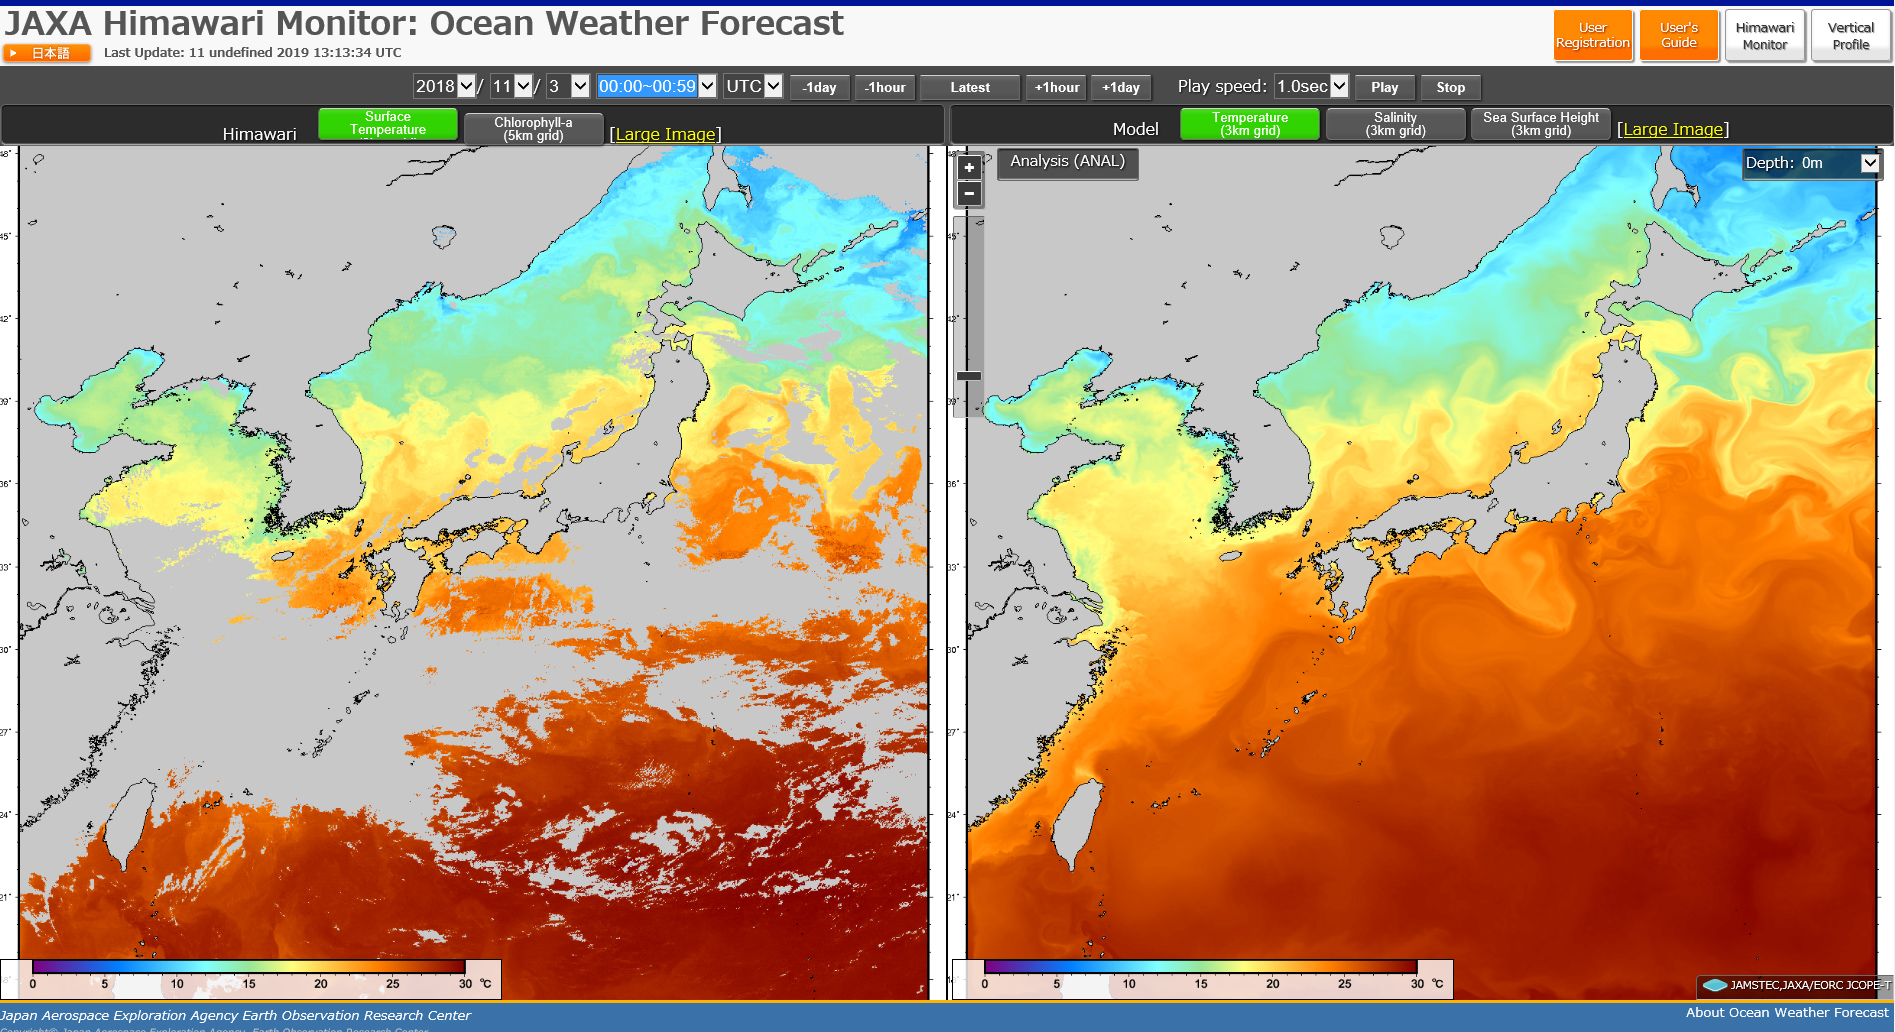
Figure 6: Web page that shows the comparison between the ocean weather forecast maps and Himawari-8 maps
References
Footnote
*1 Observation of sea surface temperature by satellites
There are two types in sensors to obtain the sea surface temperature. One is a “infrared radiometer” which is equipped on the Himawari-8. Another is a “microwave radiometer” which is equipped on the GCOM-W. The infrared radiometer is possible to do the high spatial resolution observation (from several km to several hundreds m), but can’t obtain the sea surface temperature in cloud covered area. On the other hand, microwave radiometer can obtain the sea surface temperature in cloud covered area because this sensor is able to detect the electromagnetic wave which can transmit clouds. However, the spatial resolution of obtained sea surface temperature is about 50 km.
*2 Upwelling by a typhoon.
Ocean currents from center of a typhoon to outward are occurred under a typhoon. And then, relatively cooler sea water in the lower layer comes up to the upper layer at the center. If you want to see the more detail description, please check the following Japan Meteorological Agency web page (in Japanese).
https://www.data.jma.go.jp/kaiyou/data/db/kaikyo/knowledge/taifuu_suionteika.html
Note
This research is JAXA-JAMSTEC joint research and a part of the Japan Coastal Ocean Predictability Experiment (JCOPE).
This article was created in cooperation with JAMSTEC.
Search by Year
Search by Categories


Tags
-
#Earthquake
-
#Land
-
#Satellite Data
-
#Aerosol
-
#Public Health
-
#GCOM-C
-
#Sea
-
#Atmosphere
-
#Ice
-
#Today's Earth
-
#Flood
-
#Water Cycle
-
#AW3D
-
#G-Portal
-
#EarthCARE
-
#Volcano
-
#Agriculture
-
#Himawari
-
#GHG
-
#GPM
-
#GOSAT
-
#Simulation
-
#GCOM-W
-
#Drought
-
#Fire
-
#Forest
-
#Cooperation
-
#Precipitation
-
#Typhoon
-
#DPR
-
#NEXRA
-
#ALOS
-
#GSMaP
-
#Climate Change
-
#Carbon Cycle
-
#API
-
#Humanities Sociology
-
#AMSR
-
#Land Use Land Cover
-
#Environmental issues
-
#Quick Report
-
#GOSAT-GW
Related Resources


Related Tags
Research and Development Related Articles
-
 Research and Development 2026.03.09 Mon High-Resolution Predictions of Global Terrestrial Water Cycle:
Today’s Earth – Global Updated -
 Research and Development 2025.06.18 Wed Advancing Space-Based Weather Analysis and Forecasting – Renewal of JAXA’s Realtime Weather Watch ‘NEXRA3’ and Performance Evaluation with the previous system (Overview Article)
 -
 Research and Development 2025.03.27 Thu Launch of Ocean Weather Forecasts 1km resolution
 -
 Research and Development 2024.05.27 Mon The Use of Earth Observation Satellite Data in the Humanities and Social Sciences (3)
Stay Connected
