


Research and Development
2018.10.31 Wed
Release of new numerical model data on aerosols of yellow sand, PM2.5, etc.
Toward integration of satellite data and numerical models
JAXA is aiming for producing various useful data from satellites Earth observation. Combined use (or integration) of satellite data and numerical model enables us to produce seamless data without missing area and geophysical parameters that cannot be obtained by the satellite.
JAXA has developed data analysis scheme and built simulation systems in cooperation with domestic research agencies based on a variety of Earth observation data.
That thanks to both by JAXA’s accumulated experience for satellite data analysis through its satellite Earth observation projects, and by the leap in simulation technology that has enabled modelling agencies to incorporate high-resolution data into numerical models thanks to advances in supercomputers.
In this article, we introduce a simulation of atmospheric suspended particles, i.e., aerosols*2, including yellow sand and PM2.5*1.
New numerical model data on aerosols of yellow sand, PM2.5*1, etc.
Satellite sensors observe the total amount of aerosols, and by combining them with numerical models, it is possible to estimate the amount of each type of aerosols, such as soil particles represented by yellow sand and sulfates derived from fossil fuels, as well as the concentration of PM2.5.
Here, a research group consisting of JAXA, the Meteorological Research Institute of the Japan Meteorological Agency, and Kyushu University (hereinafter referred to as the research group) has improved the accuracy of aerosol forecasts by (1) estimating the amount of aerosols by Himawari-8 and (2) incorporating assimilation of these estimates into a numerical model. The data output from the developed numerical model (e.g. transport prediction) have been available on the “JAXA Himawari Monitor” website.
The results of the research and development are also included in the joint press release issued by JAXA, the Meteorological Research Institute of the Japan Meteorological Agency, and Kyushu University, dated October 31, 2018.
(1) Aerosol estimation by Himawari-8
~ Utilizing ‘color images’ from Himawari-8 ~
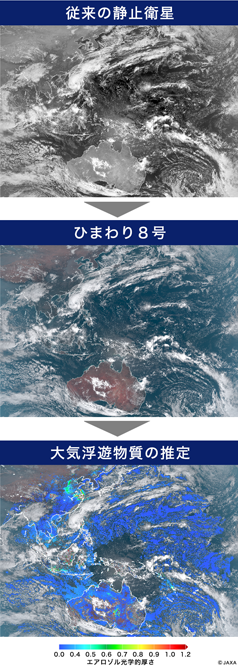
Number of observation bands of Himawari-8 has significantly increased from five to sixteen and spatial resolution doubled compared to its predecessor satellites. This makes it possible to obtain clear, so-called “color” images. JAXA has accumulated experience about algorithm development to estimate the geophysical properties from satellite observation data in missions of polar-orbiting Earth observation satellites. By applying these technologies to Himawari-8, JAXA has realized operational estimation of aerosols using the geostationary meteorological satellites (Figure 1). This means that quantitative estimates can be obtained every ten minutes covering large areas of Asia and Oceania.
~ Utilizing “temporal information” from Himawari-8 ~
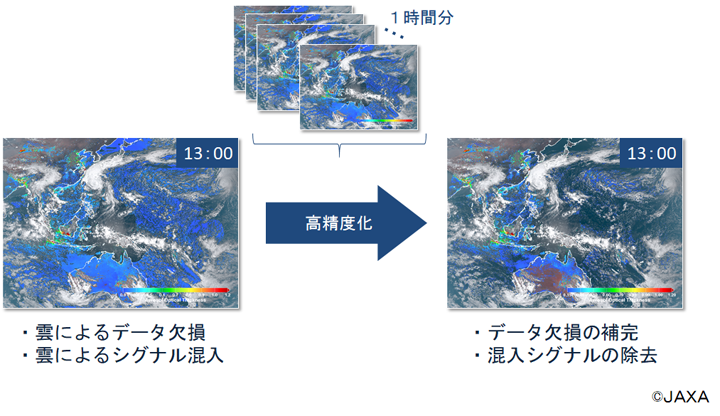
In addition, the research group developed a new algorithm using the high frequency observations of Himawari-8 and succeeded in obtaining information about temporal change of aerosols from the estimates at every 10 minutes which is the observation interval of Himawari-8 (Figure 2). This is the world’s novel estimation method that utilizes temporal change characteristics of aerosols observed by geostationary meteorological satellites. With conventional satellite observations, it was difficult to estimate the physical properties of aerosols in areas covered by clouds where data was missing, or in areas around clouds where the signal is likely contaminated. However, the estimation method that uses multiple time series data obtained by the high-frequency observation enables appropriate removal of contaminated signals and statistical completion of the missing data.
~ From static to dynamic observation ~
While previous (polar-orbiting) satellites could only show “static” information on the distribution of aerosols, it is now possible to obtain “dynamic” information of aerosol arrival with Himawari-8 and the technologies mentioned above.
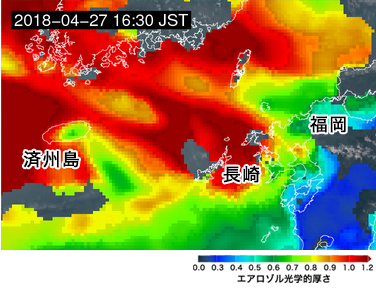
Figure 3 shows an example of continental air pollutant aerosols reaching Japan on April 27, 2018. The aerosols transported by winds along the edge of an anticyclone overhanging the East China Sea, reached the Kyushu region around 15:00 Japan time and then covered the entire northern part of Kyushu. In addition, from 15:00 to 16:30, the concentration of aerosols became thinner on the south of Jeju Island (maximum elevation 1,950 meters), indicating that aerosols were being blocked and changing their flow by the island.
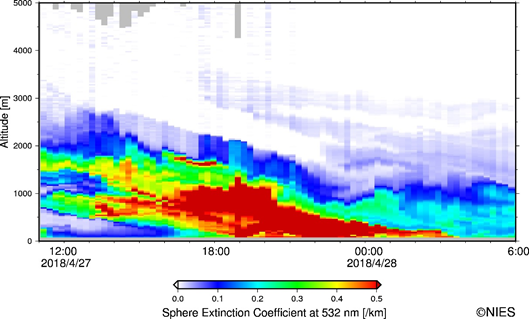
Aerosols in Jeju Island were also detected by an in-situ observation instrument operated by the National Institute for Environmental Studies (Figure 4). This observation instrument, called a lidar, observes the vertical distribution of atmospheric particles by laser light. Figure 4 shows the results of observations made on the same day as Figure 3 by a lidar on Jeju Island. It shows the vertical distribution of atmospheric particles and how they have changed over time. Very dense aerosols were observed below altitudes of approximately 2,000 meters and stayed at the low altitudes throughout the day. So the island seemed to block the low-altitude aerosols transporting from the continental region.
(2) Himawari-8 data into a numerical model
~ Estimation of aerosol particle types~
Meteorological Research Institute and Kyushu University have assimilated the physical properties of aerosols estimated by Himawari-8 as described above in (1) into the Model of Aerosol Species in the Global Atmosphere (MASINGAR) which is being developed by the Meteorological Research Institute. The incorporation of Himawari-8 observation data has improved accuracy of aerosol transport simulations, and makes it possible to predict the arrival of aerosols for the first time.
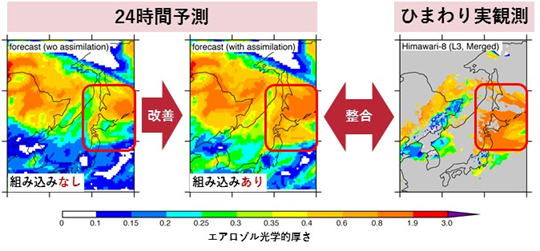
Figure 5 shows an example of aerosols from a large-scale forest fire in Siberia flying into Japan on May 19, 2016. Soot from the fires burning around Lake Baikal in Siberia spread over thousands of kilometers and stayed in Hokkaido and northern Tohoku from May 19 to 20. This was due to a stagnant of low pressure off the east of Japan causing the soot to drift above Japan instead of being flow into the Pacific Ocean.
The Meteorological Research Institute and Kyushu University simulated the aerosol movement on the day using a numerical model (MASINGAR) (Figure 5). As a result, we can see that the 24-hour forecast with assimilation of the previous day’s Himawari observations is more consistent with the Himawari observations and more accurate than the forecast without assimilation. In the case shown in the figure, the incorporation of the Himawari observation data reduced the error of the 24-hour forecast by about 29%.
Numerical models optimize their transport prediction based on observation data through the assimilation. Furthermore, satellites mainly observe the total amount of aerosols, on the other, numerical models can estimate the amount of each type of aerosols, such as soil particles represented by yellow sand and sulfates derived from fossil fuels, as well as the concentration of PM2.5.
Contributions to climate and epidemiological research and operational yellow-sand forecast of the Japan Meteorological Agency
It is expected that the published dataset will be widely used in various studies on aerosols and solving problems in various fields such as elucidating the aerosol formation and transport processes, assessing their impact on global climate system, investigating influence to public health through epidemiological studies, and evaluating their ecological impact as represented by marine biological cycles.
In addition to Himawari-8, we plan to involve more satellite observation data from the Global Change Observation Mission – Climate “SHIKISAI” (GCOM-C), the Greenhouse Gases Observing Satellite “IBUKI-2” (GOSAT-2), and the Earth Cloud Aerosol and Radiation Explorer (EarthCARE) which is being jointly developed by Japan and Europe.
The estimation method and the model assimilation technology developed here will be applied to improvements to the Japan Meteorological Agency’s yellow sand forecasts to be introduced in fiscal year 2019. This is expected to improve the accuracy of predicting the arrival of yellow sand, which affects daily life, such as the impact on transportation due to reduced visibility and the dirt on vegetable fields, laundry and cars.
In the next article, we will explain “Ocean Weather Forecast”.
Note
*1 PM2.5
Aerosols suspended in the atmosphere with aerodynamic particle diameters of approximately 2.5 µm or less. Under the Article 16, 1 of the Basic Environment Law, environmental standards (annual average of 15 µg/m2 or less and daily average of 35 µg/m2) have been established as the level that should be maintained in order to adequately protect human health.
*2 Aerosol
A general term for suspended particles in the atmosphere. Aerosol has a particle size of approximately 0.001 µm to 100 µm. Types of aerosols include air pollutants emitted from urban areas, such as factory and vehicle exhaust, soot (black carbon) from forest fires, soil particles rolled up from the ground, such as yellow sand, and sea salt particles by wave spray on the ocean surface.
*3 Aerosol optical thickness
A quantity that indicates the degree of turbidity in the atmosphere due to aerosols. For example, a value below 0.1 indicates that the atmosphere is highly transparent, while a value above 1 indicates that the atmosphere is very turbid.
*4 Figure 4
This figure shows only assuming spherical aerosols. The color is a quantity indicating the degree of atmospheric turbidity, called the extinction coefficient, which corresponds to the optical thickness when integrated atmospheric column vertically.
Information on papers
Acknowledgements
This research was supported by Grants-in-Aid for Scientific Research of Japan Society for the Promotion of Science (JP16H02946). The lidar data was provided by the GALION AD-Net homepage of the National Institute for Environmental Studies.
Joint Research Group
JAXA Earth Observation Research Center
Maki Kikuchi, Mayumi Yoshida, Takashi Nagao, Hiroshi Murakami
Meteorological Research Institute of the Japan Meteorological Agency
Taichu Y. Tanaka, Takashi Maki, Tsuyoshi Sekiyama
Research Institute for Applied Mechanics, Kyushu University
Keiya Yumimoto
This article was written in collaboration with the Meteorological Research Institute of the Japan Meteorological Agency and Kyushu University.
Search by Year
Search by Categories


Tags
-
#Earthquake
-
#Land
-
#Satellite Data
-
#Aerosol
-
#Public Health
-
#GCOM-C
-
#Sea
-
#Atmosphere
-
#Ice
-
#Today's Earth
-
#Flood
-
#Water Cycle
-
#AW3D
-
#G-Portal
-
#EarthCARE
-
#Volcano
-
#Agriculture
-
#Himawari
-
#GHG
-
#GPM
-
#GOSAT
-
#Simulation
-
#GCOM-W
-
#Drought
-
#Fire
-
#Forest
-
#Cooperation
-
#Precipitation
-
#Typhoon
-
#DPR
-
#NEXRA
-
#ALOS
-
#GSMaP
-
#Climate Change
-
#Carbon Cycle
-
#API
-
#Humanities Sociology
-
#AMSR
-
#Land Use Land Cover
-
#Environmental issues
-
#Quick Report
-
#GOSAT-GW
Related Resources


Related Tags
Research and Development Related Articles
-
 Research and Development 2026.03.09 Mon High-Resolution Predictions of Global Terrestrial Water Cycle:
Today’s Earth – Global Updated -
 Research and Development 2025.06.18 Wed Advancing Space-Based Weather Analysis and Forecasting – Renewal of JAXA’s Realtime Weather Watch ‘NEXRA3’ and Performance Evaluation with the previous system (Overview Article)
 -
 Research and Development 2025.03.27 Thu Launch of Ocean Weather Forecasts 1km resolution
 -
 Research and Development 2024.05.27 Mon The Use of Earth Observation Satellite Data in the Humanities and Social Sciences (3)
Stay Connected
