


Latest Observation
2018.05.31 Thu
Detecting the spring fresh greenery in eastern Japan captured by GCOM-C
GCOM-C, launched from the Tanegashima Space Center on December 23, 2018, captured the expansion of the geographical reach of the fresh greenery in the forests of eastern Japan.
GCOM-C has multiple channels in the visible range and observes the Earth’s surface approximately once every two days with a 250-m resolution, so that we can detect the timely signal of the seasonal changes of plants. Now, we could clearly detect the new leaf expanding area in the forests, a typical seasonal change signal of plants, from space.
Look at Figure 1, which displays satellite color composite images of the Northeast Japan “Tohoku region” captured by the Second-generation Global Imager (SGLI) onboard GCOM-C from April to May 2018. We can see that the green leaf-expanded areas gradually spread to the Northern and alpine regions: the deciduous forest area looks brown and green before and after the leaf expansion seasons, respectively.
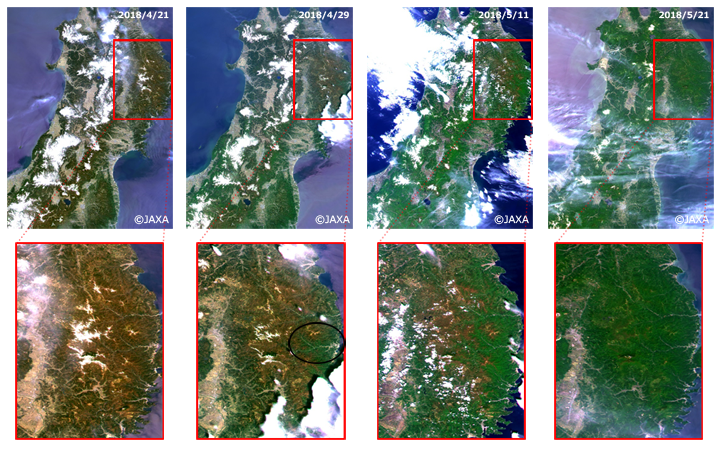
Figure 2 illustrates images captured in the same area as Figure 1 and the same period as the previous year by MODIS on NASA’s Terra/Aqua satellites (from late April to early May 2017). Comparatively speaking, the spring leaf expansion area (green) was larger in this region on April 30 this year. Additionally, in areas around Miyako City (indicated by black circles), the greening-up timing was earlier than it was the previous year.
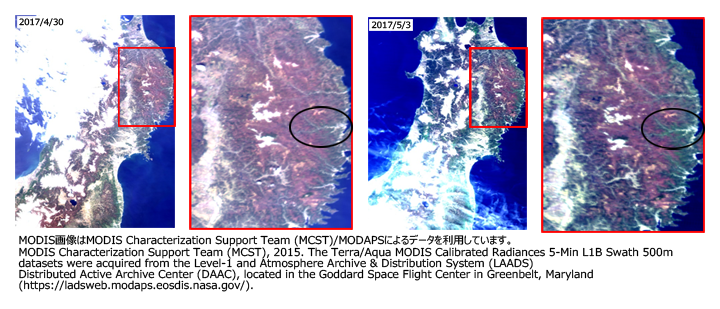
Figure 3 is also satellite color composite images of central Japan, “the Kanto region”, captured by GCOM-C/SGLI from late April to May 2018 (upper images) and by MODIS from late April to early May 2017 (lower images). In the Tanzawa Mountains (red circles) and the southern part of Yamanashi Prefecture (blue circles), the leaf expansion season started 10 days earlier this year than the previous year.
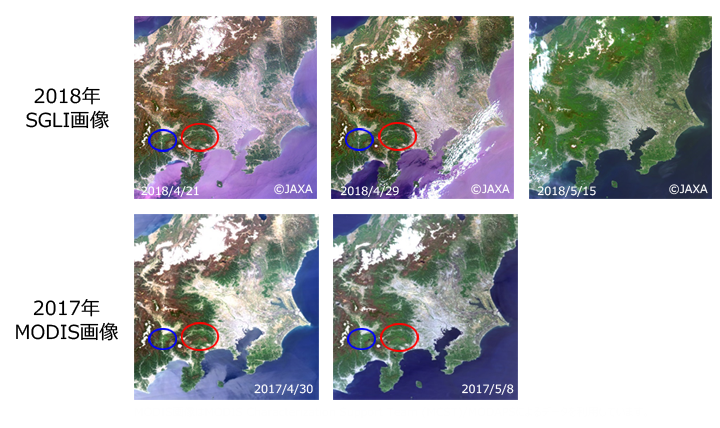
According to the Japan Meteorological Agency, the peak bloom date of cherry blossom was about 10 days earlier than last year in this region, from the Kanto-Koshin region to Fukushima Prefecture (Ref. 1). The timing of flowering and leaf expansion depends on latitude, altitude, average temperature, and so on. Compared with the same region, i.e., at the same latitude and same altitude, the peak bloom date of cherry blossoms and the leaf expansion season were earlier than usual.
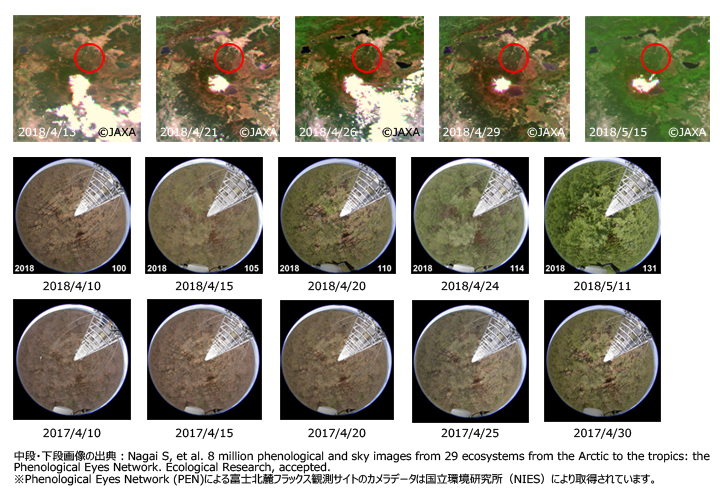
Figure 4 is satellite color composite images of the area around Mt. Fuji captured by GCOM-C/SGLI and photos taken at the top of the tower in the Fuji Hokuroku Flux Observation Site, which is larch forests (red circles) (Ref. 2), collected by the Phenological Eyes Network (PEN). We can find the green-up period detected by PEN images and SGLI matches. In 2018, PEN images also indicated that the green-up season occurred about 10 days earlier than the previous year.
To capture the amount of leaf area in an ecosystem, JAXA will estimate the total leaf area per unit area, known as leaf area index (LAI), using GCOM-C data and release its product. By observing the global distribution, seasonal changes, and long-term variations of LAI and above-ground biomass with high precision, it is expected to contribute to clarifying the mechanisms of carbon cycle change and improving the accuracy of climate numerical models.
(We thank Associate Professor Yoshiaki Honda of Chiba University and Dr. Shin Nagai of Japan Agency for Marine-Earth Science and Technology (JAMSTEC) for writing this article. Camera images at the Fuji Hokuroku Flux Observation Site were collected by the National Institute for Environmental Studies (NIES), a member of the Phenological Eyes Network (PEN).
Explanation of images

Figs. 1, 3 and 4
| Satellite | Global Change Observation Mission – Climate “SHIKISAI” (GCOM-C) |
|---|---|
| Sensor | Second-generation GLobal Imager (SGLI) |
| Date | (Fig. 1) April 21, 2018, April 29, 2018, May 11, 2018, and May 21, 2018 (Fig. 3) April 21, 2018, April 29, 2018, and May 15, 2018 (Fig. 4) April 13, 2018, April 21, 2018, April 26, 2018, April 29, 2018, and May 15, 2018 |
Figs. 2 and 3
| Satellite | NASA Aqua and Terra Satellite |
|---|---|
| Sensor | Moderate-Resolution Imaging Spectroradiometer, MODIS (NASA) |
| Date | (Fig. 2) April 30, 2017 (Aqua), May 3, 2017 (Terra) (Fig. 3) April 30, 2017 (Aqua), May 8, 2017 (Terra) |
Reference
- (Ref. 1) Japan Meteorological Agency Website: Past Cherry Blossom Blooms
- (Ref. 2) National Institute for Environmental Studies, Center for Global Environmental Research: Carbon Balance Monitoring in Forest Ecosystems
Related Sites
Search by Year
Search by Categories


Tags
-
#Earthquake
-
#Land
-
#Satellite Data
-
#Aerosol
-
#Public Health
-
#GCOM-C
-
#Sea
-
#Atmosphere
-
#Ice
-
#Today's Earth
-
#Flood
-
#Water Cycle
-
#AW3D
-
#G-Portal
-
#EarthCARE
-
#Volcano
-
#Agriculture
-
#Himawari
-
#GHG
-
#GPM
-
#GOSAT
-
#Simulation
-
#GCOM-W
-
#Drought
-
#Fire
-
#Forest
-
#Cooperation
-
#Precipitation
-
#Typhoon
-
#DPR
-
#NEXRA
-
#ALOS
-
#GSMaP
-
#Climate Change
-
#Carbon Cycle
-
#API
-
#Humanities Sociology
-
#AMSR
-
#Land Use Land Cover
-
#Environmental issues
-
#Quick Report
-
#GOSAT-GW
Related Resources


Related Tags
Latest Observation Related Articles
-
 Latest Observation 2026.06.05 Fri [Quick Report] Typhoon No. 6, “JANGMI”, brought heavy rain to Japan. – Results of satellite data analysis –
 -
 Latest Observation 2026.04.16 Thu [Quick Report] EarthCARE Captured the Eye of Typhoon Sinlaku
 -
 Latest Observation 2025.12.03 Wed [Quick Report] Analysis results from satellite precipitation data on the record-breaking heavy rainfall occurring in Southeast Asia in late November 2025
 -
 Latest Observation 2025.10.01 Wed [Quick Report] Hurricane Humberto “Eye” captured by EarthCARE satellite (Hakuryu)
Stay Connected
