


Latest Observation
2014.06.30 Mon
Bai-u front in June 2014 observed by the Global Precipitation Measurement (GPM) mission
Japan Meteorological Agency (JMA) announced that beginning of the rainy season (“Bai-u”) in Japan in 2014 was May 5 in Okinawa region and May 11 in Amami region. After then, Bai-u began at June 2 in the Kyusyu Island, at June 3 in Shikoku Island, at June 4 in the western part of Honshu Island, and at June 5 in the eastern part of Honshu Island including Tokyo. At June 6, Bai-u finally reached to the northern part of Tohoku eight days earlier than normal year. It seems that Bai-u in June 2014 was slightly different to normal year; record rainfalls were observed in the Kanto area in June; and even in the Hokkaido Island, where does not have rainy season, continuous rainfalls were observed.
In this article, we will introduce images of vertical structures inside the precipitation systems around Japan Islands in Bai-u season in June 2014, captured by the Dual-frequency Precipitation Radar (DPR) on board the Global Precipitation Measurement (GPM) Core Observatory, which is the US-Japan joint mission and was launched in the end of February 2014.
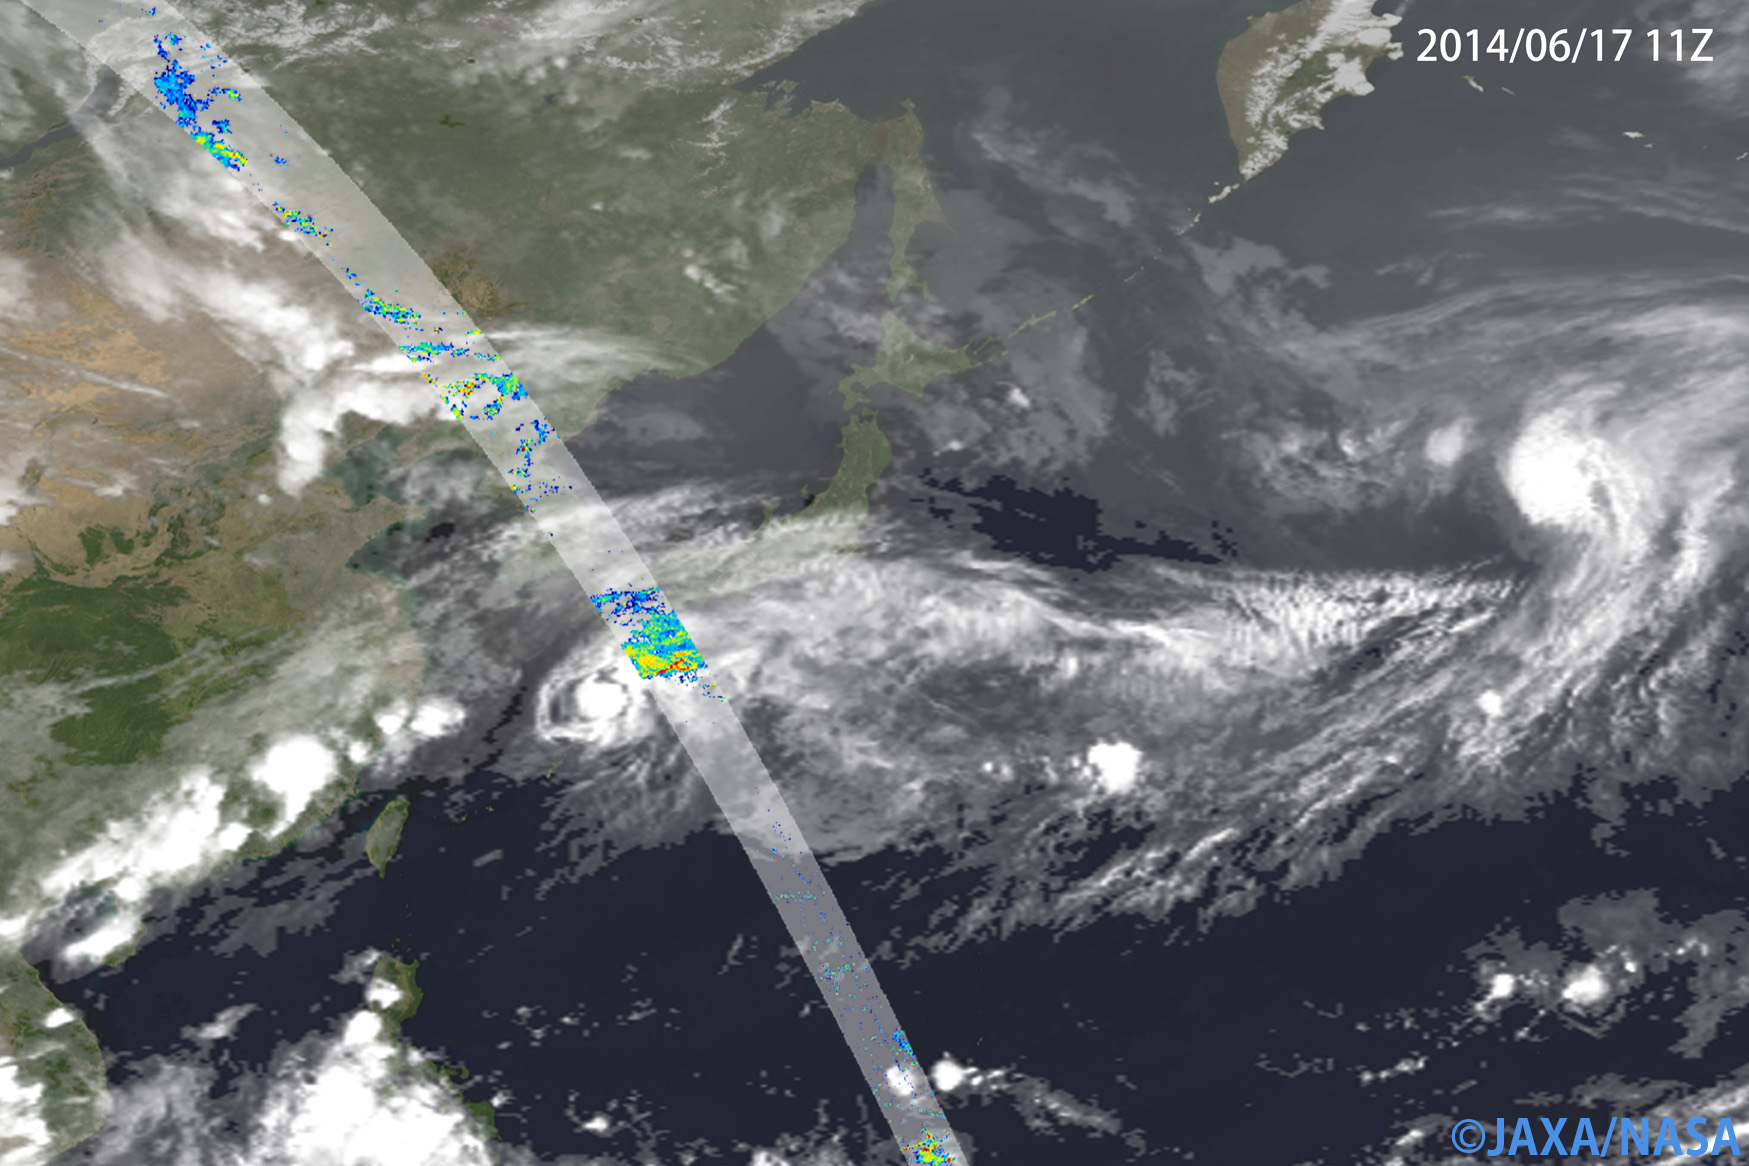
Figure 1 shows overview of Bai-u front around Japan at 11 (UTC) on June 17, 2014. Left figure is surface rainfall measured by DPR overlaying cloud image captured by the geostationary satellite MTSAT. Right figure is weather chart around Japan but one hour later. Bai-u front was extended over the ocean in the south of Japan, and typhoon was located in the southwest offshore of Kyushu Island. This is Typhoon No.7 “HAGIBIS” that is generated on June 14. This typhoon once became the extratropical cyclone after its landfalls in South China, but went back to the East China Sea on June 17 and became the typhoon again.
 |
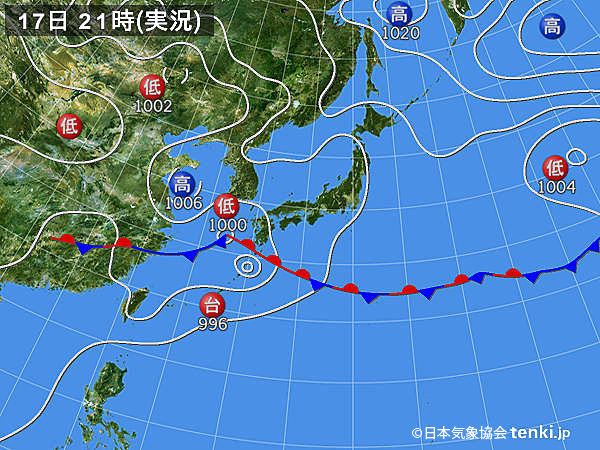 |
Figure 1
Left: DPR surface rainfall is overlaying to cloud image captured by the Japanese geostationary satellite “MTSAT” at around 11Z (UTC) on June 17, 2014
Right: Weather chart around Japan at 12 (UTC) of the same day
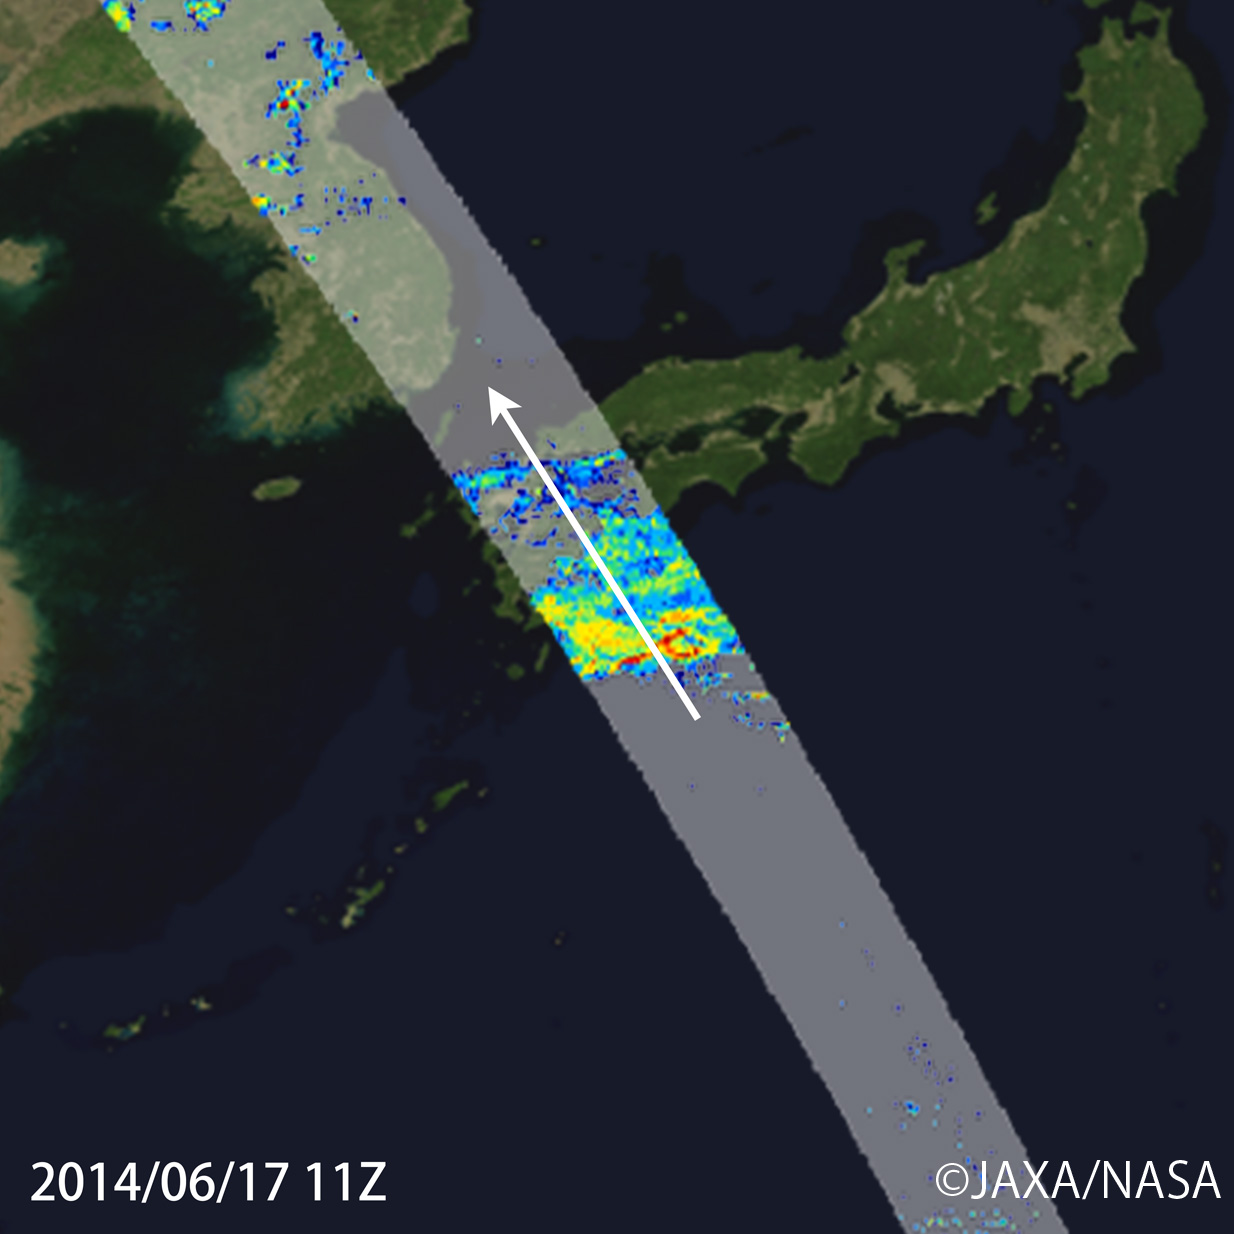
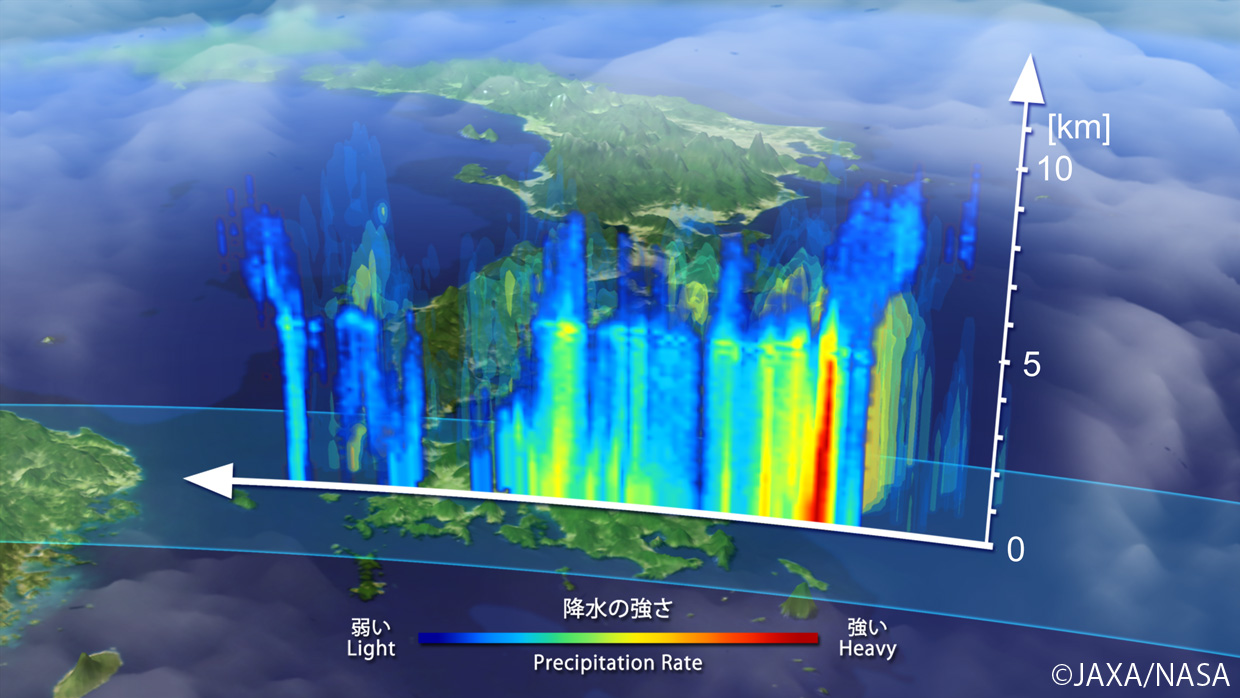
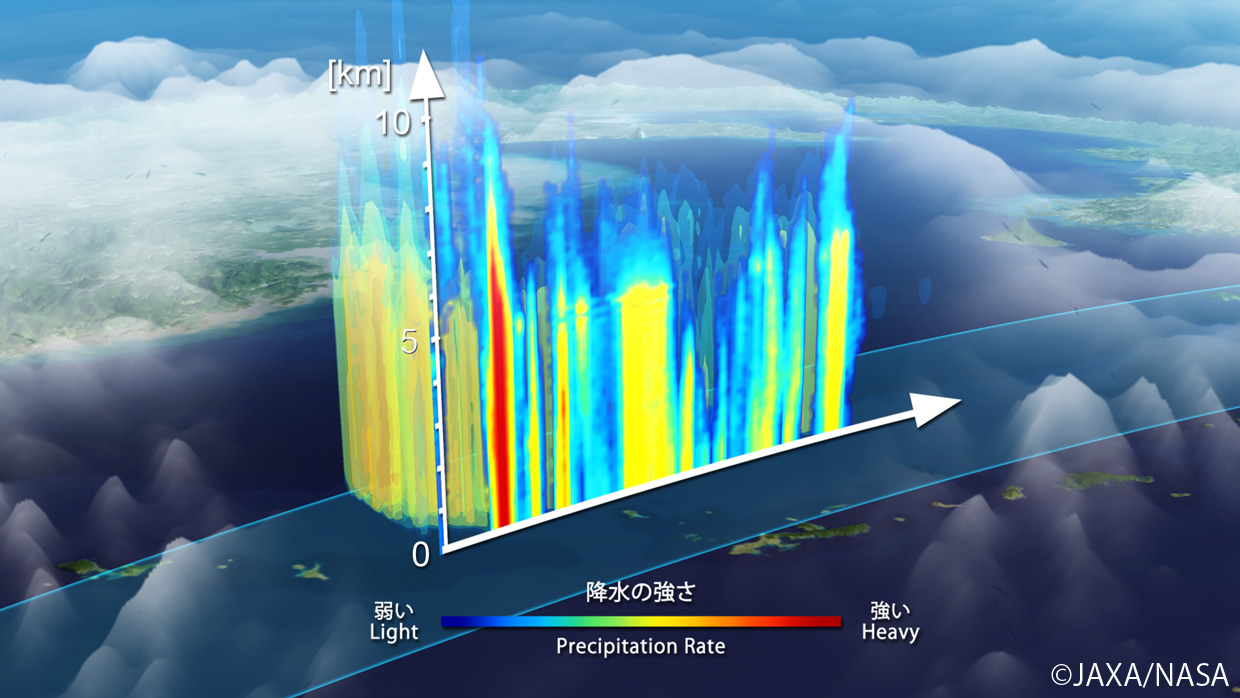
Figure 2 shows close up images of the precipitation system around the Kyushu Island captured by the DPR at the same time as Figure 1. White spherical clouds shown southwest side of DPR orbit in the lower left image was Typhoon No.7 “HAGIBIS.” As typhoon approached to the Kyushu Island, activities of Bai-u front was intensified and strong rainfall was measured in the southern Kyushu. The DPR observation in upper right figure revealed that the storm height of the system reached about 10 km at the highest. Heavy rainfall (red color) region was located over the southeast offshore of Kyushu Island and strong rainfall reached up until 5 km height.
 |
 |
|
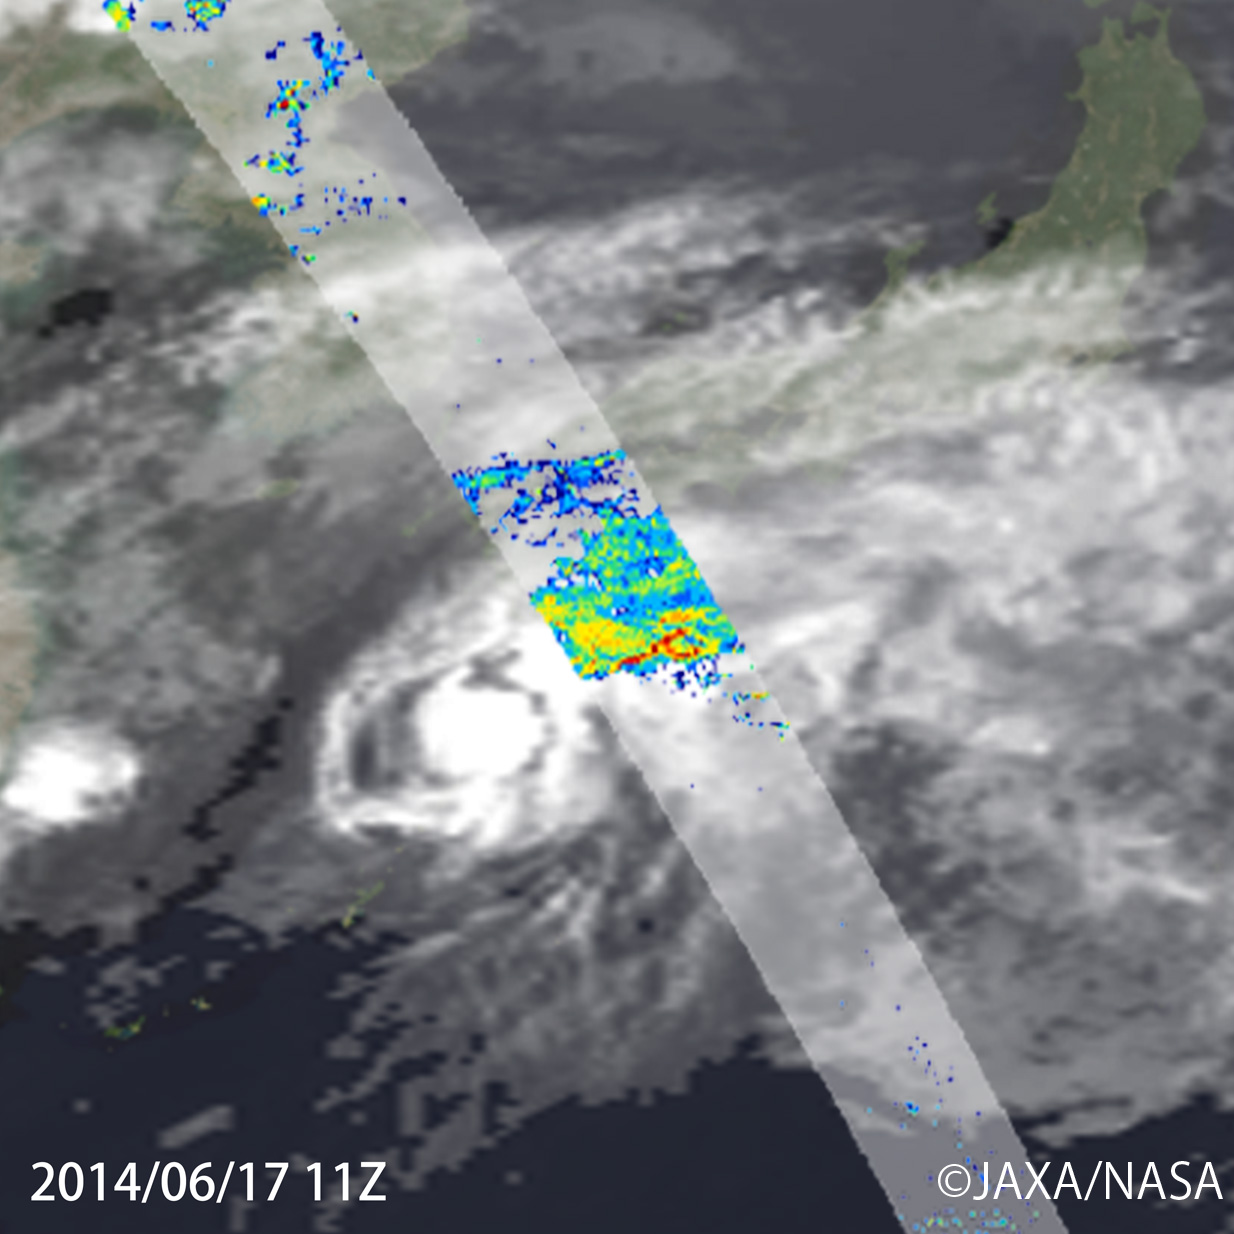 |
Figure 2 Precipitation system over the Kyushu Island observed by the DPR at 11 (UTC) on June 17, 2014
Upper left: DPR surface rainfall
Upper right: Vertical cross section of three dimensional DPR rain rate along the white arrow inside the upper left image, viewing from the southwest side of Kyushu Island
Lower left: DPR surface rainfall overlaying cloud image by the Japanese geostationary satellite “MTSAT”
Figure 3 shows the precipitation system around the Okinawa Island captured by the DPR at 2 (UTC) on June 14, 2014. Weather chart indicates that western tip of Bai-u front was located around the Okinawa, and the precipitation system captured by the DPR belonged to Bai-u front. The precipitation system in upper left image of Figure 3 shows characteristics that storm height of the system was higher than those in Figure 2 and 4, since the Okinawa Island is located in the extra-tropical region. The DPR observation indicated that storm height of the system reached around 14 km at the highest. Heavy rainfall region extended upward like tower, and reached up until 7 km height.
 |
 |
 |
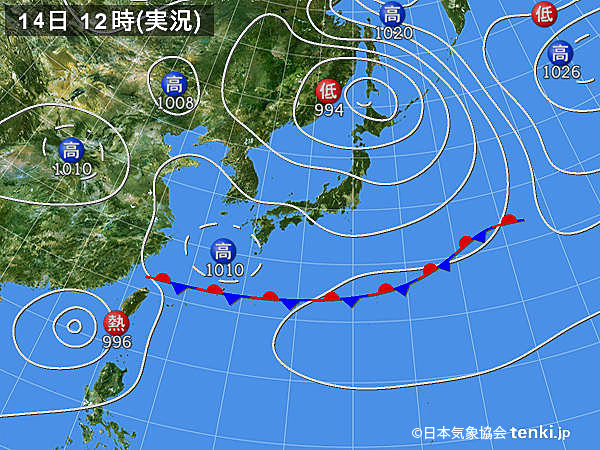 |
Figure 3 Precipitation system around the Okinawa Island observed by the DPR at 2 (UTC) on June 14, 2014
Upper left: DPR surface rainfall
Upper right: Vertical cross section of three dimensional DPR rain rate along the white arrow inside the upper left image, viewing from the southeast side of Okinawa Island
Lower left: DPR surface rainfall overlaying cloud image by the Japanese geostationary satellite “MTSAT”
Lower right: Weather chart around Japan at 3 (UTC) of the same day
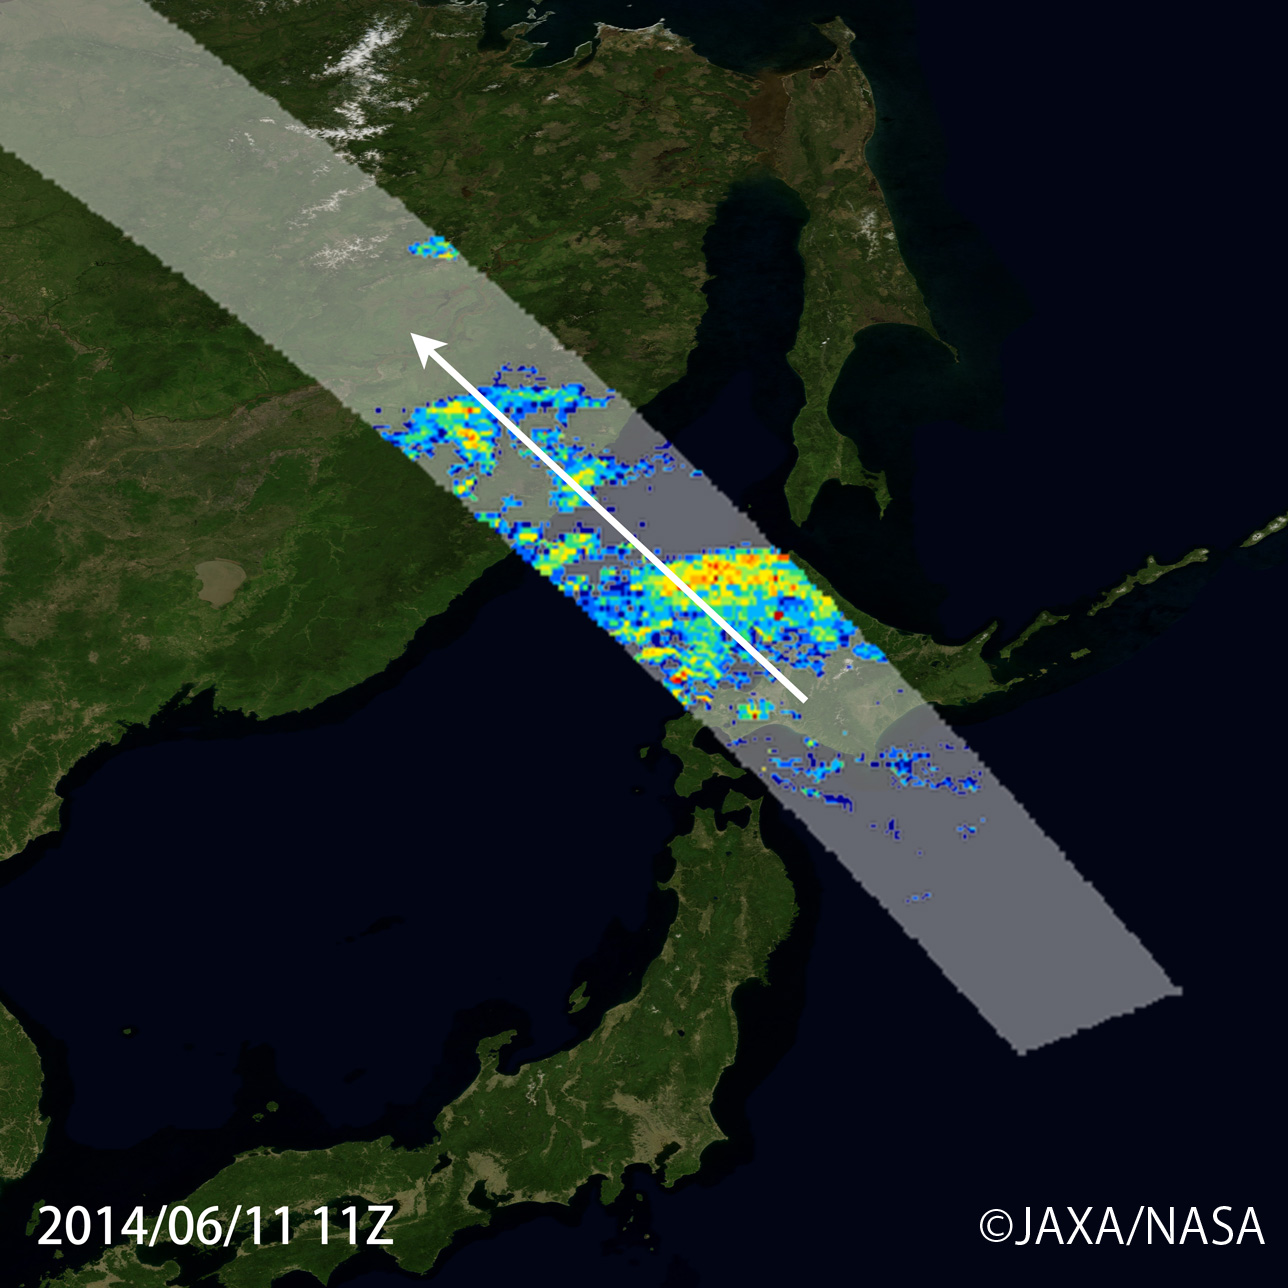
Although the Hokkaido region does not have rainy season, continuous and record rainfalls were observed since early June this year. Figure 4 shows the precipitation system over the northern Hokkaido captured by the DPR at 11 (UTC) on June 11, 2014. DPR captured the precipitation system extending from Russia to Hokkaido through Japan Sea. Northern part of Japan was out of observation area of the Precipitation Radar (PR) on board the Tropical Rainfall Measuring Mission (TRMM) satellite, which is the predecessor of the GPM Core Observatory, and three dimensional structure of rainfall over these areas can be observed by the DPR for the first time. Due to this continuous rain, many trains went out of service from June 11 to 13 in Hokkaido.
 |
 |
|
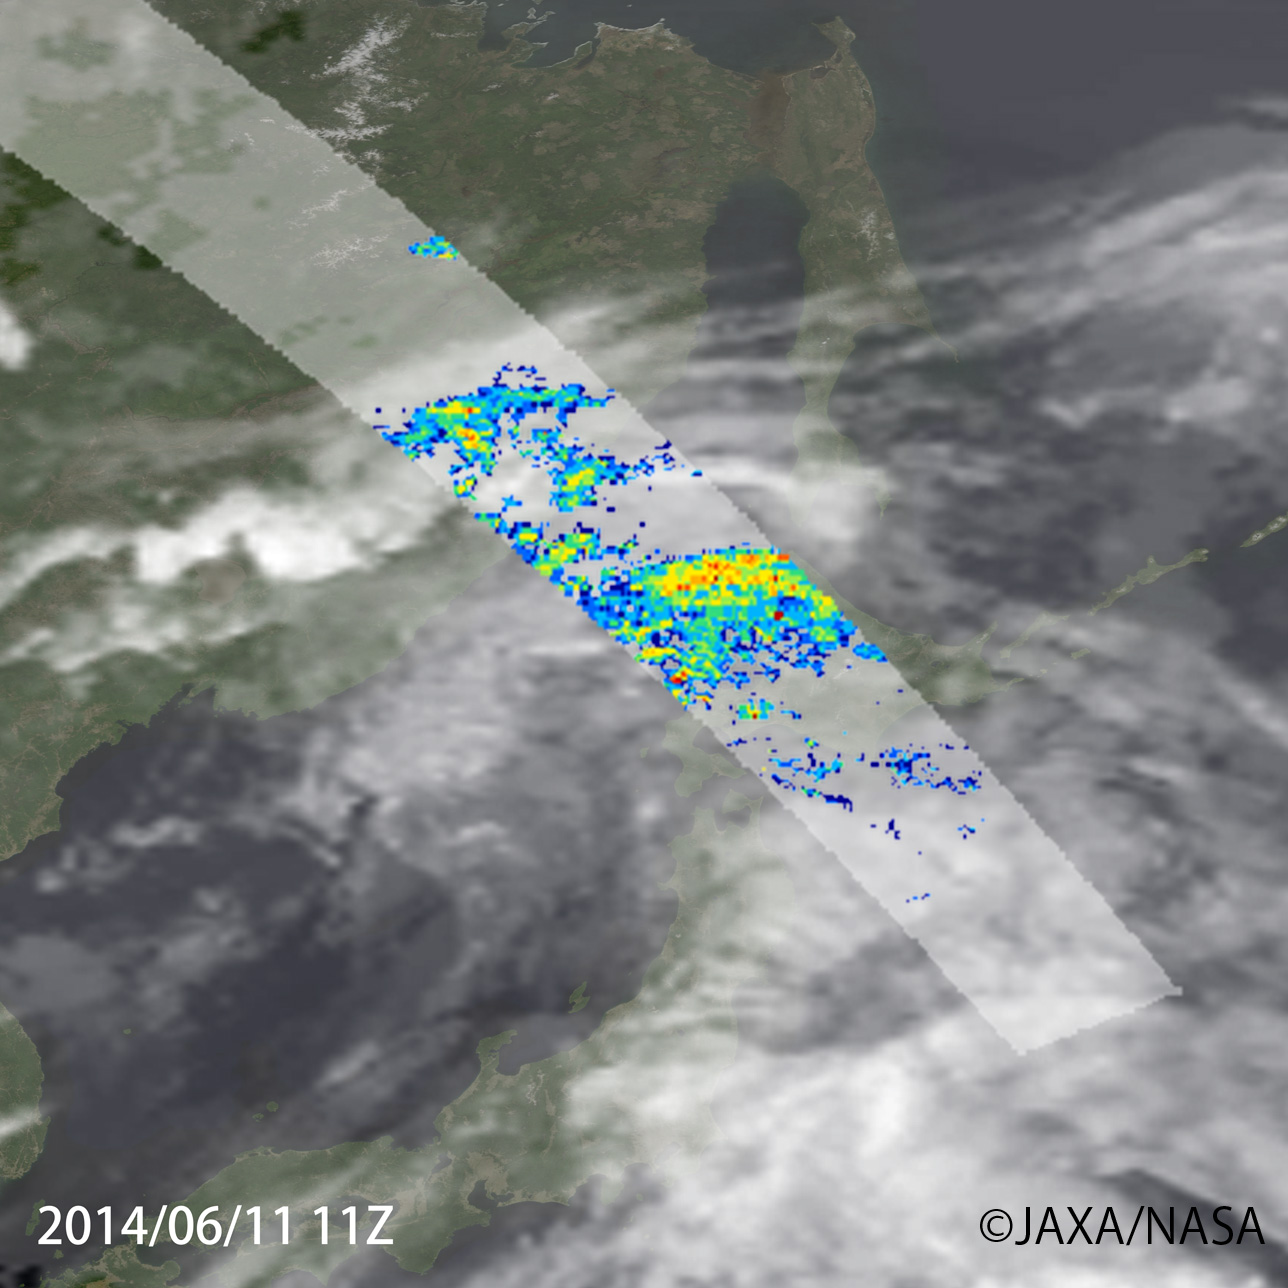 |
Figure 4 Precipitation system over the northern Hokkaido observed by the DPR at 11 (UTC) on June 11, 2014
Upper left: DPR surface rainfall
Upper right: Vertical cross section of three dimensional DPR rain rate along the white arrow inside the upper left image, viewing from the northeast side of Hokkaido Island
Lower left: DPR surface rainfall overlaying cloud image by the Japanese geostationary satellite “MTSAT”
The GPM mission consists from two categories of satellites; high sensitive and highly accurate global precipitation observation by the GPM Core Observatory carrying the Dual-frequency Precipitation Radar (DPR) and GPM Microwave Imager (GMI) and extensive and high frequent global precipitation observation by the Constellation Satellites, which are provided by the GPM partners, carrying microwave imager and/or sounder. Utilizing data from those satellites, we can produce global merged precipitation map product, which is developed in US and Japan separately.
In Japan, the Global Satellite Mapping of Precipitation (GSMaP) product was developed to produce hourly global rainfall map in 0.1 degree latitude/longitude grid in near-real-time of four hour after the completion of observation, by using multi-satellite data. The GSMaP product has been released through JAXA Global Rainfall Watch web site as a prototype of the GPM since 2007 and the system will be switched over to the GPM Global Rainfall Map (GPM-GSMaP). product, which is one of JAXA GPM product, in September 2014 corresponding to the public release of the GPM products. Currently, validations of the product accuracy are underway.
Figure 5 is an animation of Bai-u front around Japan during June 1 and 13, 2014, by the GPM Global Rainfall Map (GPM-GSMaP) Data from microwave imagers and sounders on board the GPM Core Observatory, Japanese GCOM-W satellite, US DMSP satellites, Europe’s MetOp satellites and others, are merged with cloud information by the geostationary satellites to obtain hourly global rainfall map. In future, we plan to develop and extend the database by using three dimensional precipitation information obtained from the DPR, and improve accuracy of precipitation estimation in high latitudes.
| Figure 5 Activities of Bai-u front in early June 2014 shown by the GPM Global Rainfall Map (GPM-GSMaP). Hourly animation from June 1 to 13, 2014 |
We expect that DPR will observe other typhoon in near future since typhoon/hurricane season is approaching in the Northern Hemisphere. In this article, we will introduce image of Cyclone “ITA” captured by the DPR over the northeast offshore of Australia at 19 (UTC) on April 10, 2014 (Figure 6).
Super cyclone “ITA” was generated as tropical cyclone near the Solomon Islands, reached to intensity of cyclone on April 5, and landed to the northeast Australia on April 12. The Australian newspaper reported that initial estimates placed damage in Queensland over A$1 billion.
DPR observed the cyclone three days before the landing to Australia, and captured the well-developed precipitation system with more than 15 km storm height around the eye of cyclone. The GPM Global Rainfall Map (GPM-GSMaP) reveals development of the cyclone in wider regions.
| Figure 6 Cyclone “ITA” approaching the Northeastern Australia. Three dimensional observation of the cyclone by the DPR at 19 (UTC) on April 10, 2014, and animation by the GPM Global Rainfall Map (GPM-GSMaP) |
Explanation of the Images:
| Satellite: | Global Precipitation Measurement(GPM) Core Observatory |
| Sensor: | Dual-frequency Precipitation Radar(DPR), GPM Microwave Imager(GMI) |
| Date: |
Jun. 17, 2014 (Fig. 1)(Fig. 2) Jun 14, 2014 (Fig. 3) Jun 11, 2014 (Fig. 4) Jun 1 to Jun 13, 2014 (Fig. 5) April 10, 2014 (Fig. 4) |
Search by Year
Search by Categories


Tags
-
#Earthquake
-
#Land
-
#Satellite Data
-
#Aerosol
-
#Public Health
-
#GCOM-C
-
#Sea
-
#Atmosphere
-
#Ice
-
#Today's Earth
-
#Flood
-
#Water Cycle
-
#AW3D
-
#G-Portal
-
#EarthCARE
-
#Volcano
-
#Agriculture
-
#Himawari
-
#GHG
-
#GPM
-
#GOSAT
-
#Simulation
-
#GCOM-W
-
#Drought
-
#Fire
-
#Forest
-
#Cooperation
-
#Precipitation
-
#Typhoon
-
#DPR
-
#NEXRA
-
#ALOS
-
#GSMaP
-
#Climate Change
-
#Carbon Cycle
-
#API
-
#Humanities Sociology
-
#AMSR
-
#Land Use Land Cover
-
#Environmental issues
-
#Quick Report
-
#GOSAT-GW
Related Resources


Related Tags
Latest Observation Related Articles
-
 Latest Observation 2026.06.05 Fri [Quick Report] Typhoon No. 6, “JANGMI”, brought heavy rain to Japan. – Results of satellite data analysis –
 -
 Latest Observation 2026.04.16 Thu [Quick Report] EarthCARE Captured the Eye of Typhoon Sinlaku
 -
 Latest Observation 2025.12.03 Wed [Quick Report] Analysis results from satellite precipitation data on the record-breaking heavy rainfall occurring in Southeast Asia in late November 2025
 -
 Latest Observation 2025.10.01 Wed [Quick Report] Hurricane Humberto “Eye” captured by EarthCARE satellite (Hakuryu)
Stay Connected
