


Latest Observation
2010.04.14 Wed
Lake Chad: A Shrinking Lake in the Desert
Lakes in Africa are now endangered because of droughts or development of irrigation agriculture. There are over 600 lakes in Africa and many are shrinking due to sharp decreases in water volume. Especially, Lake Chad, located in the south of the Sahara Desert, has showed rapid shrinkage and is in danger of disappearing. The lake had an area of more than 25,000 km2 in the first half of the 1960s. The area is now around one-fifteenth of its original size.
Caption on
Caption off
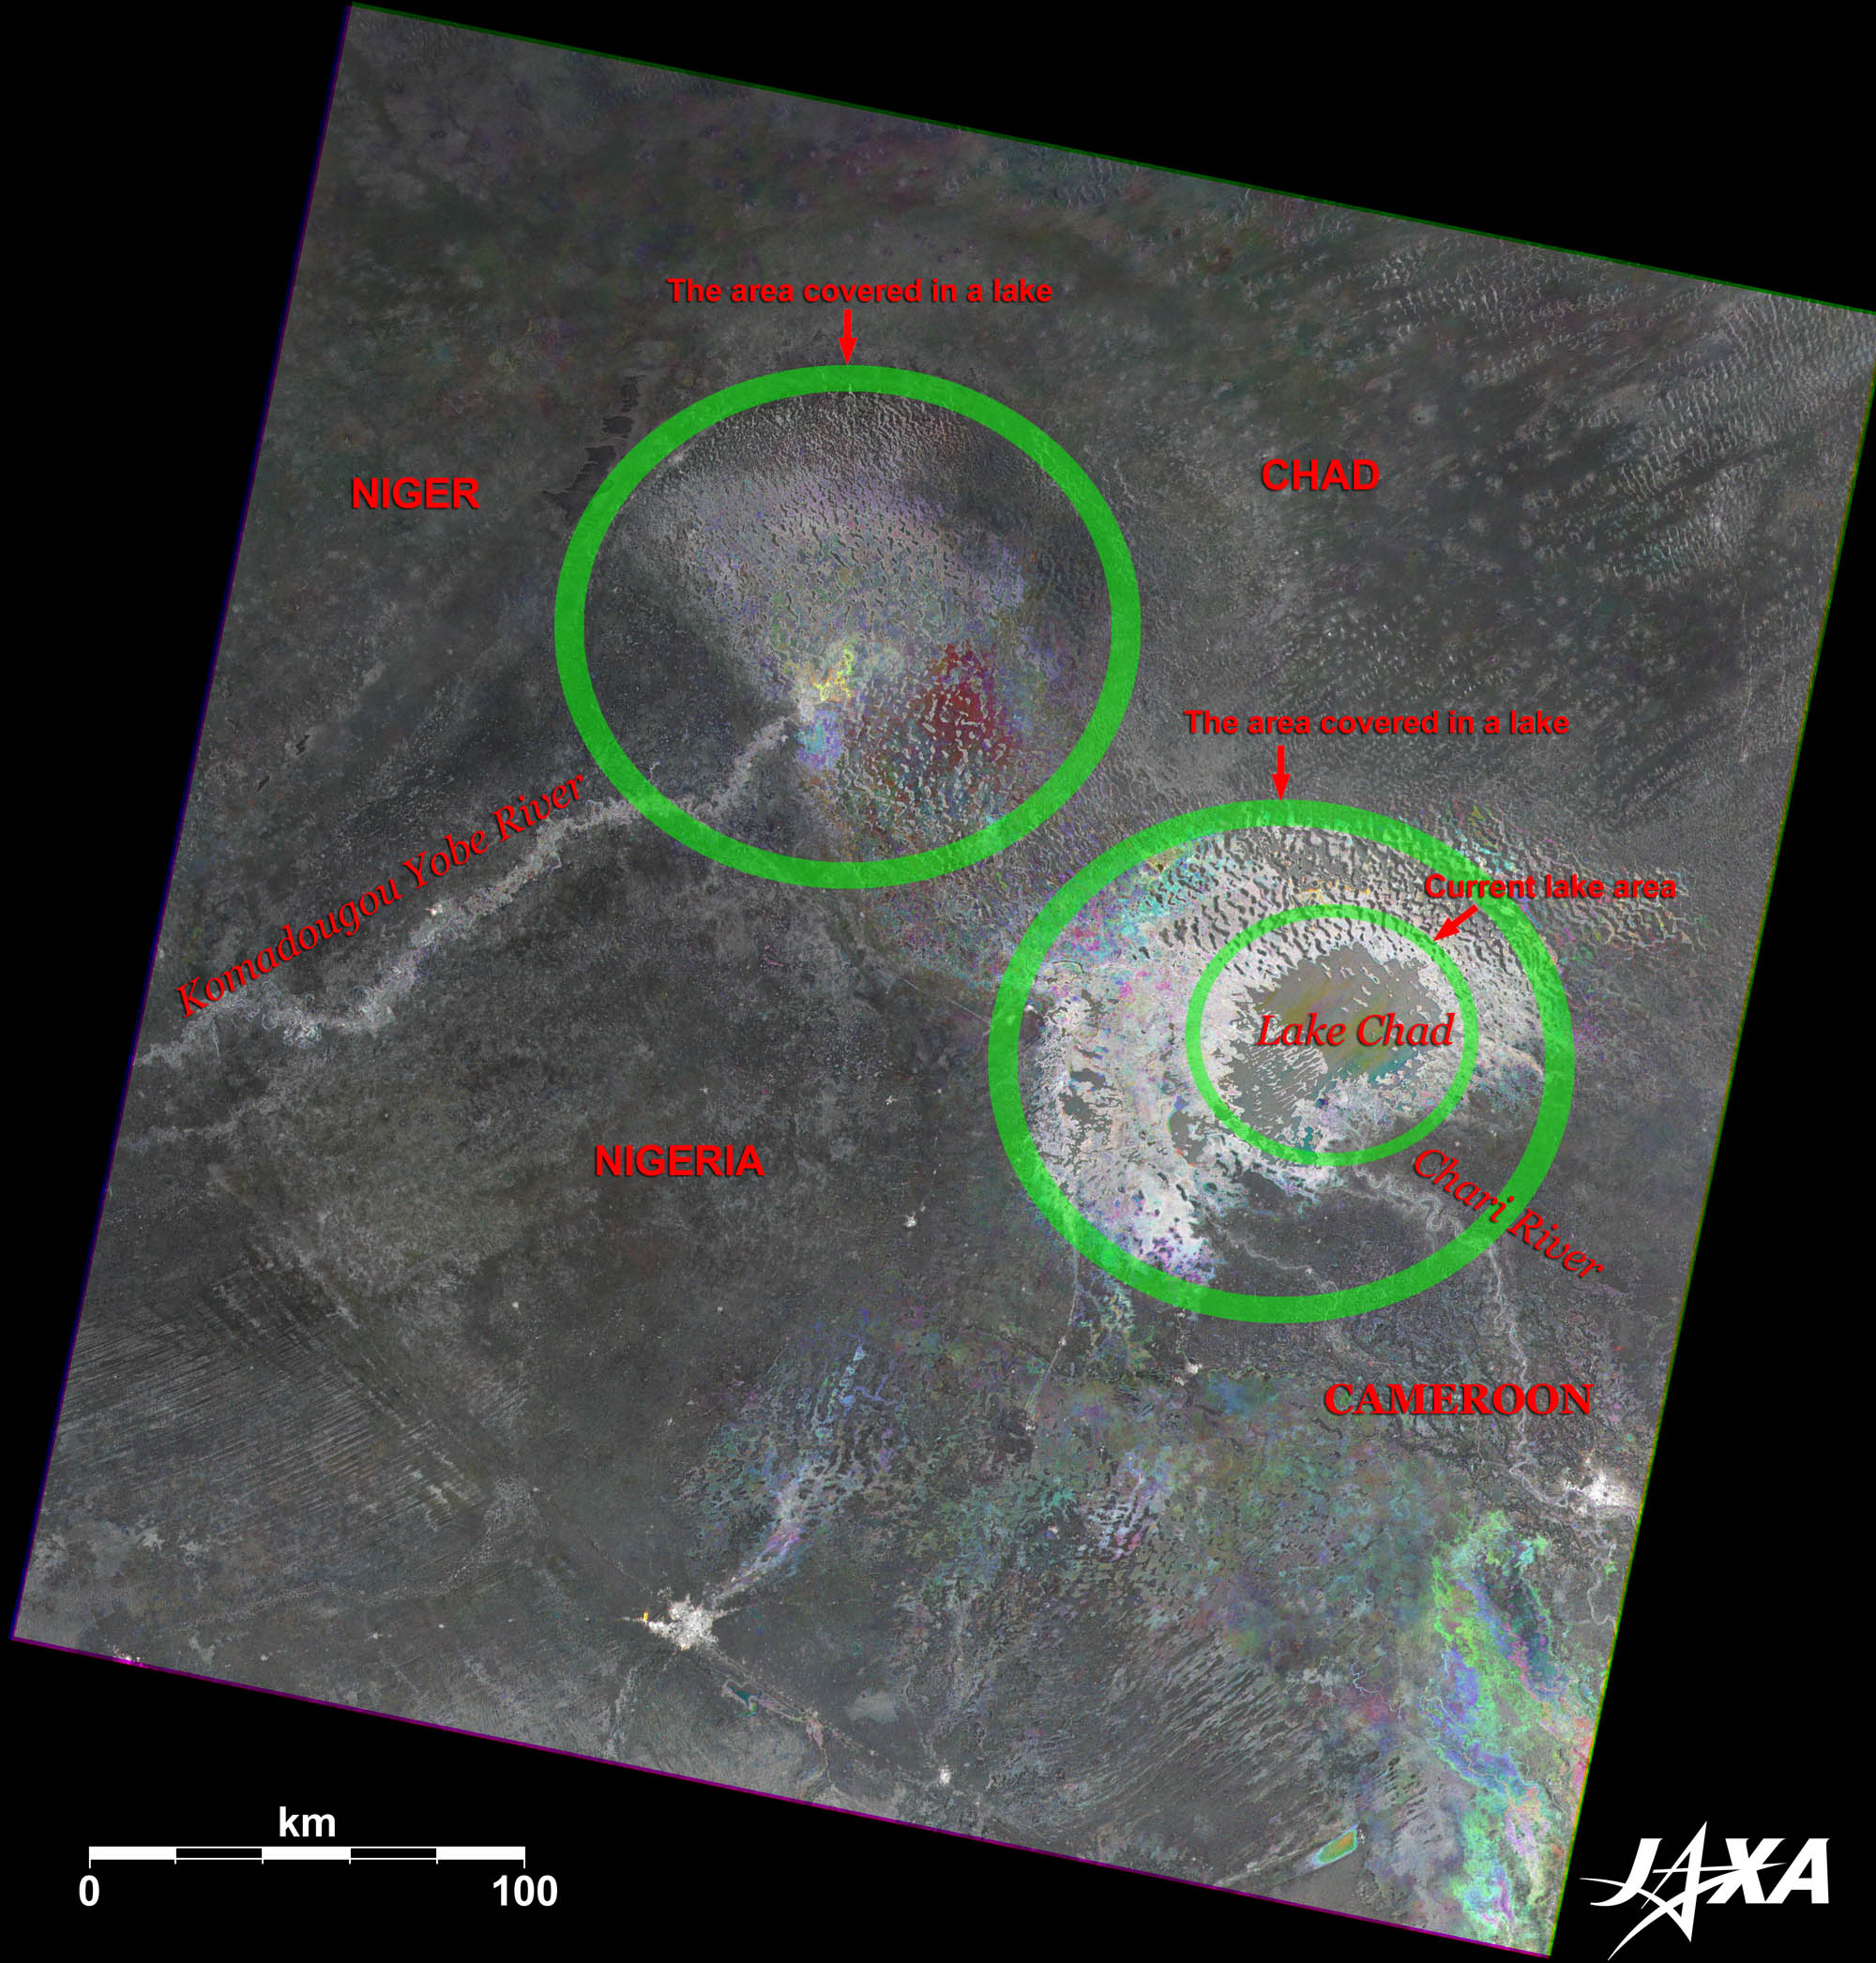
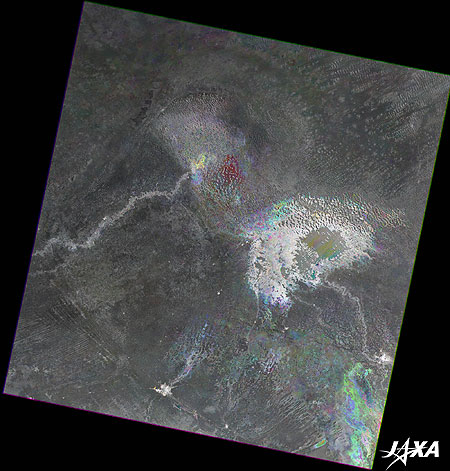
Fig. 1. Lake Chad and Its Surroundings
Lake Chad (kmz, 4.12 MB, Low Resolution) as seen on Google Earth
Figure 1 is a color composite image of Lake Chad and its surroundings using three radar images taken by ALOS (Daichi) in January 2010, December 2008, and December 2007. The bright area in the middle of the image and the slightly bright area in the upper-left of the image were once covered by water. Now, we only see water as the slightly dark part in the bright area. The dark area bordering the image is desert.
Lake Chad is located in the middle of the African continent, in the arid southern region of the Sahara Desert. The lake is a shallow freshwater lake and the shore is covered by reeds and papyrus. The Chari River is seen as bright, long, and narrow in the bottom-right. The Yobe River is also seen as bright and long in the left of the image. In the radar images, trees and buildings are bright, and flat portions of land are dark. The lakeshore and river side are covered by plants; therefore, those parts are bright.
Caption on
Caption off
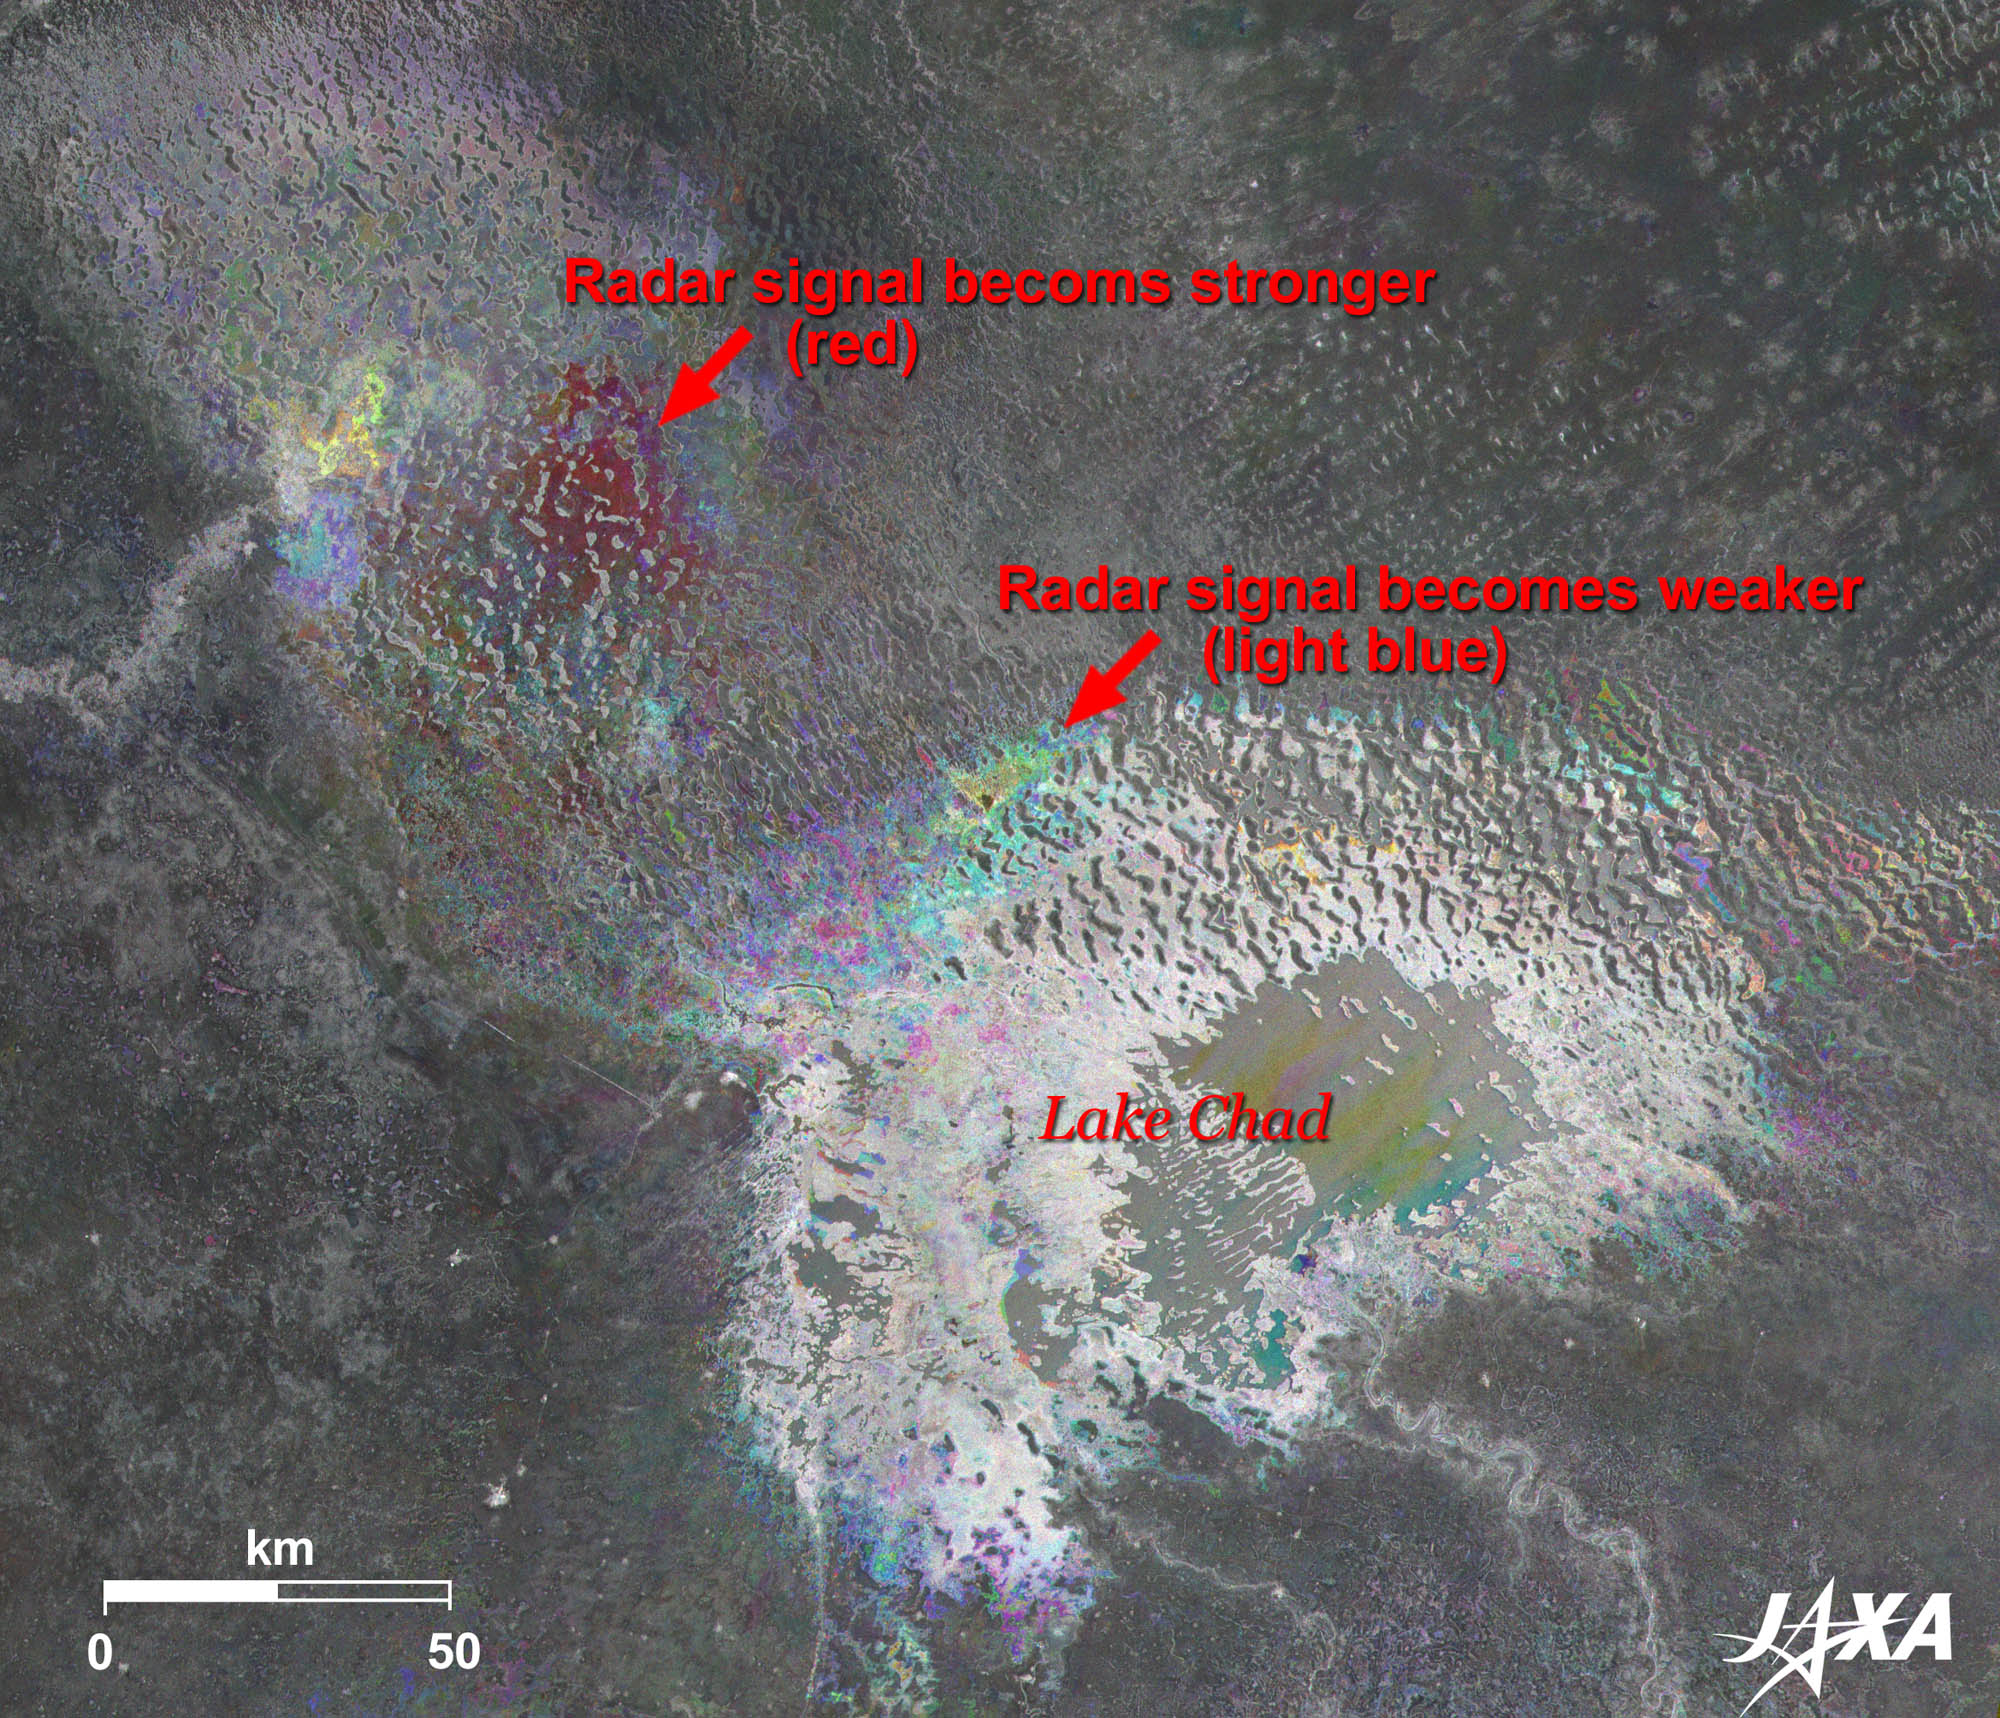
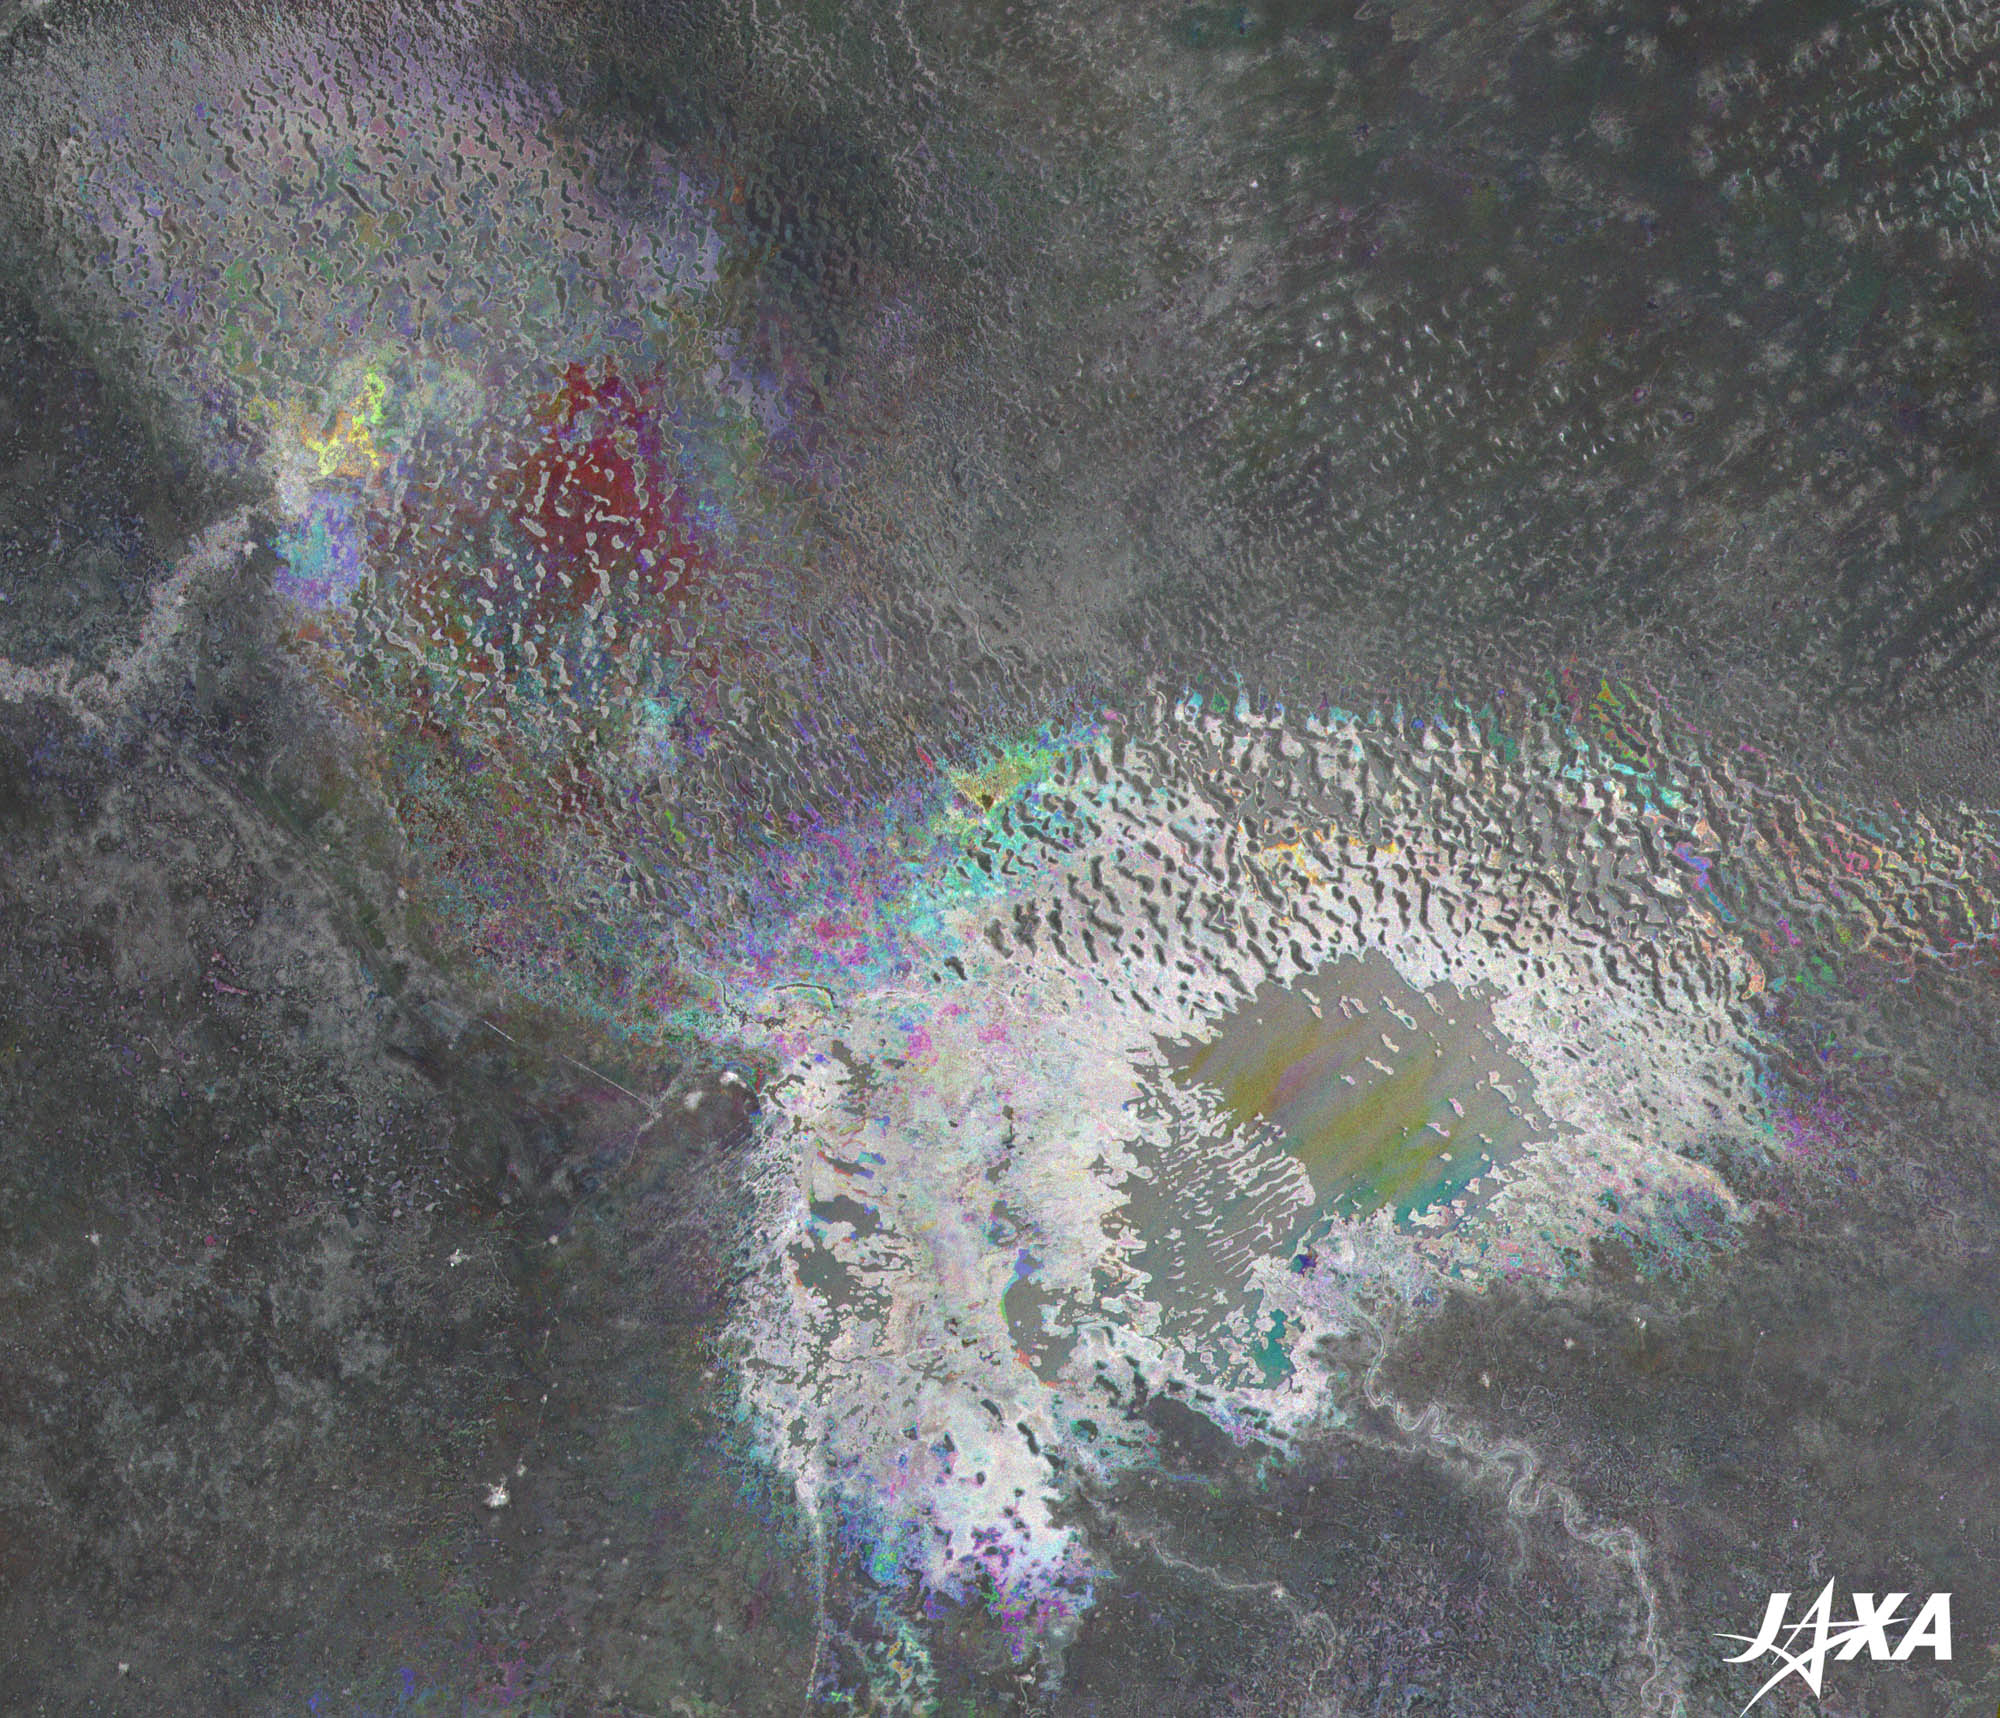
Figure 2 is an enlarged image of Lake Chad’s surroundings. Some regions are seen as red, yellow, and light blue. The colors reflect surface changes over 3 years. If the number of plants decline and desertification advances, the image becomes darker. On the other hand, if areas of water decline and the number of plants increases, the image becomes brighter. In Figure 2, the red region is where the reflection of the radar signal becomes stronger and shows the increase in plants. The light blue region is where the reflection of the radar signal becomes weaker and shows desertification.
Caption on
Caption off
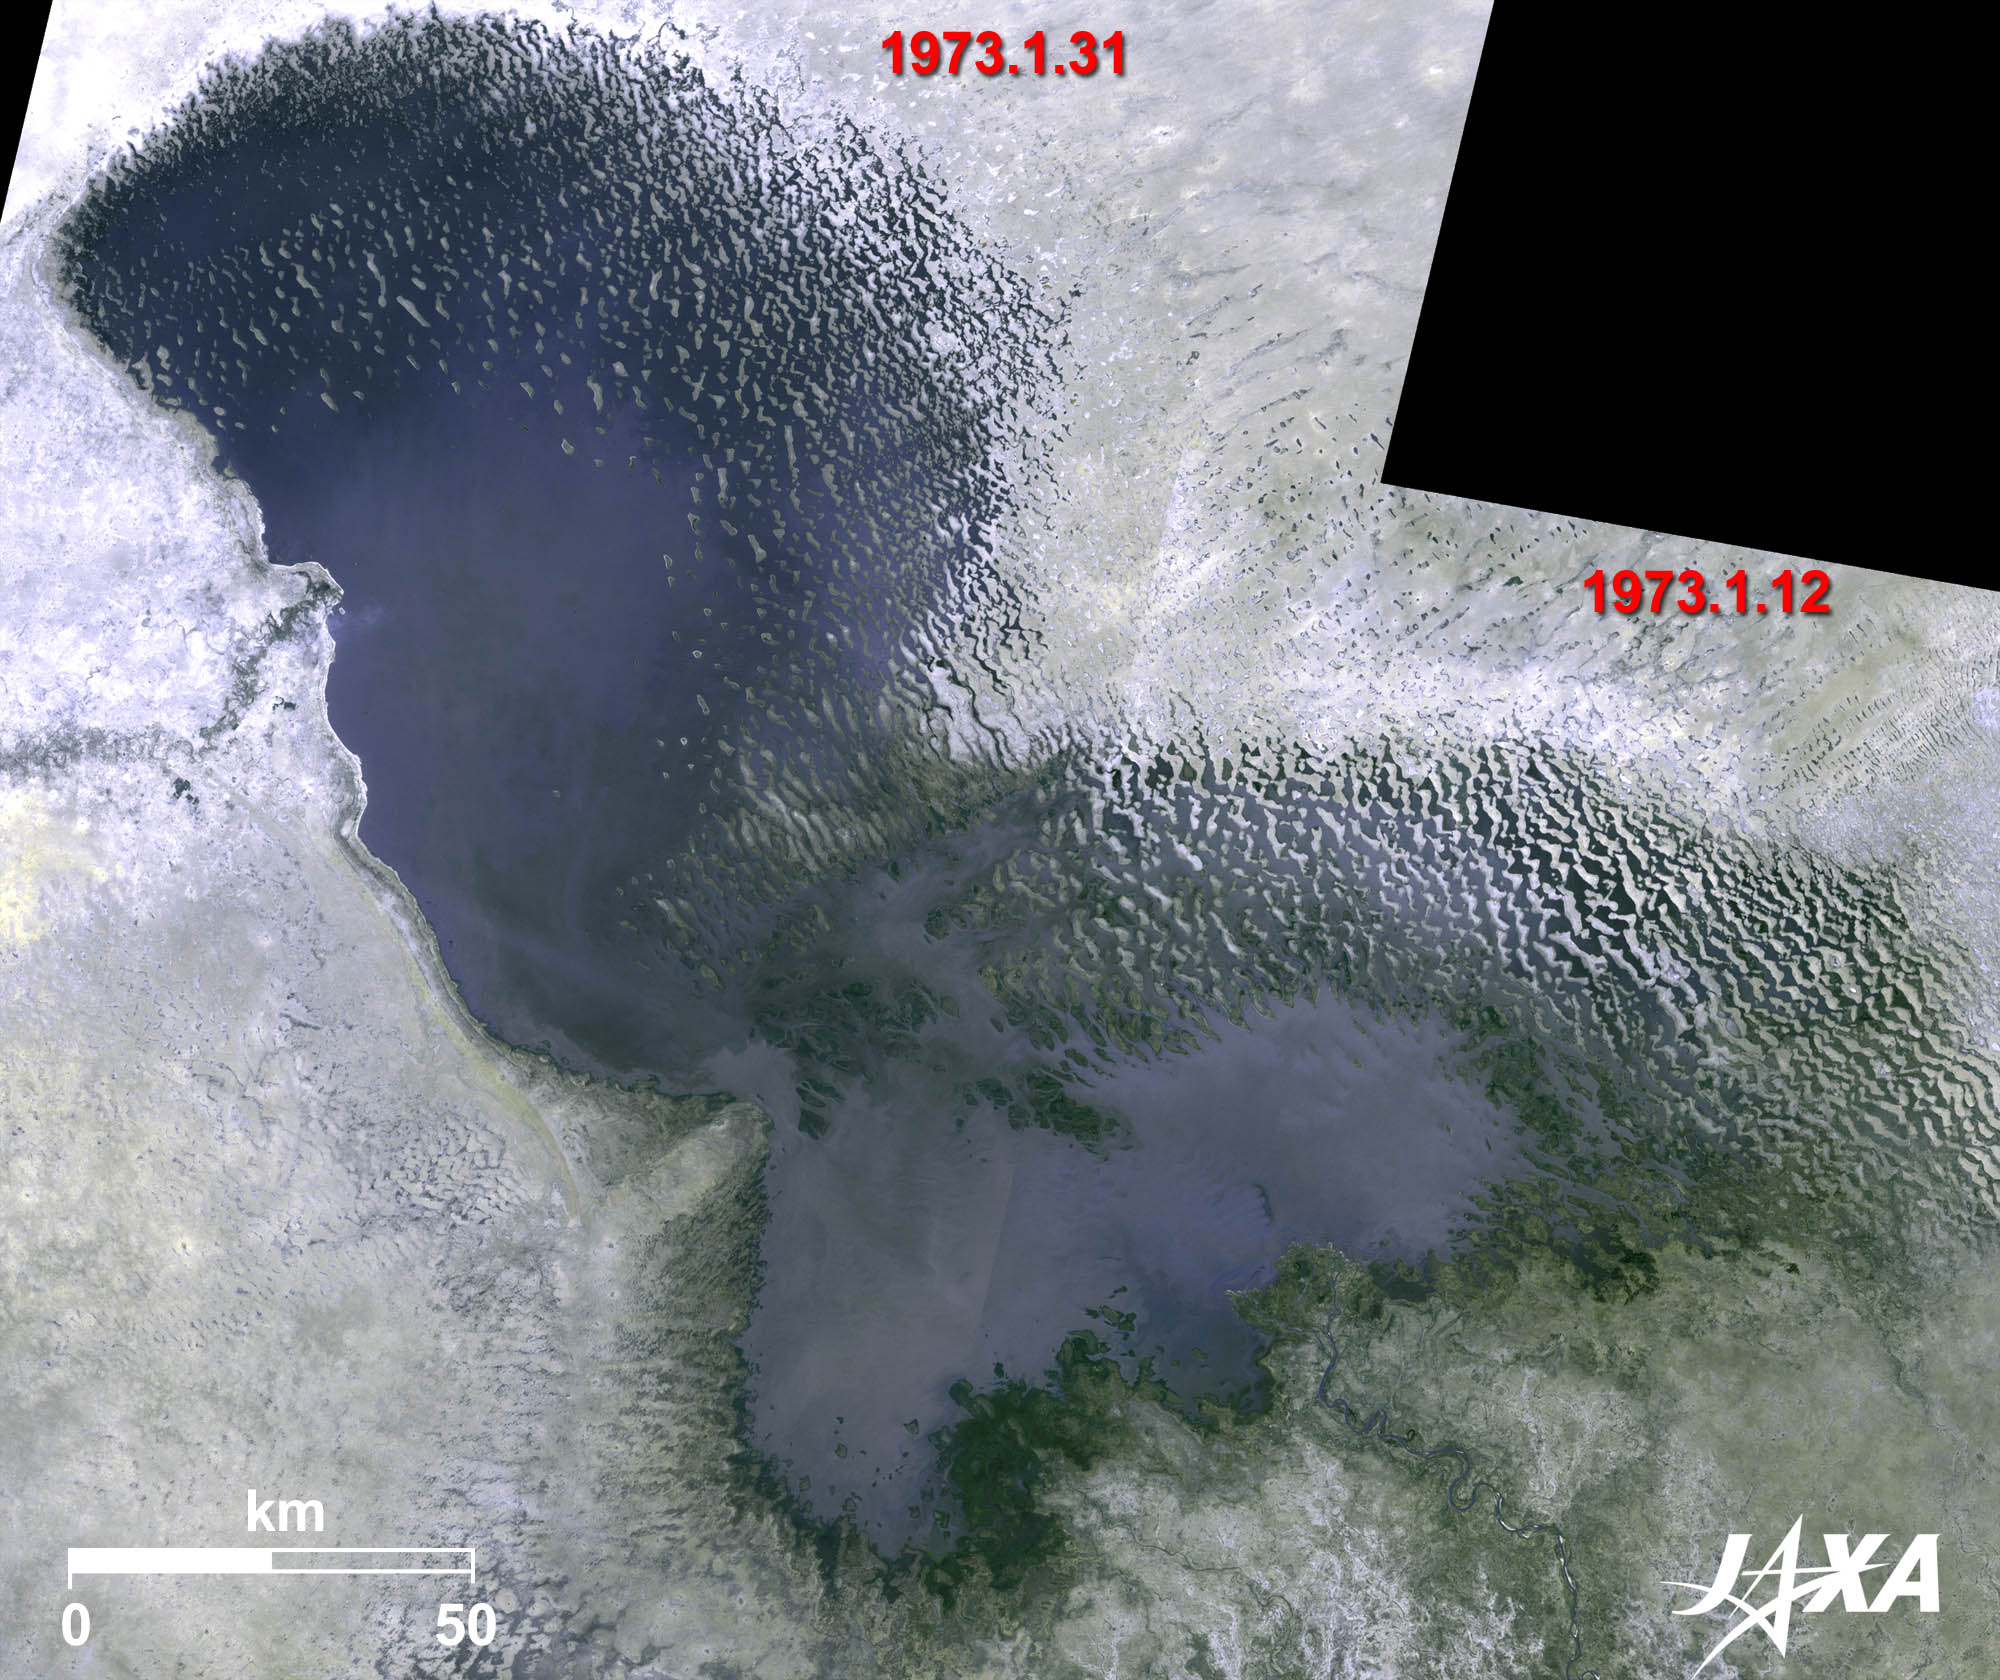
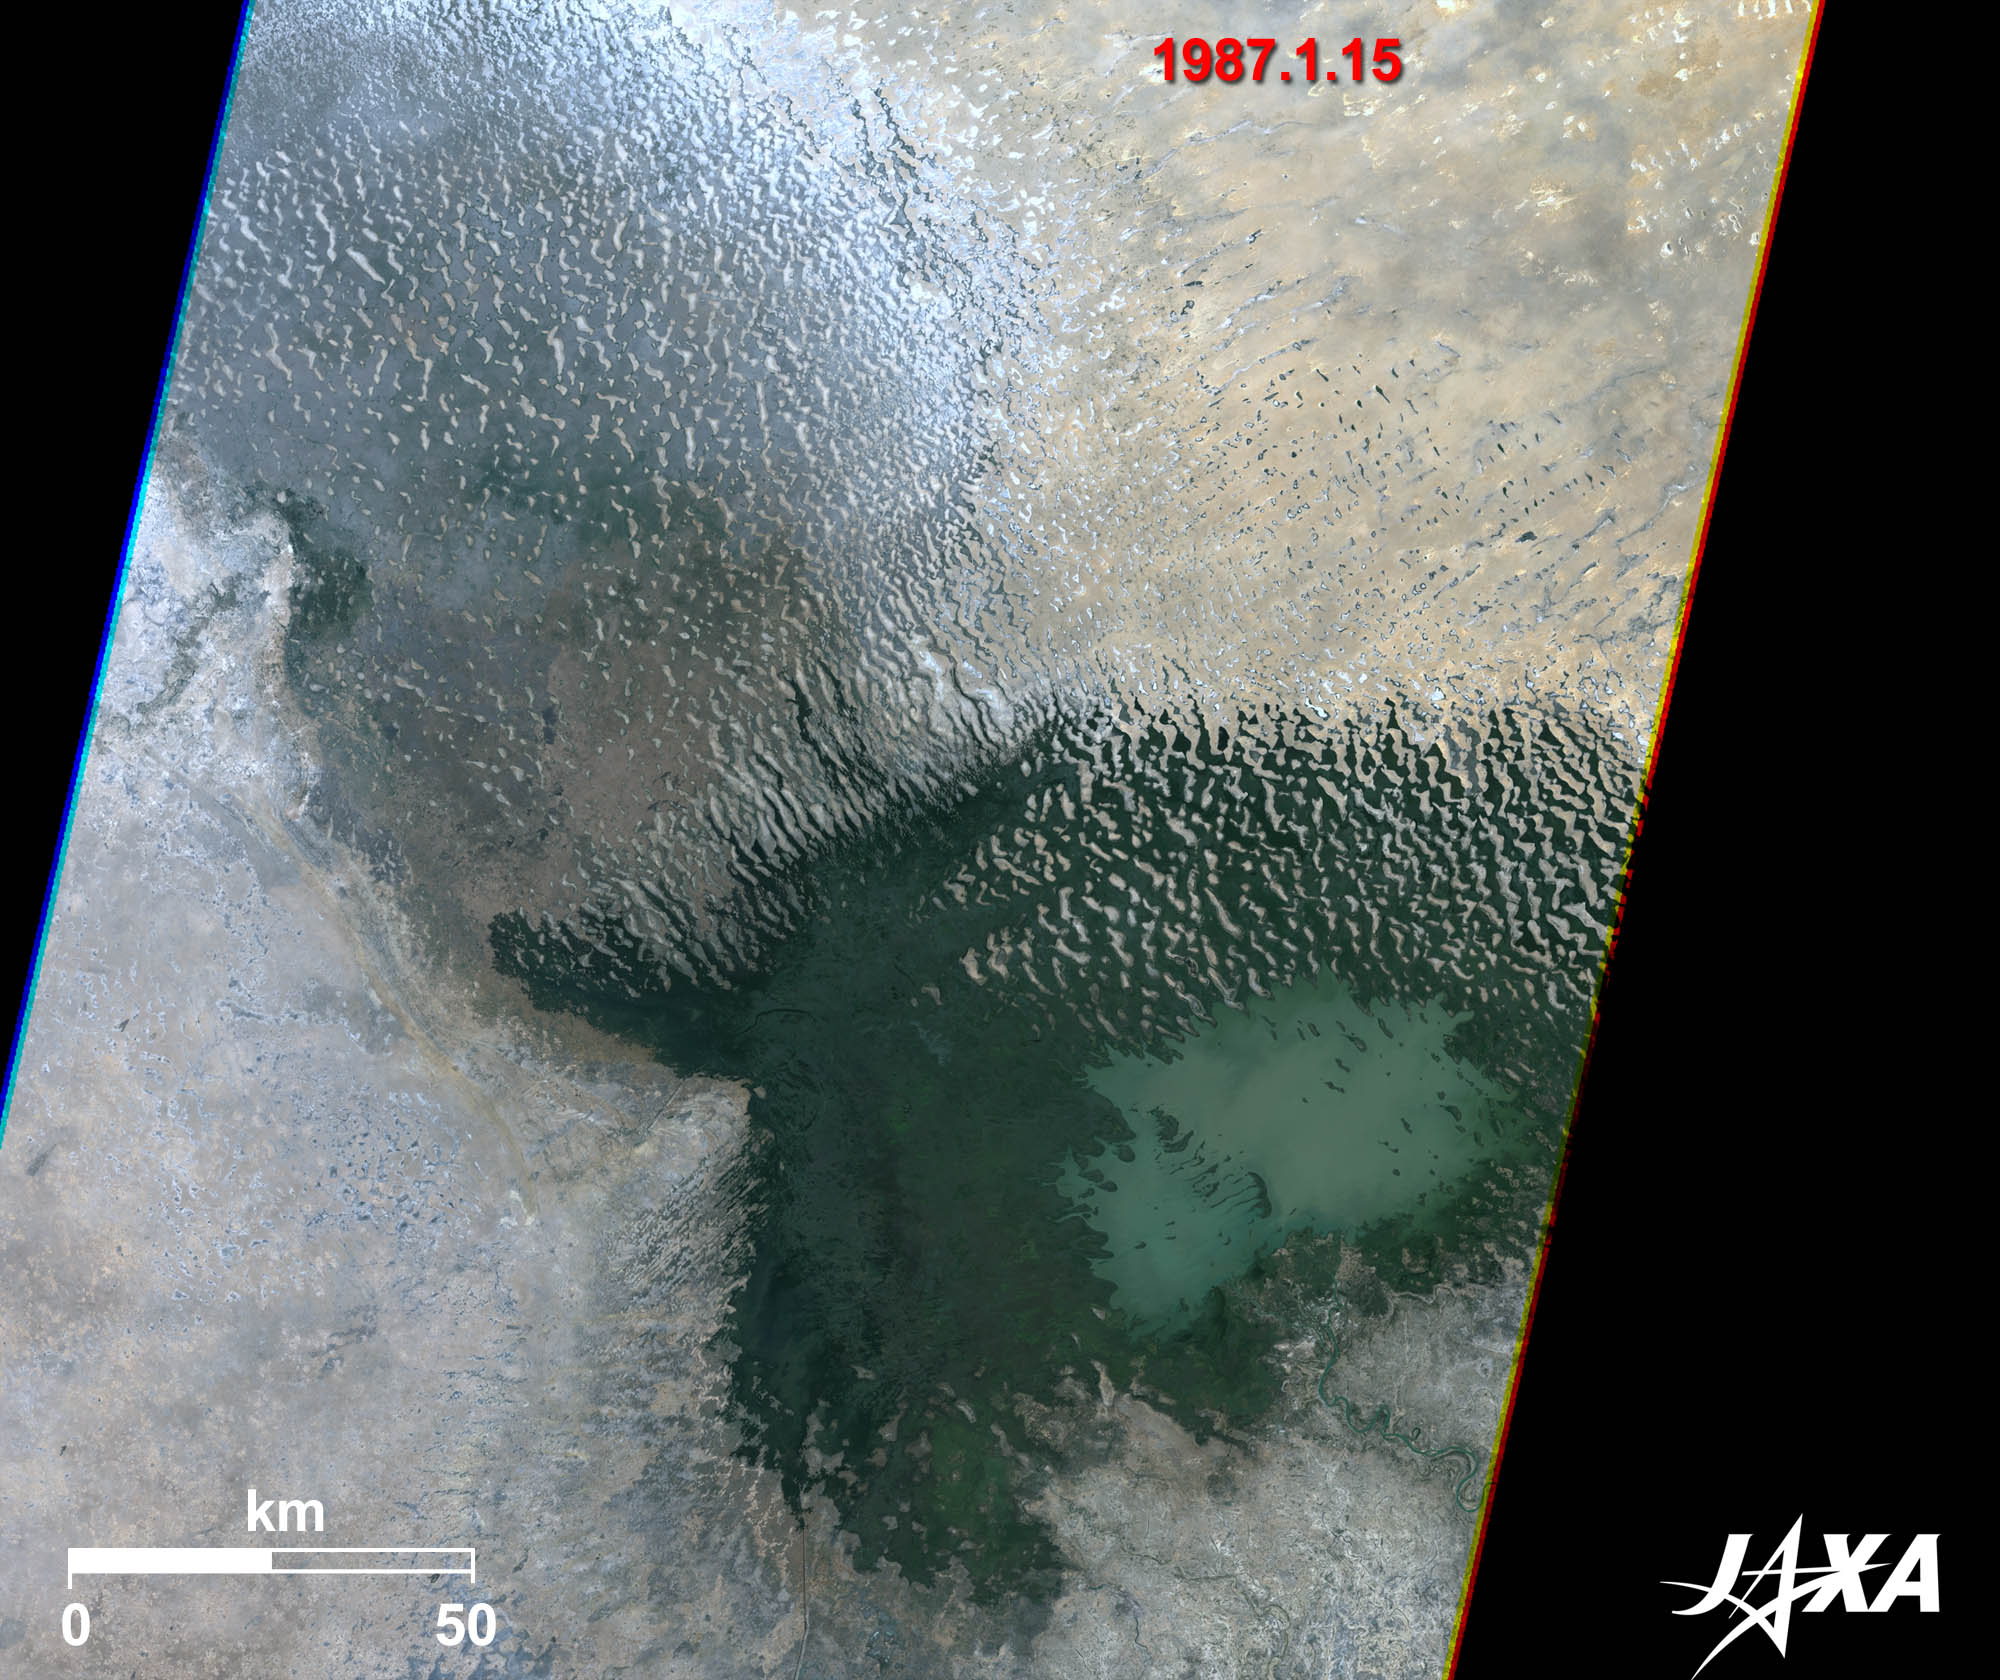
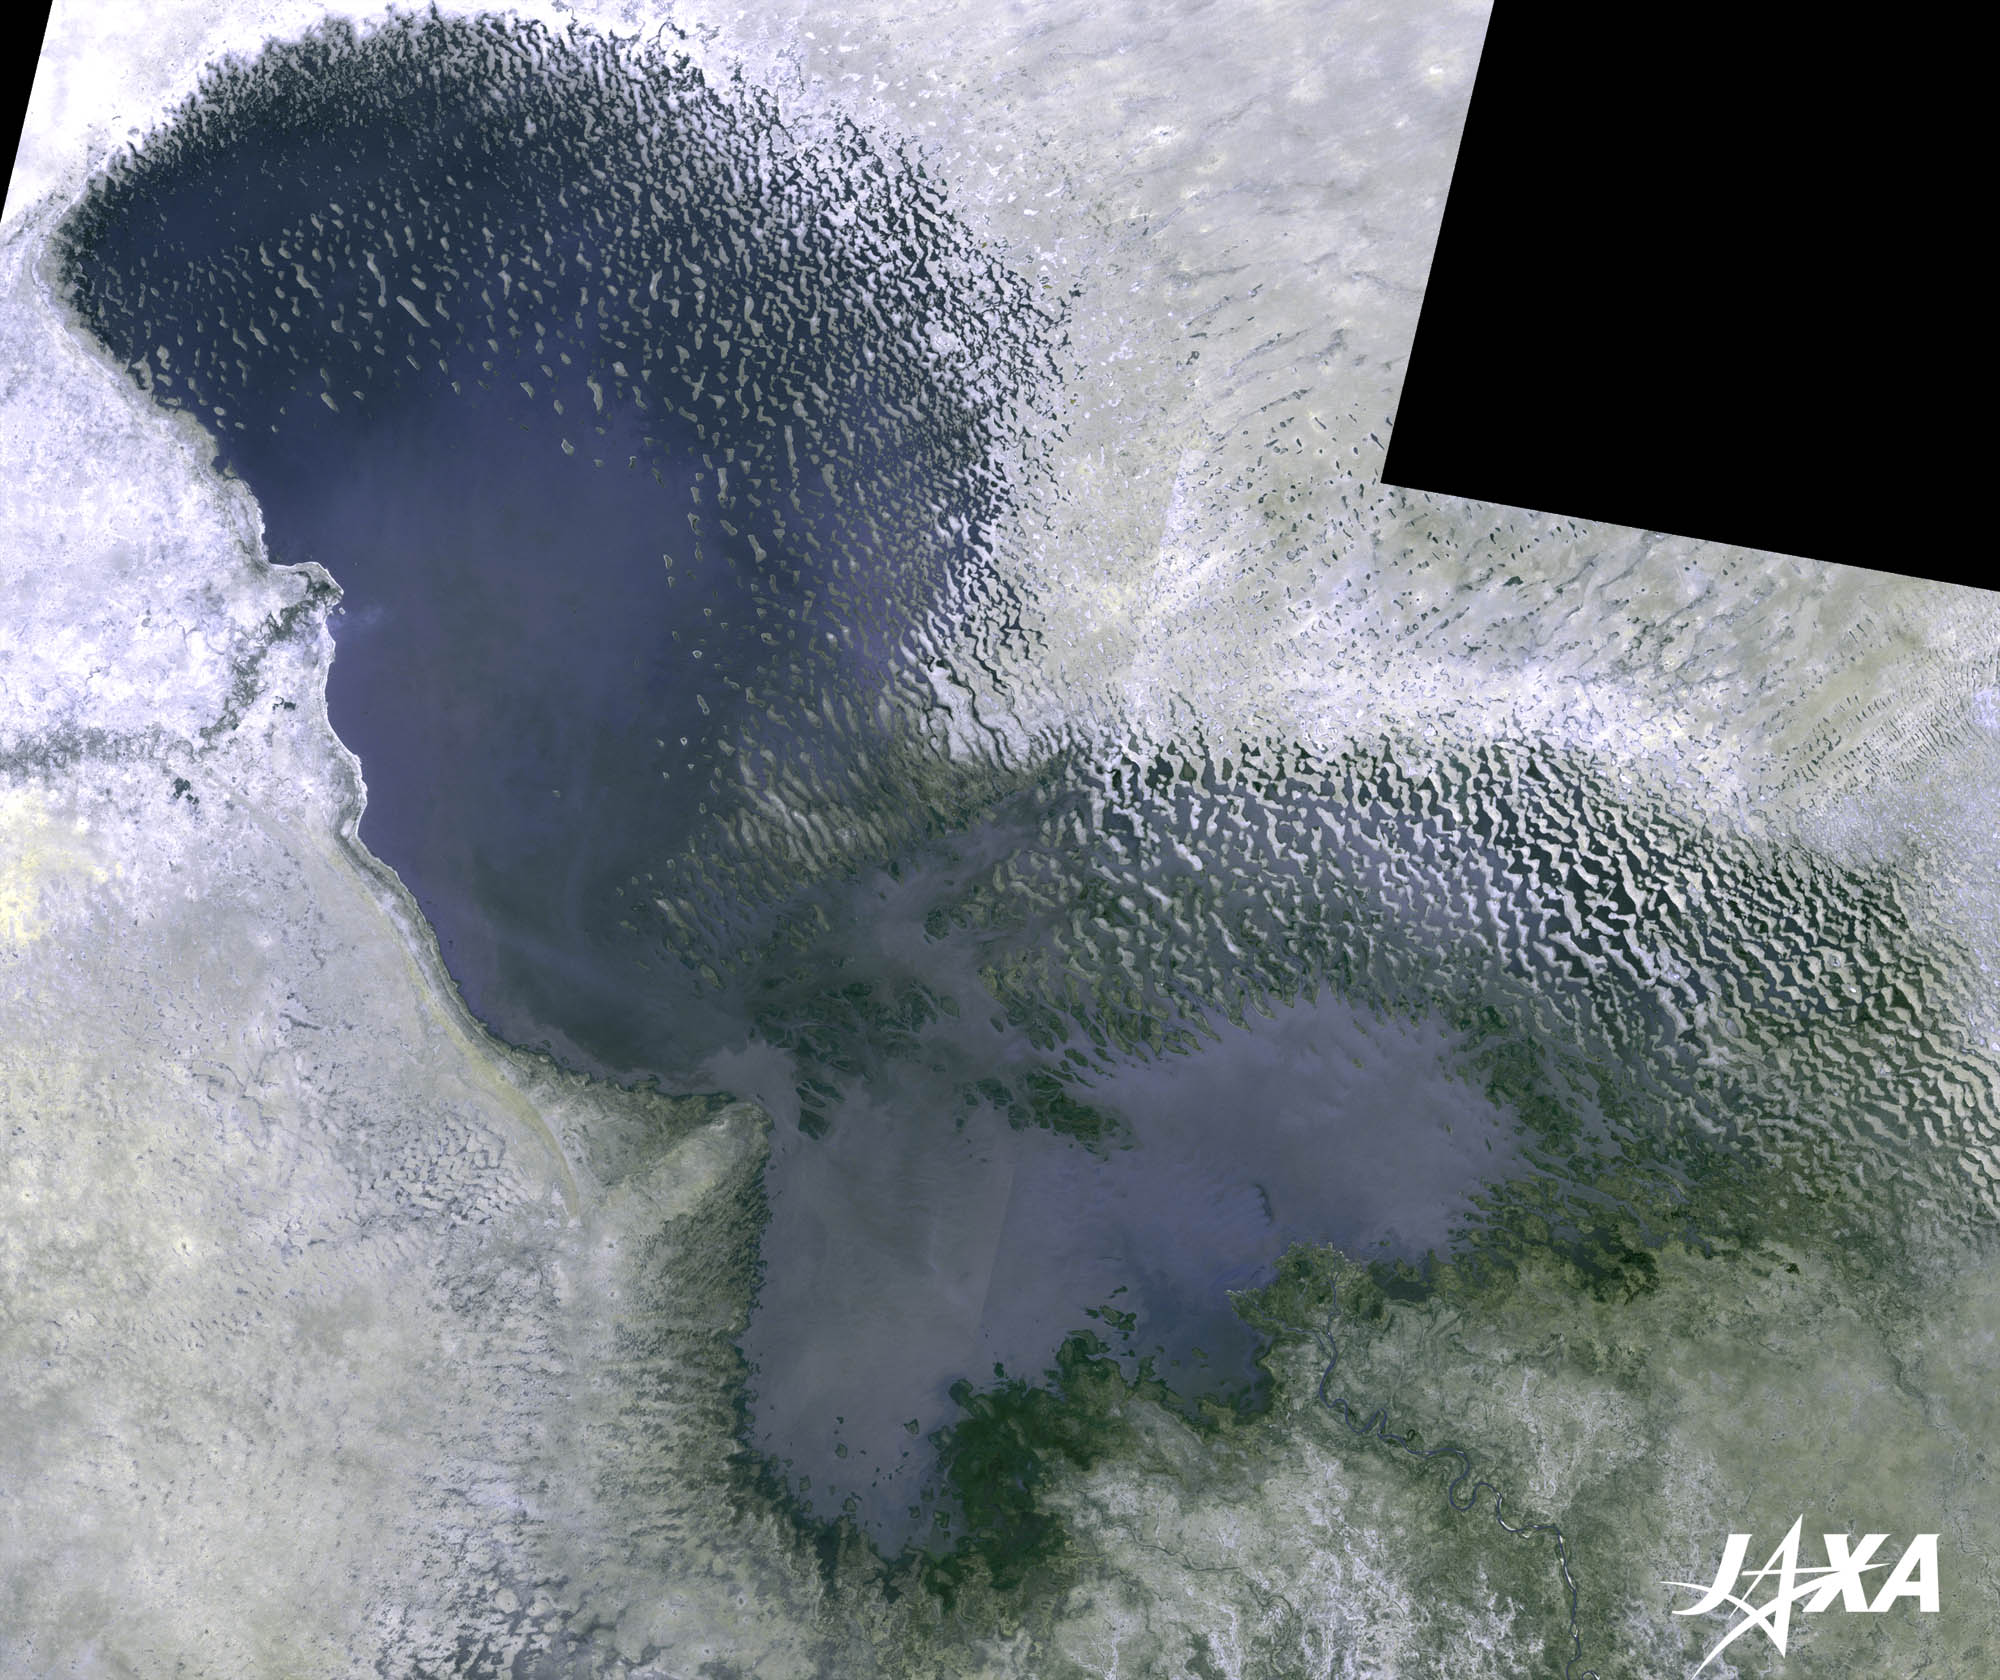
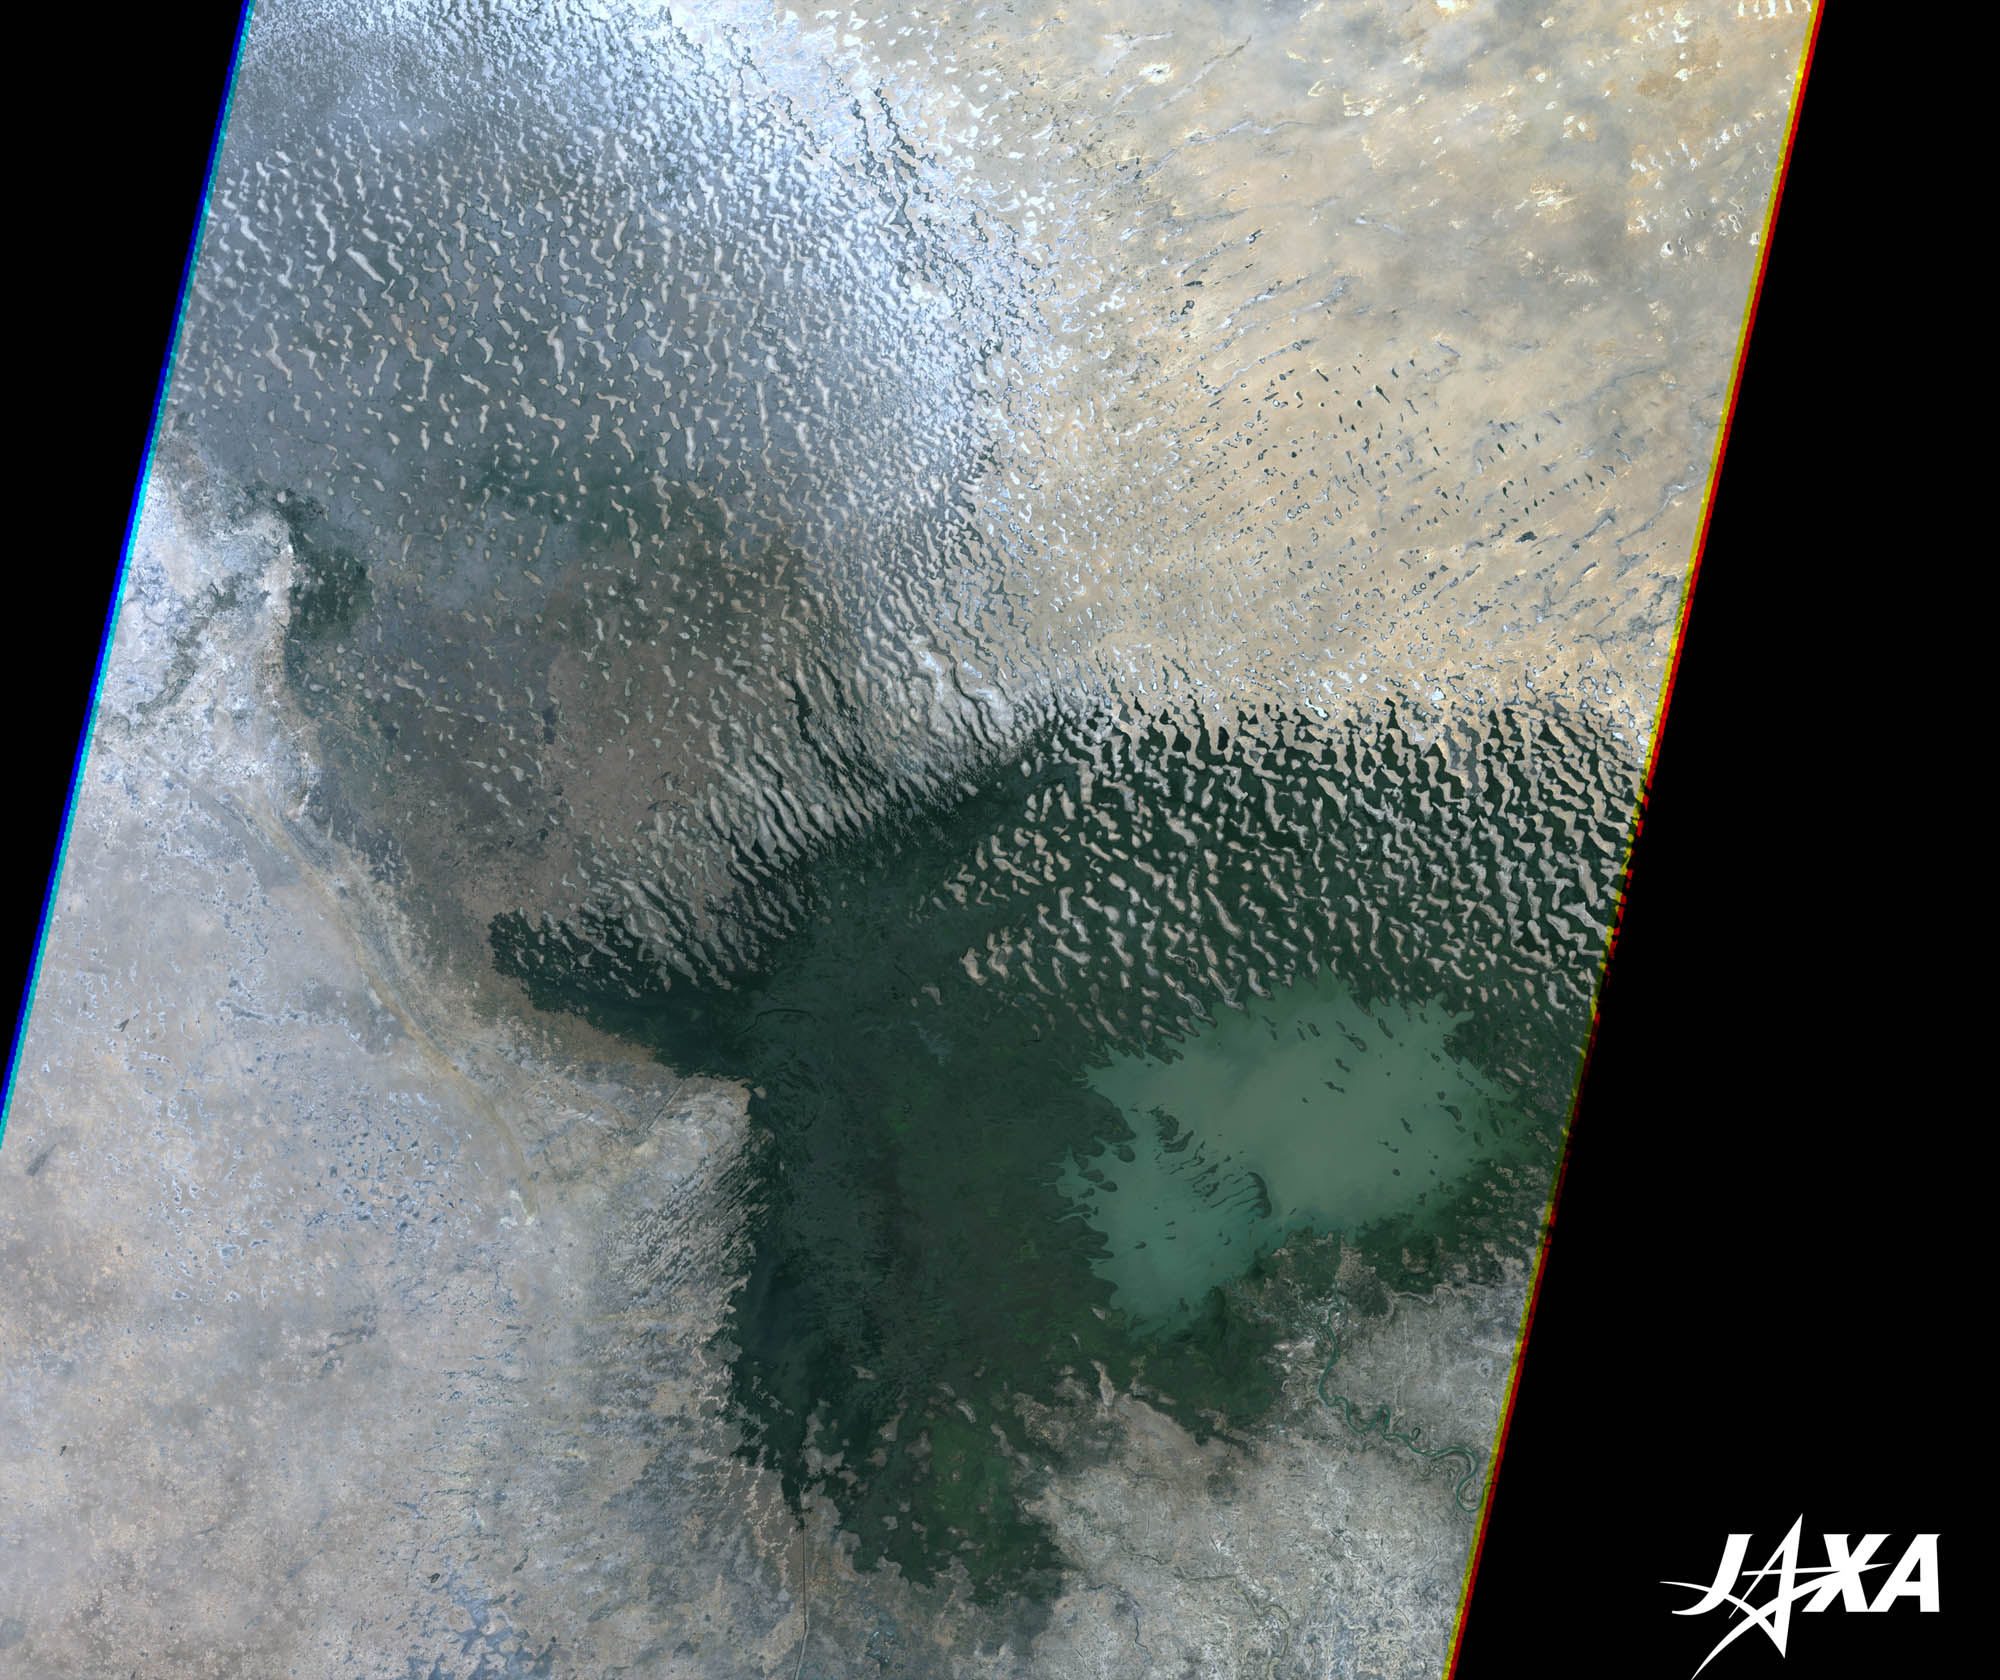
Figure 3 shows images of Lake Chad taken by Landsat in 1973 and in 1987. The left image in 1973 shows the water spreading from the upper-left to the bottom-right; however, the right image of 1987 shows only a very small water region in the bottom-right.
Historically, Lake Chad has repeatedly expanded and shrunk. Fossils show that the lake dried up six times in the past 1,000 years. You can see crescent-shaped sand dunes distributed in the desert that were formed by strong winds. Remnants of sand dunes are visible in the north and northeast of the lake. Those wrinkle-shaped structures or small islands in the lake were formed when the lake dried up in the past.
The recent dramatic changes are considered to be caused by irrigation agriculture developed along the Chari River and cattle breeding around Lake Chad. Human activity is accelerating the shrinkage of Lake Chad.
Lakes in Africa
The largest lake in Africa is Lake Victoria—third in the world and second of all freshwater lakes. The deepest lake in Africa—and second in the world—is Lake Tanganyika. Many lakes along the Great Rift Valley in East Africa are sources of the Nile and Congo rivers.
On the contrary, Lake Chad, located in Central Africa, is not connected to the ocean. The lake is large but shallow, making it vulnerable to environmental changes. The expansion and shrinkage of the lake in the past is considered to be caused solely by climate change. When rainfall or water inflow decreases, the area of the lake rapidly diminishes.
Explanation of the Images:
| Satellite: | Advanced Land Observing Satellite (ALOS) (Daichi) |
| Sensor: | Phased Array L-band Synthetic Aperture Radar (PALSAR) |
| Date: | 0930 (UTC) on December 28, 2007 (Fig. 1, 2) 0928 (UTC) on December 30, 2008 (Fig. 1, 2) 0928 (UTC) on January 2, 2010 (Fig. 1, 2) |
| Ground resolution: | 100 m (ScanSAR mode) |
| Map Projection: | Universal Transversal Mercator (UTM) |
The color composite images (Fig. 1, 2) are produced by assigning red to the image of 2010, green to 2008, and blue to 2007 and show the surface changes in the color. Each color indicates the following:
| Red: | The place where plants grew from December 2008 until January 2010 |
| Yellow: | The place where plants grew from December 2007 until December 2008 |
| Cyan: | The place that turned into desert from December 2008 until January 2010 |
| Blue: | The place that turned into desert from December 2007 until December 2008 |
| Satellite: | Landsat-1 (USA) |
| Sensor: | Multi Spectral Scanner (MSS) |
| Date: | January 12, 1973 (Fig. 3 left) January 31, 1973 (Fig. 3 left) |
| Ground resolution: | 79 m |
| Map Projection: | Universal Transversal Mercator (UTM) |
The Landsat image is downloaded without charge from the Global Land Facility (GLCF) Earth Science Data Interface site at the University of Maryland. The color composite image is produced by assigning red to Band 2 (600-700 nm), green to Band 3 (700-800 nm), and blue to Band 1 (500-600 nm). In the above image, green is assigned to the sum of 90 percent of Band 2 and 10 percent of Band 3, which improves the visibility of vegetation. The resulting images have natural coloring as if seen by the naked eye. WHITE in the figure represents the desert, GREEN the plants, and BLUE the water.
| Satellite: | Landsat-5 (USA) |
| Sensor: | Thematic Mapper (TM) |
| Date: | January 15, 1987 (Fig. 3 right) |
| Ground resolution: | 30 m |
| Map Projection: | Universal Transversal Mercator (UTM) |
This image data was downloaded free of charge from the USGS Global Visualization Viewer (Glovis). The color composite image is produced by assigning red to Band 3 (630 to 690 nm), green to Band 2 (520 to 600 nm), and blue to Band 1 (450 to 520 nm). The resulting image has natural coloring as if seen by the naked eye.
Search by Year
Search by Categories


Tags
-
#Earthquake
-
#Land
-
#Satellite Data
-
#Aerosol
-
#Public Health
-
#GCOM-C
-
#Sea
-
#Atmosphere
-
#Ice
-
#Today's Earth
-
#Flood
-
#Water Cycle
-
#AW3D
-
#G-Portal
-
#EarthCARE
-
#Volcano
-
#Agriculture
-
#Himawari
-
#GHG
-
#GPM
-
#GOSAT
-
#Simulation
-
#GCOM-W
-
#Drought
-
#Fire
-
#Forest
-
#Cooperation
-
#Precipitation
-
#Typhoon
-
#DPR
-
#NEXRA
-
#ALOS
-
#GSMaP
-
#Climate Change
-
#Carbon Cycle
-
#API
-
#Humanities Sociology
-
#AMSR
-
#Land Use Land Cover
-
#Environmental issues
-
#Quick Report
-
#GOSAT-GW
Related Resources


Related Tags
Latest Observation Related Articles
-
 Latest Observation 2026.06.05 Fri [Quick Report] Typhoon No. 6, “JANGMI”, brought heavy rain to Japan. – Results of satellite data analysis –
 -
 Latest Observation 2026.04.16 Thu [Quick Report] EarthCARE Captured the Eye of Typhoon Sinlaku
 -
 Latest Observation 2025.12.03 Wed [Quick Report] Analysis results from satellite precipitation data on the record-breaking heavy rainfall occurring in Southeast Asia in late November 2025
 -
 Latest Observation 2025.10.01 Wed [Quick Report] Hurricane Humberto “Eye” captured by EarthCARE satellite (Hakuryu)
Stay Connected
