


Applications
2023.06.15 Thu
Contribution to SDGs Goal 11 “Sustainable cities and communities”
SDGs Goal 11 “Sustainable cities and communities” aims to “Make cities and human settlements inclusive, safe, resilient and sustainable”. As this goal is large and abstract, nine specific Targets have been set to achieve the goal. Among them, Target 11.3 has been set for the enhancement of human settlement planning and management, which states “By 2030, enhance inclusive and sustainable urbanization and capacity for participatory, integrated and sustainable human settlement planning and management in all countries”.
In order to measure progress toward “sustainable human settlement planning and management”, each of the SDG targets has one of more “Indicators” to enable measurement, comparison, and evaluation of progress toward the target. Target 11.3 has the following two indicators.
- Ratio of land consumption rate to population growth rate (Indicator 11.3.1)
- Proportion of cities with a direct participation structure of civil society in urban planning and management that operate regularly and democratically (Indicator 11.3.2)
Regarding the collection of information on these indicators, SDGs have designated a custodian agency in charge of each target, and the agencies publish data sources and methodologies (meta data) for collecting the necessary information. The custodian agency of Target 11.3 is the United Nations Human Settlements Programme (UN-Habitat), which explains that among Indicator 11.3.1, the population growth rate can be calculated from population data from censuses and surveys, and land consumption rate from multitemporal satellite imagery through remote sensing.
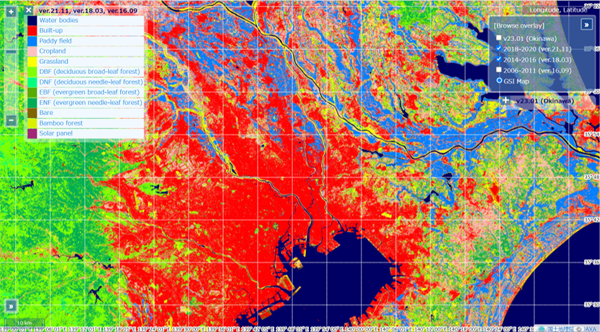
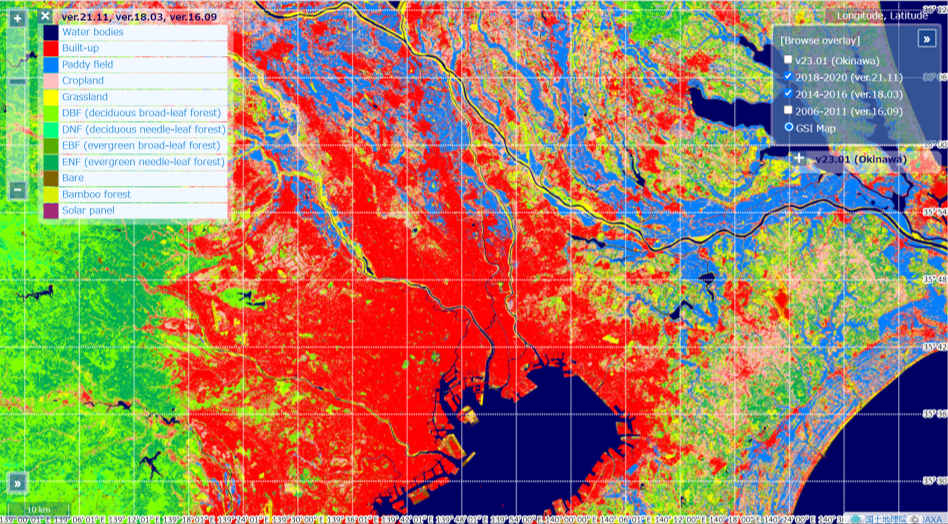
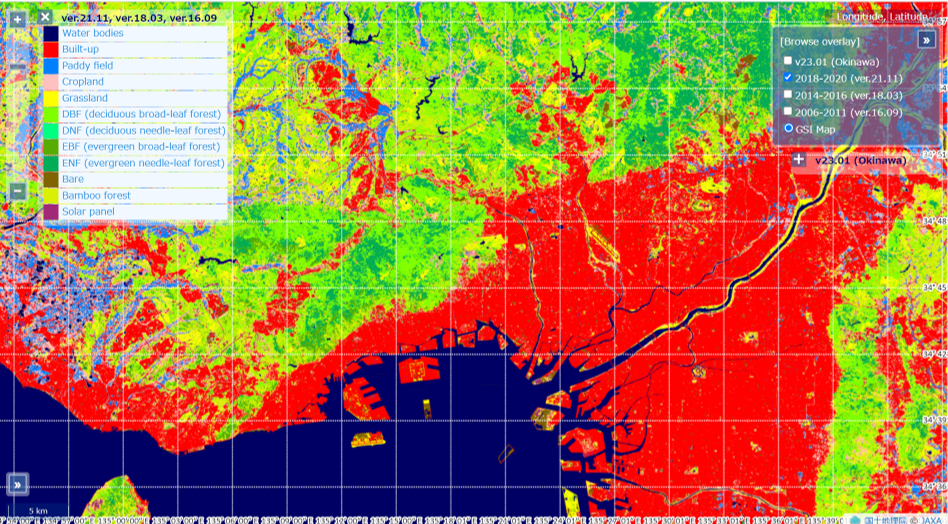
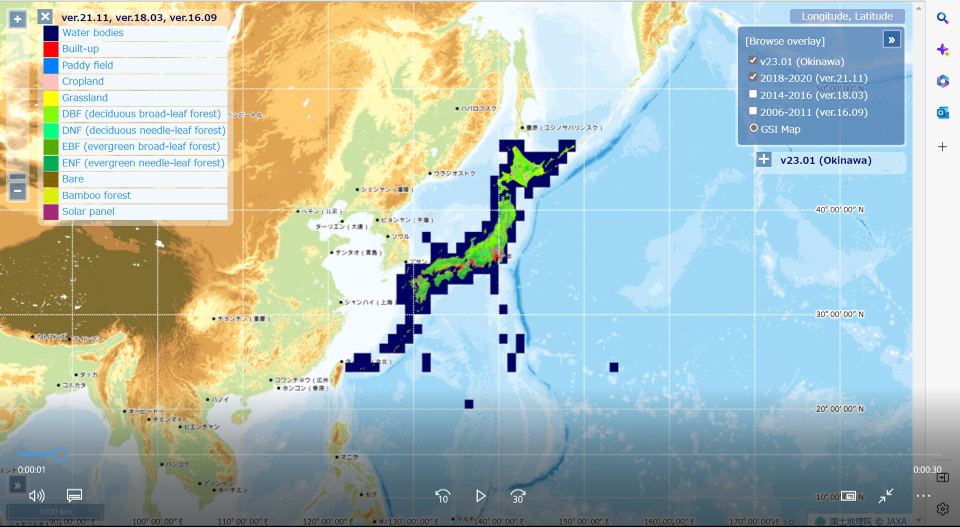
With satellite data, we can classify and understand how land is used (land use) or what the land surface is covered with (land cover). There have long been efforts to use land use and land cover information for land management, land planning, environmental monitoring, etc. JAXA has also created and released “High-Resolution Land Use and Land Cover Map Products” based on observation data by satellite such as the Advanced Land Observing Satellite “DAICHI” (ALOS) and “DAICHI-2” (ALOS-2), and this information can be applied to the land consumption rate specified by Indicator 11.3.1.
Meanwhile, in Japan, the “Council for Industry-Government-Academia Consultations on the Promotion of the Use of Big Data” established by the Ministry of Internal Affairs and Communications to promote mutual use of data between the public and private sectors has been conducting trial calculations and verification regarding the SDG indicators. For Indicator 11.3.1, the council estimated and verified with the data available in Japan including JAXA’s High-Resolution Land Use and Land Cover Map Products, and successfully calculated the ratio of population growth rate to land consumption rate for ordinance-designated cities. The calculated values for each city and the calculation method are published on the JAPAN SDGs Action Platform.
Search by Year
Search by Categories


Tags
-
#Earthquake
-
#Land
-
#Satellite Data
-
#Aerosol
-
#Public Health
-
#GCOM-C
-
#Sea
-
#Atmosphere
-
#Ice
-
#Today's Earth
-
#Flood
-
#Water Cycle
-
#AW3D
-
#G-Portal
-
#EarthCARE
-
#Volcano
-
#Agriculture
-
#Himawari
-
#GHG
-
#GPM
-
#GOSAT
-
#Simulation
-
#GCOM-W
-
#Drought
-
#Fire
-
#Forest
-
#Cooperation
-
#Precipitation
-
#Typhoon
-
#DPR
-
#NEXRA
-
#ALOS
-
#GSMaP
-
#Climate Change
-
#Carbon Cycle
-
#API
-
#Humanities Sociology
-
#AMSR
-
#Land Use Land Cover
-
#Environmental issues
-
#Quick Report
-
#GOSAT-GW
Related Resources


Related Tags
Applications Related Articles
-
 Applications 2024.01.15 Mon The Use of Earth Observation Satellite Data in the Humanities and Social Sciences (2)
 -
 Applications 2023.11.29 Wed The Use of Earth Observation Satellite Data in the Humanities and Social Sciences (1)
 -
 Applications 2023.08.04 Fri Contribution to SDGs Goal 6 “Clean Water and Sanitation”
 -
 Applications 2023.07.10 Mon Contribution to SDGs Goal 15 “Life on Land”
Stay Connected
