


Disaster
2023.02.14 Tue
ALOS-2 observations of earthquakes in southeastern Turkey in 2023 (Updated on March 2)
Summary
- Two earthquakes over magnitude 7 occurred in southeastern Turkey on February 6, 2023 (Japan Standard Time). The earthquakes caused significant damage in Turkey and neighboring Syria.
- In response to requests from the “Sentinel Asia” and the “International Disasters Charter”, JAXA conducted ALOS-2 observations on February 8, 2023 and provided data to related organizations.
- From the analysis of the observation data at JAXA and related organizations, we could confirm the changes that may have been caused by outstanding crustal deformation and building damage due to the earthquakes.
- [Update on February 15] Added the observation result of February 12, 2023.
- [Update on February 22] Added the observation result of February 16, 2023.
- [Update on March 2] Added the observation result of February 17, 21, and 22, 2023.
- ALOS-2/PALSAR-2 ScanSAR data are open to the public for free. Please click here.
Introduction
A large earthquake of magnitude 7.8 (U.S. Geological Survey (USGS)*1 estimate, the same shall apply hereafter) occurred in southeastern Turkey at around 10:17 on February 6, 2023 (Japan Standard Time, the same shall apply hereafter). In addition, another earthquake of magnitude 7.5 with epicenter in the north occurred at around 19:24 on the same day. In response to requests from the “Sentinel Asia” and the “International Disasters Charter”, JAXA conducted emergency observation by the Synthetic Aperture Radar “PALSAR-2” onboard “DAICHI-2” (ALOS-2) and provided data to related organizations. Figure 1 and Table 1 show the observation area this time.
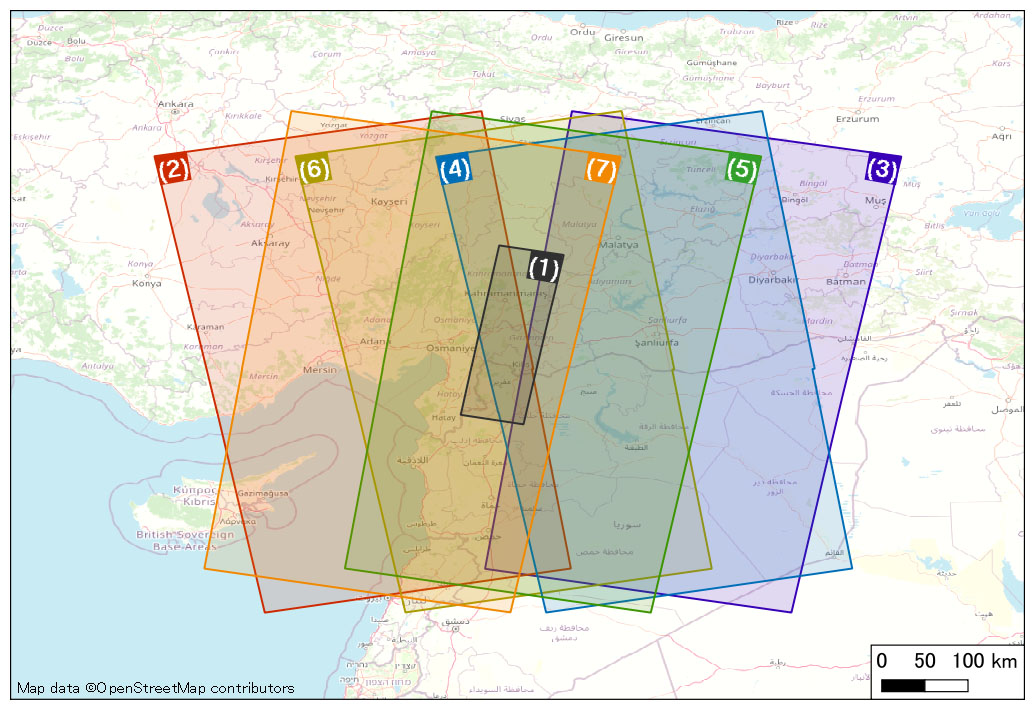
| Observation Date (JST) | Path Number | Observation Mode | Beam Number | Orbit, observation direction | |
| (1) | February 8, 18:40 | 78 | Stripmap 10m | F2-5 | Descending, right |
| (2) | February 12, 6:35 | 185 | ScanSAR | W2 | Ascending, right |
| (3) | February 12, 18:26 | 76 | ScanSAR | W2 | Descending, right |
| (4) | February 16, 6:21 | 183 | ScanSAR | W2 | Ascending, right |
| (5) | February 17, 18:32 | 77 | ScanSAR | W2 | Descending, right |
| (6) | February 21, 6:28 | 184 | ScanSAR | W2 | Ascending, right |
| (7) | February 22, 18:39 | 78 | ScanSAR | W2 | Descending, right |
Analysis examples by JAXA
1) Observation result on February 8
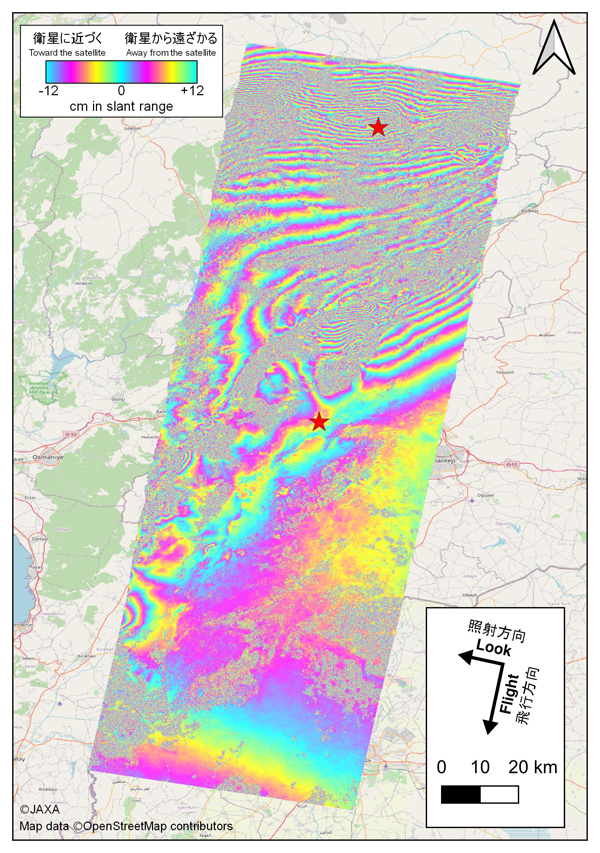
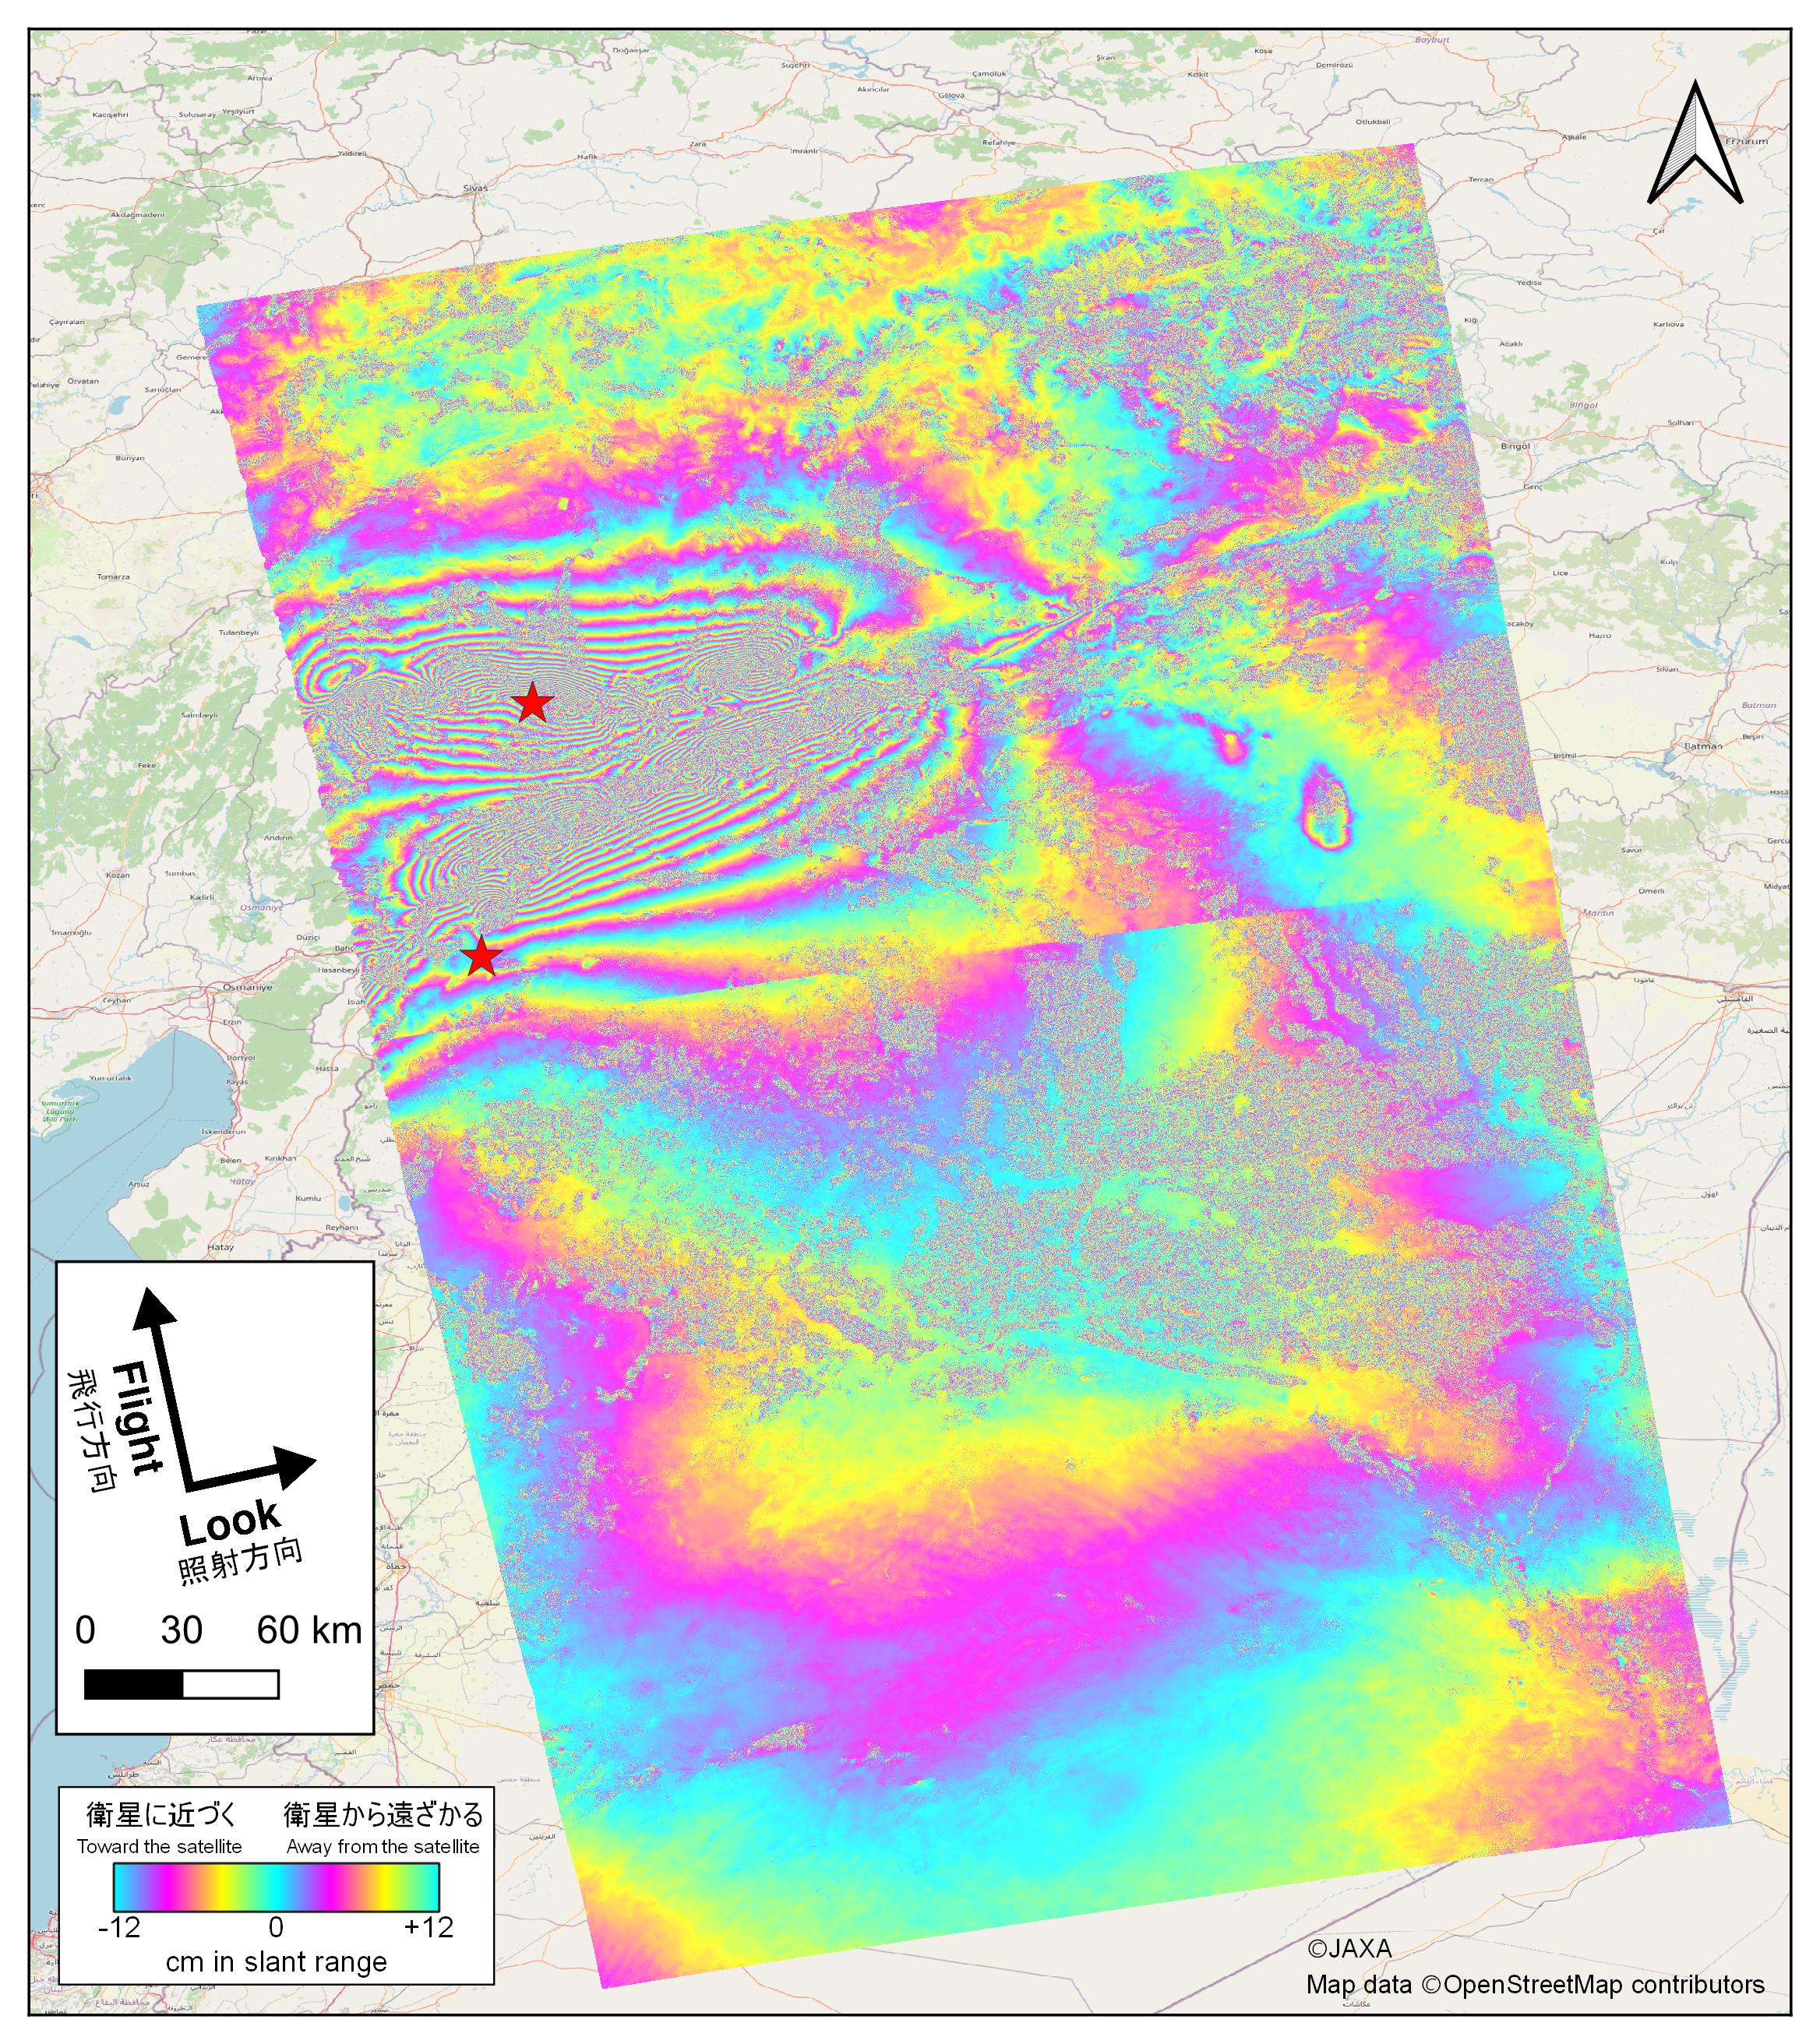
Figure 2 shows a differential interferometric image using observation data of April 6, 2022 (before the earthquake) and February 8, 2023 (after the earthquake). In this observation, microwave was emitted from approximately eastern side to western direction. The blue to pink to yellow change in the image indicates that the ground surface has moved away from the satellite (westward or subsiding), while the blue to yellow to pink change indicates that the ground surface has moved closer to the satellite (eastward or uplifting). Based on the result, we detected extremely large crustal deformation near the two epicenter areas (red stars, according to USGS*1) where the earthquake occurred, as well as local crustal deformation caused by afterquakes. However, the entire image contains noise with long wavelengths due to ionospheric delays, etc., thus further analysis is required to detect quantitative variation.

Figure 3 shows the results of the same observation data processed by the “Difference of Split-band Interferograms” (DSI) method. This method can detect larger deformations (several meters in scale) than the differential interferograms shown in Figure 2. Across a fault crossing from east to west near the magnitude 7.5 northern epicenter, displacements of up to approx. 2.0 m away from the satellite on the northern side and up to approx. 2.5 m closer to the satellite on the southern side were detected.

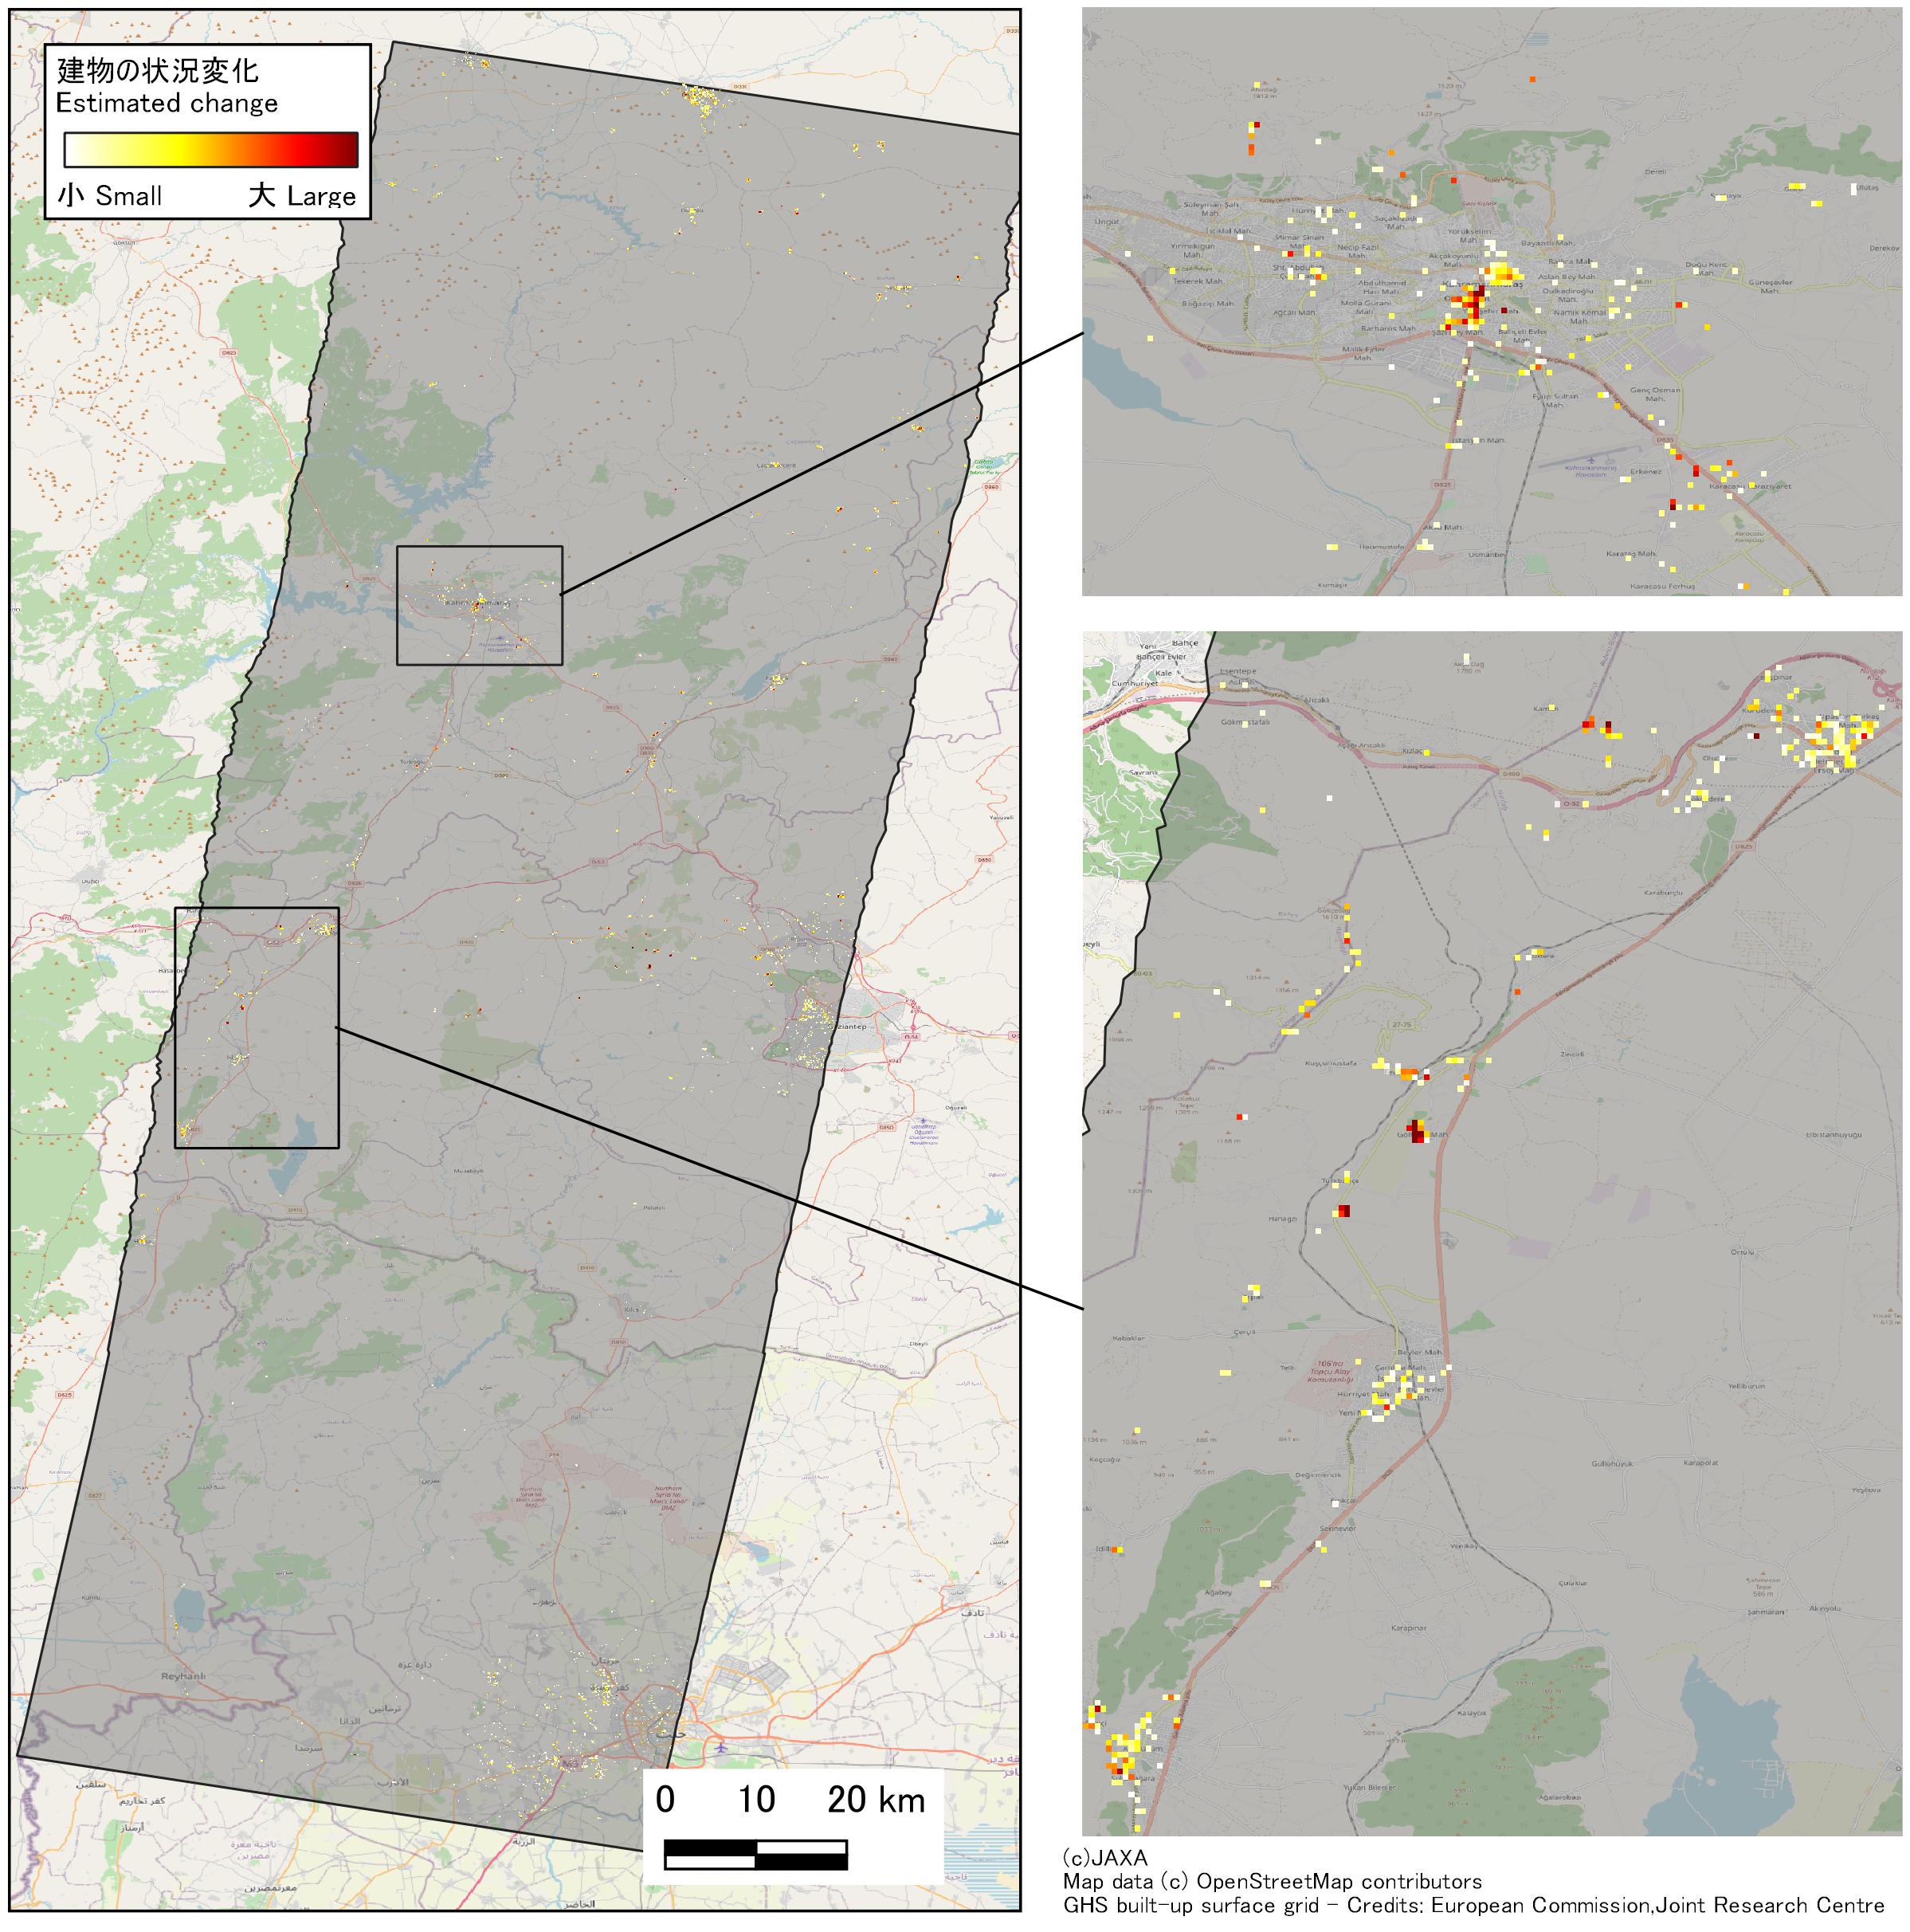
Figure 4 shows the automatic estimation of building changes using observation data from February 8, 2023 (after the earthquake) and April 6, 2022 and April 7, 2021 (before the earthquake). Dark red area indicates that the condition of the building has changed significantly, and the area includes the damage to the building caused by the earthquake. It should be noted, however, that the data may include land use changes unrelated to the earthquake that occurred between the pre-earthquake observations (approximately one year ago) and the present, as well as changes in the ground surface due to snow accumulation.
2) Observation result on February 12 (Updated on February 15)
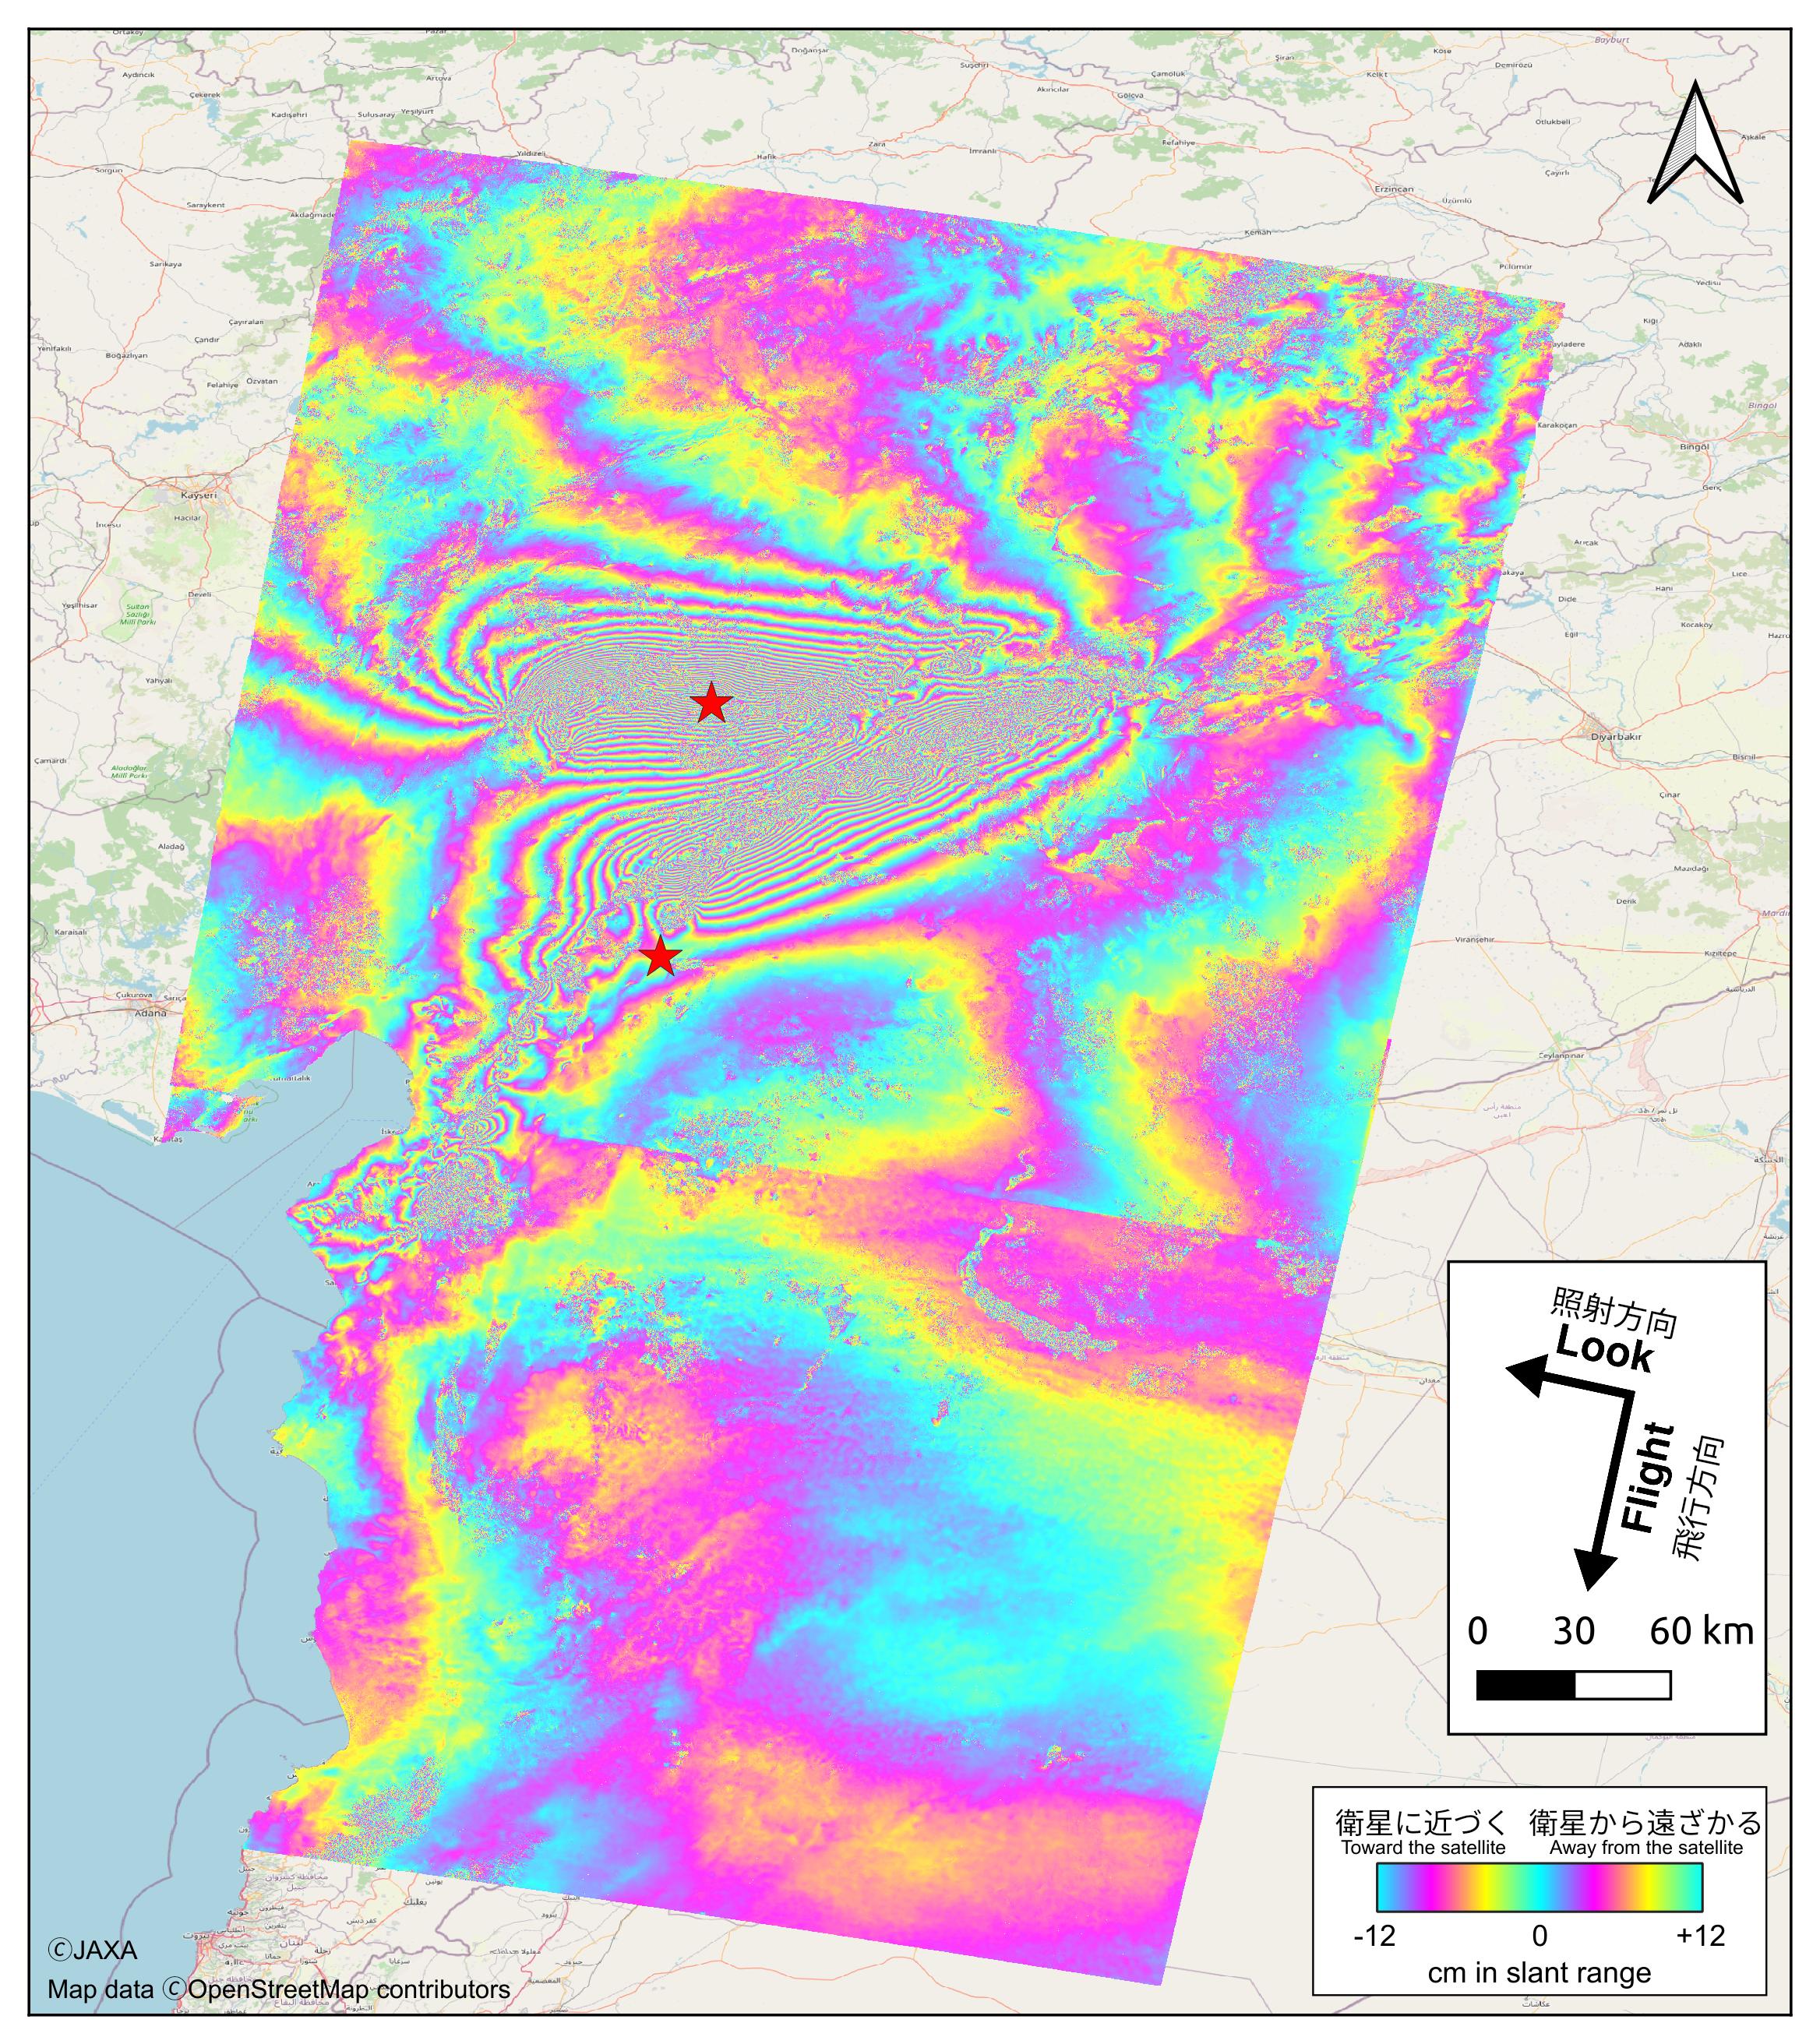
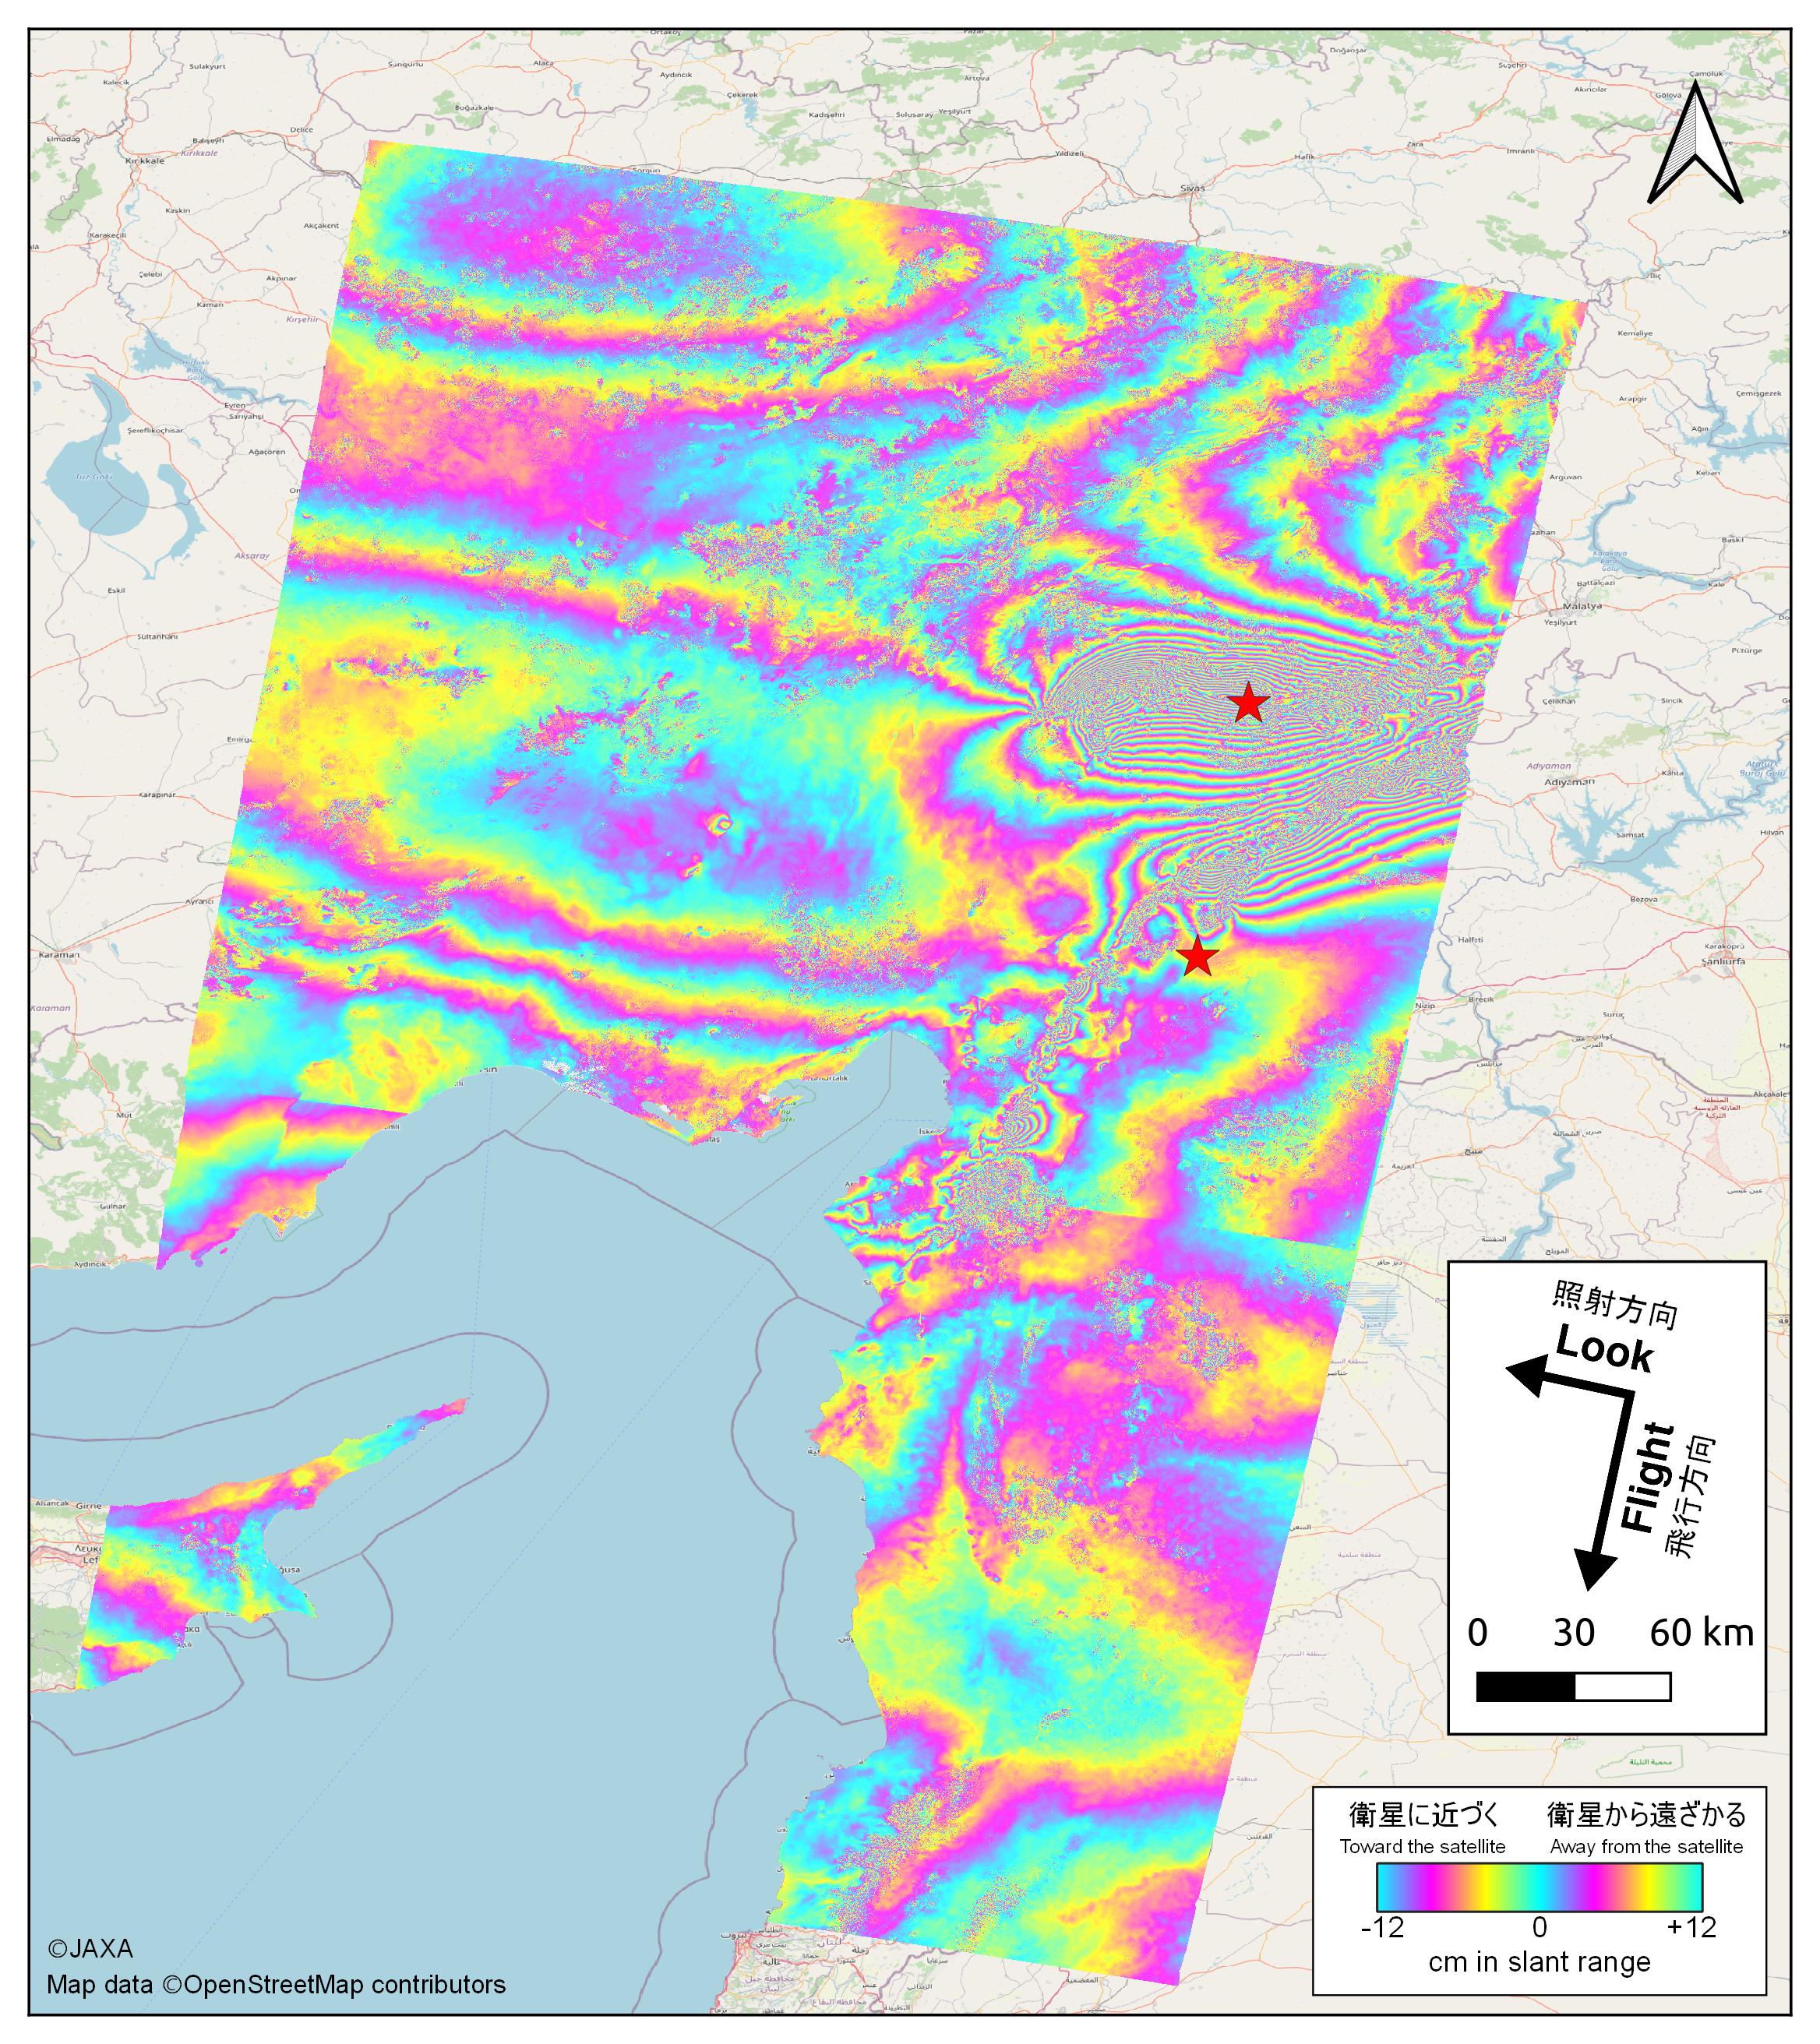
Figures 5 and 6 show differential interferograms using data acquired by ScanSAR observation modes on September 11, 2022 (before the earthquake) and February 12, 2023 (after the earthquake). The observation in Figure 5 was made by flying from south to north, emitting microwave from the western side to the eastern direction. On the other hand, the observation in Figure 6 was made by flying from north to south, emitting microwave from the eastern side to the western direction. Near the two epicenters (red stars), crustal deformation has been detected along faults. Especially, around the epicenter on the north side, line-of-sight displacements of approx. 4 m were detected on the north and south sides, bordering the fault. Note that there are systematic phase patterns (uniform horizontal and vertical fringes) different from those of crustal deformation. Further analysis is required to detect quantitative variation.

3) Observation result on February 16 (Updated on February 22)
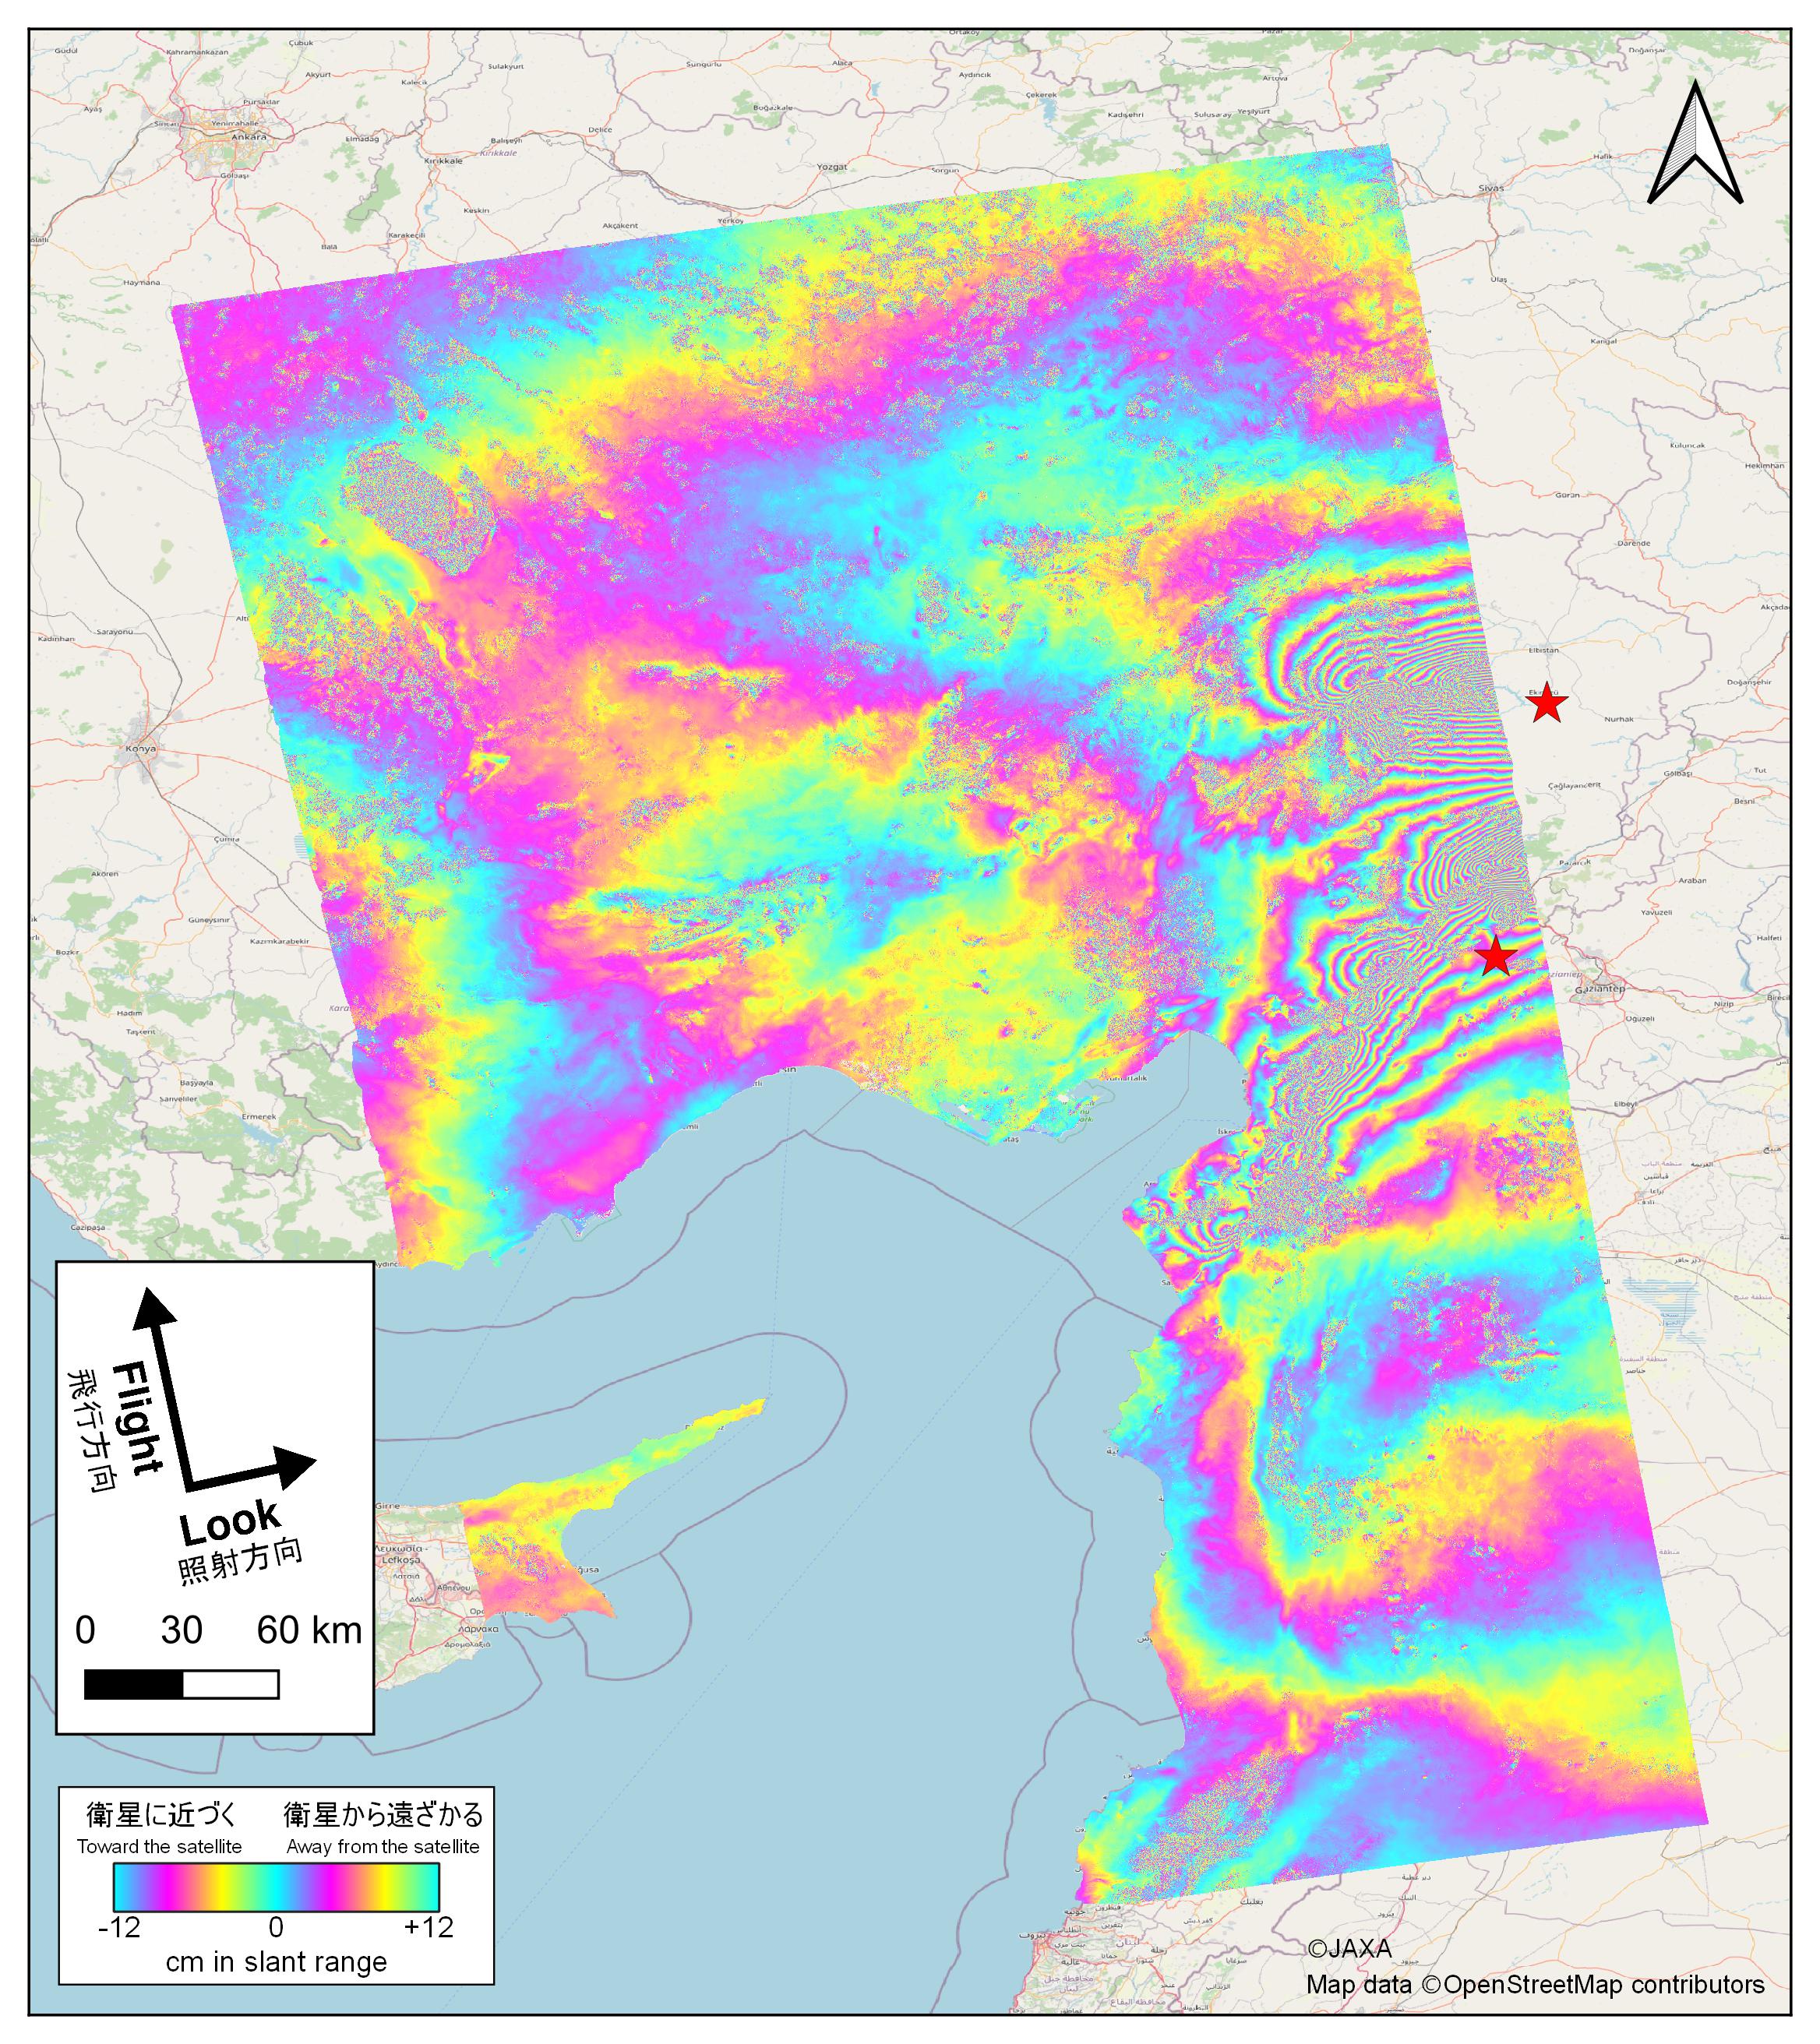
Figure 7 shows a differential interferogram using data acquired by ScanSAR observation modes on September 19, 2019 (before the earthquake) and February 16, 2023 (after the earthquake). The observation in Figure 7 was made by flying from south to north, emitting microwave from the western side to the eastern direction. This image was captured exactly midway between Figures 5 and 6, and covers a wide area near and around the two epicenters. Same as the observation result on February 12, around the epicenter on the north side, line-of-sight displacements of approx. 4 m were detected on the north and south sides, bordering the fault. Note that Figure 7 also shows systematic phase patterns different from those of crustal deformation. Therefore, further analysis is required to detect quantitative variation.
4) Observation result on February 17 (Updated on March 2)
Figure 8 shows a differential interferogram using data acquired by ScanSAR observation modes on September 16, 2022 (before the earthquake) and February 17, 2023 (after the earthquake). The observation in Figure 8 was made by flying from south to north, emitting microwave from the western side to the eastern direction.
5) Observation result on February 21 (Updated on March 2)
Figure 9 shows a differential interferogram using data acquired by ScanSAR observation modes on September 6, 2022 (before the earthquake) and February 21, 2023 (after the earthquake). The observation in Figure 9 was made by flying from south to north, emitting microwave from the western side to the eastern direction. In Figures 8 and 9, line-of-sight displacements of approx. 4 m were detected around the fault similar to previous analyses. Also, since the direction of displacement is opposite in ascending and descending orbits, we can see that horizontal crustal deformation is predominant.

6) Observation result on February 22 (Updated on March 2)
Figure 10 shows a differential interferogram using data acquired by ScanSAR observation modes on September 7, 2022 (before the earthquake) and February 22, 2023 (after the earthquake). The observation in Figure 10 was made by flying from south to north, emitting microwave from the western side to the eastern direction. Just as in previous observations, significant crustal deformation can be seen around the fault. Note that there are systematic phase patterns different from those of crustal deformation. Further analysis is required to detect quantitative variation.
*1 U.S. Geological Survey (USGS) Website:
https://earthquake.usgs.gov/earthquakes/eventpage/us6000jllz/executive
https://earthquake.usgs.gov/earthquakes/eventpage/us6000jlqa/executive
Analysis examples by related organizations
ALOS-2 observation data are promptly provided to relevant organizations and the analysis result performed in each organization are open to the public. In case of a large-scale disaster like this time, coordination and cooperation to relevant organizations will be extremely important, both domestically and internationally. Comparing analysis results from other satellite data or results from different institutions can also improve the reliability of the analysis results. The following are examples of public sites.
- Geospatial Information Authority of Japan
https://www.gsi.go.jp/cais/topic20230206-e_Turkey.html
- The California Institute of Technology/NASA JPL
https://earthobservatory.nasa.gov/images/150949/earthquake-damage-in-turkiye
https://aria-share.jpl.nasa.gov/20230206_Turkey_EQ/Displacements/ALOS2/
https://aria-share.jpl.nasa.gov/20230206_Turkey_EQ/DPM/
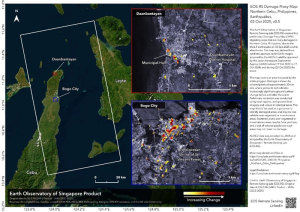
- The Earth Observatory of Singapore (EOS), Nanyang Technological University
https://eos-rs-products.earthobservatory.sg/EOS-RS_202302_Turkiye_Syria_Earthquake/
JAXA will continue to observe this region.
Search by Year
Search by Categories


Tags
-
#Earthquake
-
#Land
-
#Satellite Data
-
#Aerosol
-
#Public Health
-
#GCOM-C
-
#Sea
-
#Atmosphere
-
#Ice
-
#Today's Earth
-
#Flood
-
#Water Cycle
-
#AW3D
-
#G-Portal
-
#EarthCARE
-
#Volcano
-
#Agriculture
-
#Himawari
-
#GHG
-
#GPM
-
#GOSAT
-
#Simulation
-
#GCOM-W
-
#Drought
-
#Fire
-
#Forest
-
#Cooperation
-
#Precipitation
-
#Typhoon
-
#DPR
-
#NEXRA
-
#ALOS
-
#GSMaP
-
#Climate Change
-
#Carbon Cycle
-
#API
-
#Humanities Sociology
-
#AMSR
-
#Land Use Land Cover
-
#Environmental issues
-
#Quick Report
-
#GOSAT-GW
Related Resources


Related Tags
Disaster Related Articles
-
 Disaster 2025.10.23 Thu ALOS-2 Observations of the Earthquakes in the Philippines
(Cebu Island and Mindanao Island) -
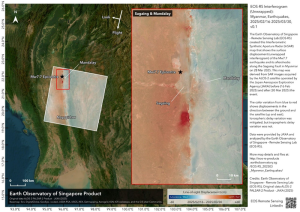 Disaster 2025.04.04 Fri ALOS-2 Observation of the M7.7 Earthquake in Myanmar
 -
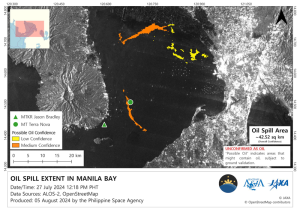 Disaster 2024.09.09 Mon ALOS-2 Observation of the Oil Spill Caused by the Sinking of a Tanker in Manila Bay, Philippines
 -
 Disaster 2023.04.07 Fri ALOS-2 observation: Oil spill from sunken oil tanker off Mindoro Island, Philippines (follow-up report)
Stay Connected
