


Disaster
2022.01.26 Wed
Analysis result of plumes and aerosols from the Tonga volcanic eruption by satellite observations
On January 15, 2022, remarkable plumes and aerosols were generated during the eruption of Hunga-Tonga-Hunga-Ha’apai volcano, a volcanic island in the Kingdom of Tonga. This article reports on the scientific findings about plumes and aerosols captured by the Second generation GLobal Imager (SGLI) onboard the Global Change Observation Mission – Climate “SHIKISAI” (GCOM-C) and the microwave radiometers.
Plumes (aerosols) captured by SGLI
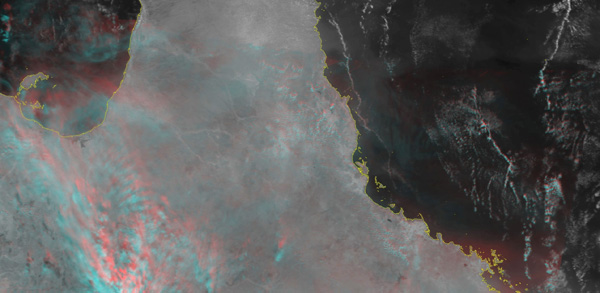
The Second generation GLobal Imager (SGLI) onboard GCOM-C is a sensor capable of 19 channel observation at wavelengths from near-UV to thermal infrared wavelengths with spatial resolutions of 250 m to 1 km. As for the aerosols emitted along with the Tonga volcanic eruption, JAXA succeeded in tracking their movement in upper layer from the Pacific Ocean to the Indian Ocean by using the shortwave infrared channel. Also, by using the function of SGLI to observe oblique directions, the altitude (height above sea level) of the aerosols could be estimated.
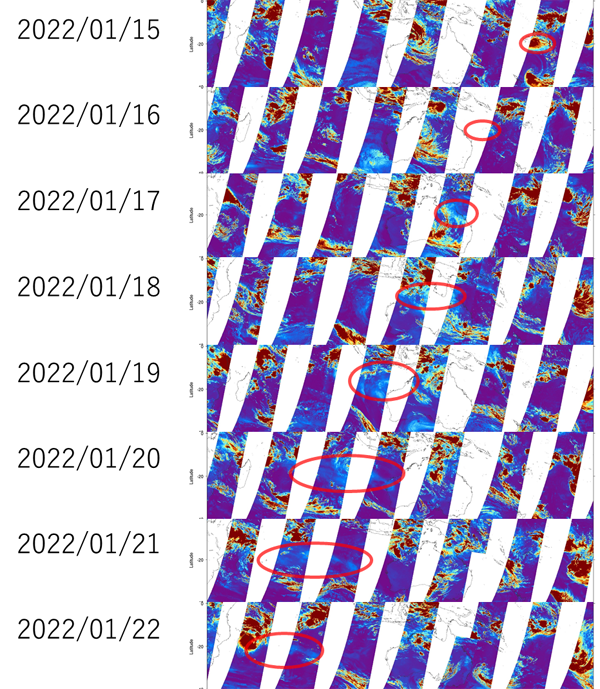
Figure 1-1 shows images from January 15 to 22, 2022, observed by 1.38 µm wavelength channel of SGLI. Since the 1.38 µm channel locates within a strong water vapor absorption band, light from the ground surface and the lower layer of the atmosphere cannot be seen due to the absorption by water vapor in the atmosphere. Conversely, by utilizing this characteristic, it is possible to selectively capture scattered light from clouds and aerosols in the upper atmosphere. The images indicate that the aerosols moved from the area around Tonga on January 15, the day of the eruption, and spread to the westward.
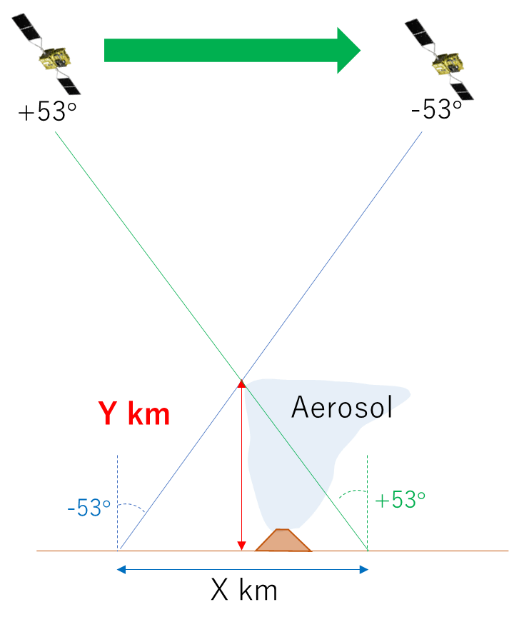
SGLI has a function that turns the telescope along orbital direction (approximately +/- 53 degrees from the zenith direction on the Earth’s surface). By using the parallax of the observation target based on the slant view angles just like a stereoscopic view, it is possible to estimate the approximate altitude of the targets (Figure 1-2).

Regarding January 15, 17, and 20 in figure 1-1, we examined how much the aerosol distribution pattern looks different depending on the observation angle in the range of SGLI’s multidirectional observations, and converted it to altitude (Figs. 1-3, 1-4 and 1-5).
As a result, it was estimated that the aerosol altitude was about 28 km in both figures 1-4 and 1-5. On the other hand, the altitude of clouds was about 15 km or less, which corresponds to the top altitude of the troposphere, suggesting that aerosols are distributed in the stratosphere above the troposphere.
It was said that the volume of aerosols associated with this eruption was not so large, however, aerosols in the high altitude can remain for a long time. So, we will carefully continue to monitor the distribution and the volume of aerosols by GCOM-C.
Volcanic ash clouds captured by microwave radiometers
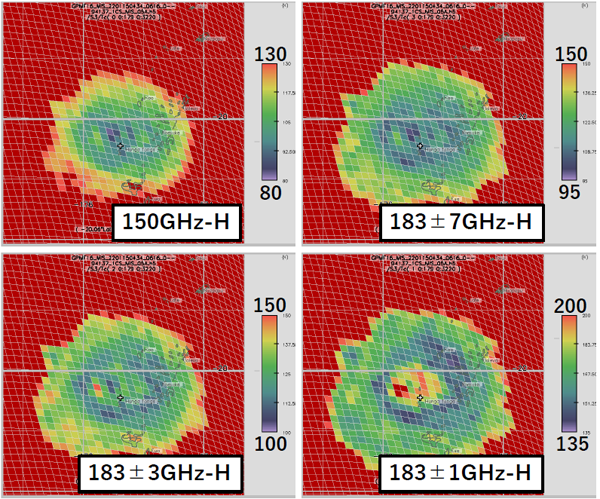
The Global Satellite Mapping of Precipitation (GSMaP) is created by combining observation data of about 10 microwave radiometers around the world. One of the microwave radiometers, the Special Sensor Microwave – Imager/Sounder (SSMIS) onboard the US satellite, the Defense Meteorological Satellite Program – F16 (DMSP-F16), passed over the volcano around 04:52 on January 15, 2022 (UTC), about 40 minutes after the eruption and captured the feature of volcanic ash clouds from the Hunga-Tonga-Hunga-Ha’apai volcano. SSMIS has some high frequency channels from 150 to 183GHz and has a function to vertically observe in the atmosphere. Specifically, 150GHz channel is sensitive to the middle troposphere and other channels in the order of 150GHz, 183±7GHz, 183±3GHz and 183±1GHz are more sensitive to higher altitudes.
Figure 2-1 shows the SSMIS brightness temperature distribution (basic observable with a microwave radiometer). We can see that the brightness temperatures at the center of volcano are lower (yellow to blue) than the surrounding area due to microwaves scattered by volcanic ash cloud particles. In the image of 150 GHz (upper left), which is sensitive to the middle troposphere, the brightness temperatures near the volcano (blue) are the lowest, and the temperatures rise as the points are far from the volcano. On the other hand, in the image of 183GHz±1GHz (lower right), which is sensitive to the upper troposphere, the brightness temperatures near the center of the volcano are high and the temperatures are low at points a little farther away from the volcano (blue). U.S. analysis shows lightning distribution spreading in concentric circles associated with volcanic ash clouds. This could suggest that the brightness temperature distribution of 183GHz±1GHz (lower right) captures the feature of volcanic ash cloud particles accompanied by lightning at high altitudes. There are examples such as the volcano in Iceland for the volcanic ash cloud analysis with the microwave radiometer. This analysis is a potential field in the future.
The Global Observing SATellite for Greenhouse gases and Water cycle (GOSAT-GW) carrying the Advanced Microwave Scanning Radiometer 3 (AMSR3) is scheduled to be launched in JFY2023. After the launch, its high frequency channels similar to this SSMIS will become available. Since the horizontal resolution of AMSR3 is high, we look forward to obtaining more detailed information when observing volcanic ash clouds.
Search by Year
Search by Categories


Tags
-
#Earthquake
-
#Land
-
#Satellite Data
-
#Aerosol
-
#Public Health
-
#GCOM-C
-
#Sea
-
#Atmosphere
-
#Ice
-
#Today's Earth
-
#Flood
-
#Water Cycle
-
#AW3D
-
#G-Portal
-
#EarthCARE
-
#Volcano
-
#Agriculture
-
#Himawari
-
#GHG
-
#GPM
-
#GOSAT
-
#Simulation
-
#GCOM-W
-
#Drought
-
#Fire
-
#Forest
-
#Cooperation
-
#Precipitation
-
#Typhoon
-
#DPR
-
#NEXRA
-
#ALOS
-
#GSMaP
-
#Climate Change
-
#Carbon Cycle
-
#API
-
#Humanities Sociology
-
#AMSR
-
#Land Use Land Cover
-
#Environmental issues
-
#Quick Report
-
#GOSAT-GW
Related Resources


Disaster Related Articles
-
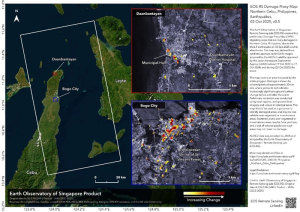 Disaster 2025.10.23 Thu ALOS-2 Observations of the Earthquakes in the Philippines
(Cebu Island and Mindanao Island) -
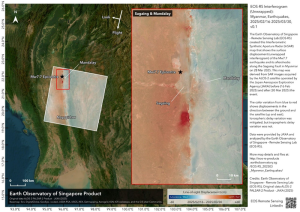 Disaster 2025.04.04 Fri ALOS-2 Observation of the M7.7 Earthquake in Myanmar
 -
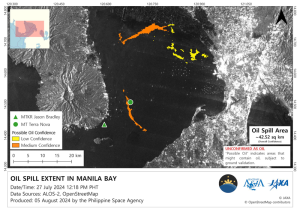 Disaster 2024.09.09 Mon ALOS-2 Observation of the Oil Spill Caused by the Sinking of a Tanker in Manila Bay, Philippines
 -
 Disaster 2023.04.07 Fri ALOS-2 observation: Oil spill from sunken oil tanker off Mindoro Island, Philippines (follow-up report)
Stay Connected
