


Disaster
2021.09.28 Tue
The floods caused by heavy rainfall in Germany and Belgium -increase of heavy rainfall under climate change-
In July 2021, intermittent heavy rainfall occurred elsewhere across Europe, causing flooding and enormous damage particularly in Germany and Belgium. We wish to extend our deepest sympathy to all those who have suffered hardship from the disasters.
From the perspective of providing information on precipitation condition, JAXA/EORC conducted the analysis using data from the Global Precipitation Measurement (GPM) core observatory, the Global Satellite Mapping of Precipitation (GSMaP), etc., which observe condition of rain from space. This article reports on the analysis result. Also, as a background of frequent extreme heavy rainfall disasters, we introduce the view about increase of frequency and intensity of heavy precipitation described in the Sixth Assessment Report (AR6) of the Intergovernmental Panel on Climate Change (IPCC) released in August 2021.
The state of heavy rainfalls in July around Europe
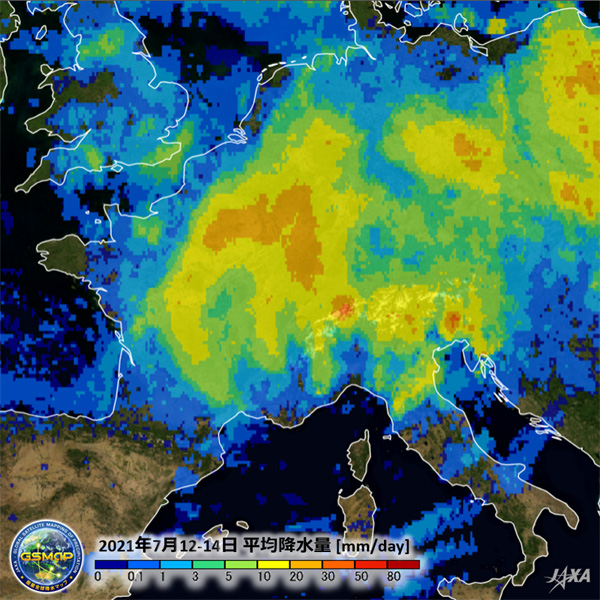
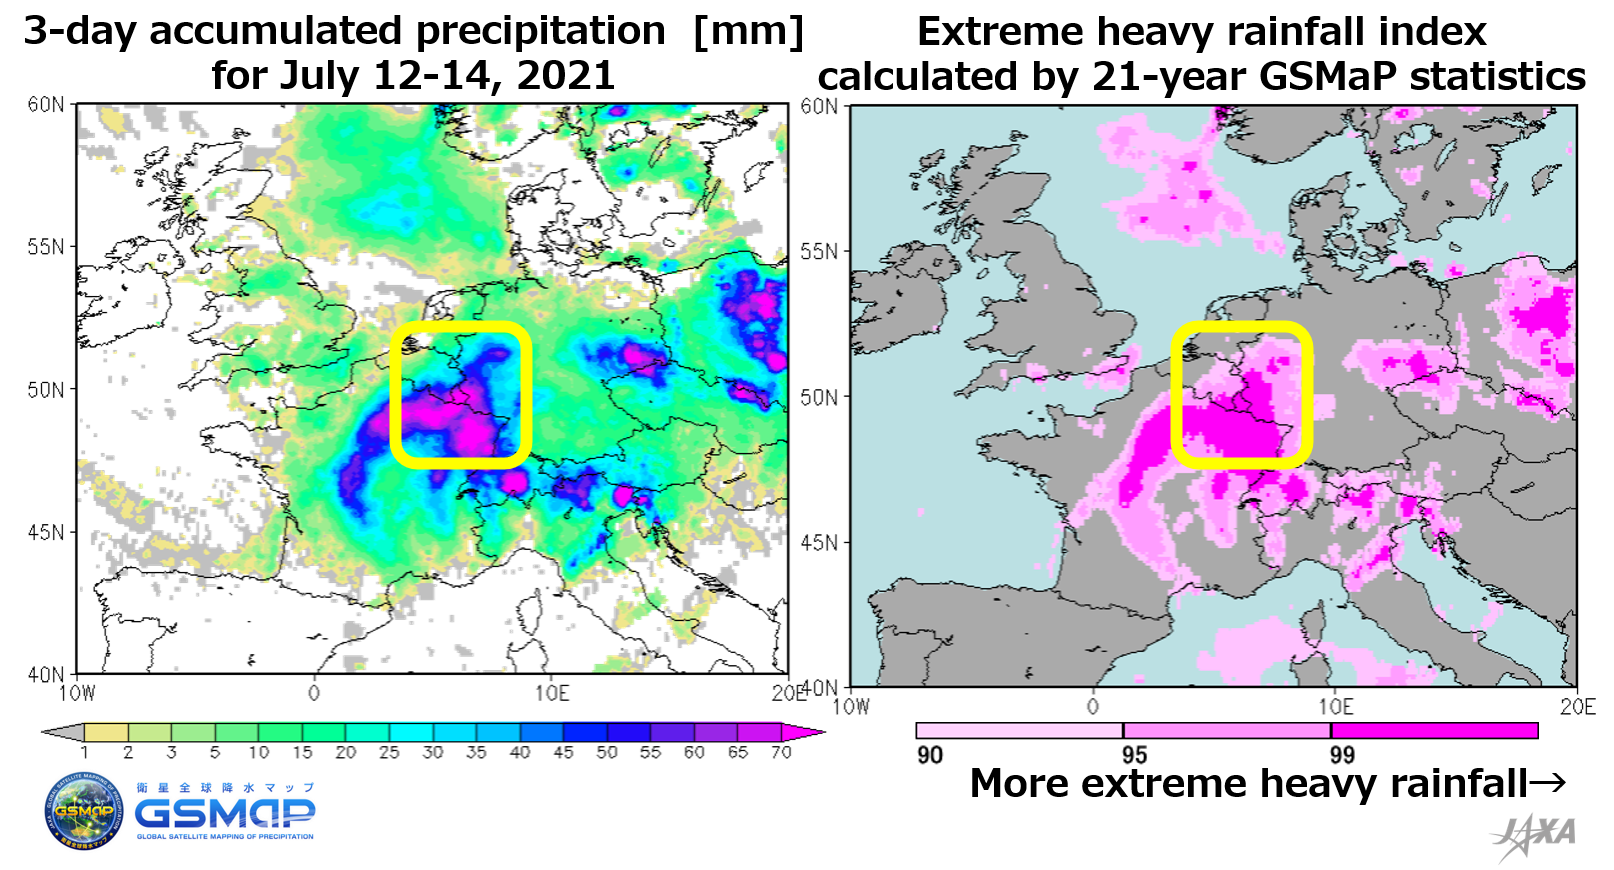
Figure 1 shows the distribution of mean precipitation (Fig.1 left) during the period of July 12-14, 2021 UTC(hereafter all times are UTC) by GSMaP obtained from satellite observations and extreme heavy rainfall index (Fig.1 right) during the same period calculated from GSMaP statistics in the past 21 years.
From the precipitation information by GSMaP shown in Fig. 1 (left), heavy rainfall can be seen in the areas around western Germany etc. where damage caused by floods has been reported. It shows that the area had continuous heavy rainfall with over 75 mm for three days. GSMaP statistics in the areas for past 21 years shows that total amount of precipitation in July is approximately 60-80 mm. This means that almost same amount of rain in one month (31 days) in normal year fell in just three days.
Fig. 1 (right) shows the areas with precipitation intensity equal to or greater than the top several percent of the mean precipitation using extreme heavy rainfall index during the period of July 12-14 in the past 21 years. Dark pink area indicates how extreme the rainfall was during the period of July 12-14, 2021 comparing with the mean precipitation of July 12-14 in the past 21 years. We can find the tendency that western Germany and Belgium had continuous rainfall.
In addition, JAXA conducts accurate three-dimensional observations of rain in the world by using Dual-frequency Precipitation Radar (DPR) onboard GPM core observatory. Figure 2 shows three-dimensional conformation of precipitation when DPR observed precipitation band in central Europe. The precipitation top height is generally known to be higher in the tropics where convective rain clouds develop. Central Europe locates at mid-latitude band around 50th parallel north and the average precipitation top height in this area of northern summer (June-August)is about 4 km. In this case, however, development of convective rain clouds up to more than 10 km height was observed in some places.
DPR is the only instrument which can measure rain in three dimensions with high accuracy from space. By three-dimensional observation of precipitation, we can promote better understanding of characteristics of rainfall and contribute to the improvement of weather forecasting models to estimate rainfall. The observation data of DPR has operationally utilized for numerical weather prediction of Japan Meteorological Agency since March 2016 and the data plays a useful role in daily weather forecast.
Increase of heavy rainfall due to global warming
In recent years, this kind of heavy rainfall disasters frequently happened all over the world. As a background, we introduce the view about increase of heavy rainfall represented in the IPCC Sixth Assessment Report (AR6), which was released in August 2021.
According to the main assessment of the Summary for Policymakers(SPM)in IPCC AR6, the changes in precipitation confirmed so far are described as follows;
- “Globally averaged precipitation over land has likely increased since 1950, with a faster rate of increase since the 1980s (medium confidence).”
- “The frequency and intensity of heavy precipitation events have increased since the 1950s over most land area for which observational data are sufficient for trend analysis (high confidence), and human-induced climate change is likely the main driver.”
In summary, not only total amount of average precipitation has increased, but also frequency and intensity of extreme heavy precipitation have increased.
As introduced in another article posted in this August, regarding precipitation of rainy baiu front including the areas around Japan in the last 10 years, latest research results using precipitation observation data with DPR and GSMaP show that precipitation activity in rainy front in recent 11 years (2009-2019) has been more active than in the previous 11 years (1998-2008). In order to track the change in rainfall characteristics accurately, continuous monitoring by rainfall observing satellites is important.
With the need to review disaster prevention and evacuation measures in the society coexisting with COVID-19, JAXA will contribute to disaster-prevention activities such as early evacuation before disaster by accuracy improvement of disaster prediction and understanding the situation after disaster through multiple analysis combining observation information by DPR, GSMaP, etc. and numerical simulations.
Reference
Related Sites
Search by Year
Search by Categories


Tags
-
#Earthquake
-
#Land
-
#Satellite Data
-
#Aerosol
-
#Public Health
-
#GCOM-C
-
#Sea
-
#Atmosphere
-
#Ice
-
#Today's Earth
-
#Flood
-
#Water Cycle
-
#AW3D
-
#G-Portal
-
#EarthCARE
-
#Volcano
-
#Agriculture
-
#Himawari
-
#GHG
-
#GPM
-
#GOSAT
-
#Simulation
-
#GCOM-W
-
#Drought
-
#Fire
-
#Forest
-
#Cooperation
-
#Precipitation
-
#Typhoon
-
#DPR
-
#NEXRA
-
#ALOS
-
#GSMaP
-
#Climate Change
-
#Carbon Cycle
-
#API
-
#Humanities Sociology
-
#AMSR
-
#Land Use Land Cover
-
#Environmental issues
-
#Quick Report
-
#GOSAT-GW
Related Resources


Related Tags
Disaster Related Articles
-
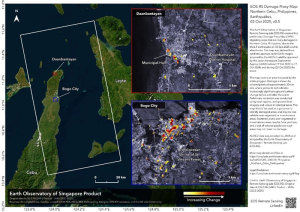 Disaster 2025.10.23 Thu ALOS-2 Observations of the Earthquakes in the Philippines
(Cebu Island and Mindanao Island) -
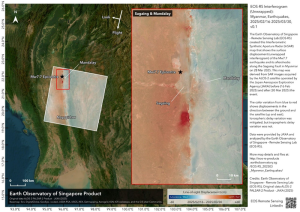 Disaster 2025.04.04 Fri ALOS-2 Observation of the M7.7 Earthquake in Myanmar
 -
 Disaster 2024.09.09 Mon ALOS-2 Observation of the Oil Spill Caused by the Sinking of a Tanker in Manila Bay, Philippines
 -
 Disaster 2023.04.07 Fri ALOS-2 observation: Oil spill from sunken oil tanker off Mindoro Island, Philippines (follow-up report)
Stay Connected
