What is “Today’s Earth – Japan (TE-Japan)”?
The heavy rainfall caused extensive damage, for example, a mudflow occurred in Atami city, Shizuoka Prefecture in the morning on July 3. As one of the main factors that cause this sort of landslide disasters, it is estimated that plenty of moisture has been stored in the soil before disaster.
JAXA has developed and operated the land surface simulation system, “Today’s Earth – Japan (TE-Japan)” jointly with University of Tokyo in order to understand accurate water circulation on land. TE-Japan makes it possible to estimate where and to what extent water caused by rainfall is collected and anyone can view the current state of many physical quantities related with water on land, such as river flow, evapotranspiration from the ground and soil moisture content through the webpage.
Also, when putting weather forecast data from the Japan Meteorological Agency (JMA) into the system, it is operationally available to conduct predictive simulation for up to about 30-hours*1. Regarding the prediction accuracy, JAXA has evaluated with a focus on remarkable disaster cases. We confirmed high prediction accuracy in the case of Typhoon Hagibis in 2019 which caused damage on a broad scale mainly in the Kanto region, and published a press release jointly with the University of Tokyo.
Changes in soil moisture with heavy rainfall in early July estimated by TE-Japan
TE-Japan calculates soil moisture content all over Japan every hour with around 1km spatial resolution and it is possible to estimate the content for each layer in soil (six layers in total) as shown in the left side of Fig. 1. By using this data, JAXA analyzed the condition of soil moisture content in the areas before the disaster happened.
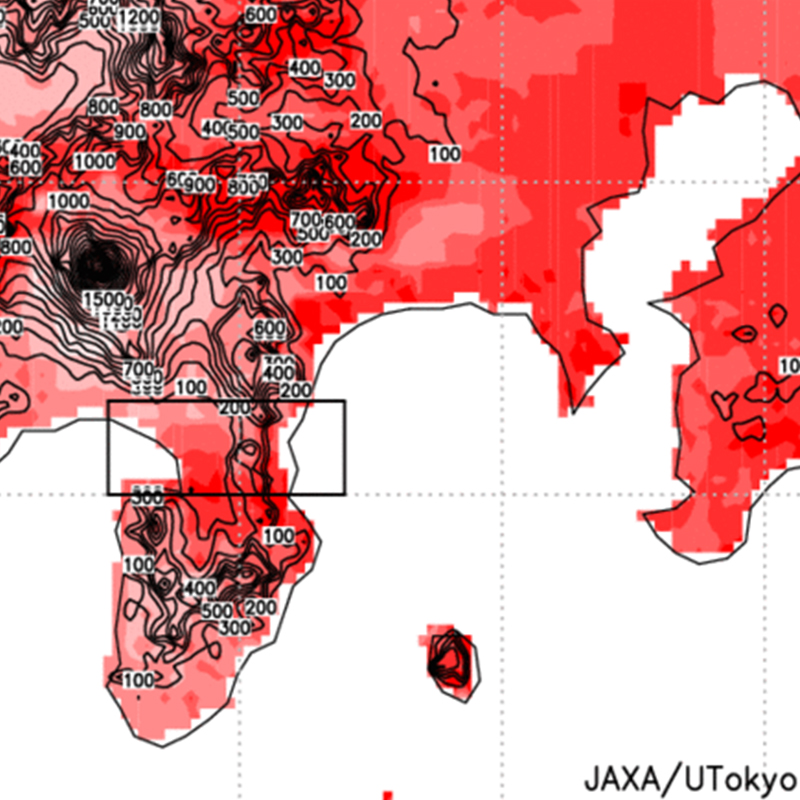
Figure 1 (right) shows anomaly*2 from normal value*3 of soil moisture content all over Japan estimated by TE-Japan from June 28 to July 3, 2021. As of the beginning of July, we can find that the soil condition on the Pacific side was quite moist compared with normal year due to the prolonged rain.
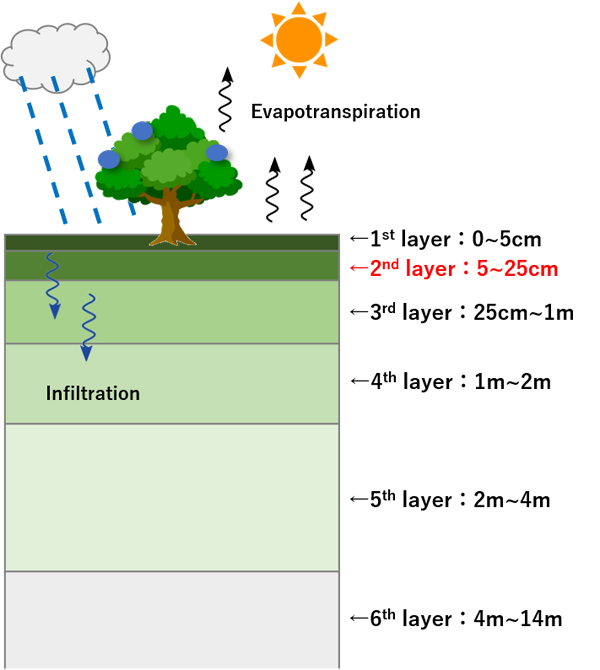
Figure 1. (left) Conceptual diagram of water balance on land and the depth of each soil layer in TE-Japan system
(right) Soil moisture anomaly in the second layer estimated by TE-Japan (June 28–July 3 UTC)
Figure 2 is an enlarged image of Fig. 1 to take a closer look for Shizuoka and Kanagawa area where rainfall was particularly heavy in Fig. 1. Although positive anomaly (higher soil moisture content than normal year) is estimated over the whole area of the figure, it assumed that the risk of landslide disasters is high especially in the area with positive large anomaly and large slope (contour lines are close in the figure).
Figure 2. An enlarged image of Fig. 1, mainly focusing on Izu Peninsula in Shizuoka Prefecture and Kanagawa Prefecture. Contour lines indicate elevation (m), 0-3000m at 100m intervals.
Figure 3 shows a time series of anomaly of soil moisture anomaly in the area framed in black (including Atami City where mudflow occurred and Numazu City where bridge collapse occurred) in Fig. 2. Each line shows the forecast results from each initial time for the next 39 hours, which is conducted every three hours. Looking at this data, soil moisture levels have been extremely high compared to normal year since July 1, indicating that there was a possibility of an increased risk of landslide disaster in the area. Especially, since each prediction line shows almost the same value around July 2, we can see that all of the predictions estimated above-normal soil moisture content.
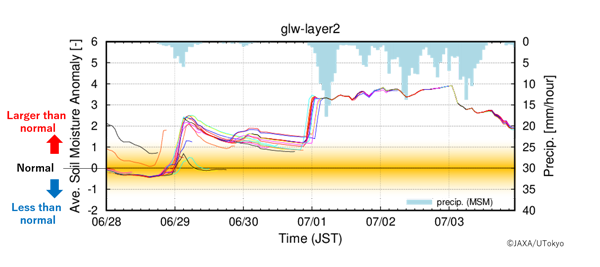
Figure 3. Anomaly of soil moisture content in the second layer averaged over the area framed in black in Fig. 2 (June 28–July 3 JST). Each line shows the forecast results from each initial time for the next 39 hours and the light blue histogram shows the area-averaged rainfall in the black square in Fig. 3 obtained from the JMA MSM/GPV.
With the need to review disaster prevention and evacuation measures in the society coexisting with COVID-19, JAXA will contribute to understanding the existing conditions and accuracy improvement of disaster prediction through multiple analysis combining satellite observations and numerical simulations.
*1: Based on the Japanese Meteorological Service Act, forecast information is limited to joint research institutions.
*2: Values obtained by subtracting the normal value(*3) from the soil moisture content estimated at each time then divided by the variance from 2007 to 2020. If the value is nearly zero, it shows that the soil moisture was estimated as normal (1 to 3; slightly higher than normal year, 3 or more; very high compared to normal year).
*3: Mean value of soil moisture content from 2007 to 2020 estimated by TE-Japan