


Applications
2020.11.30 Mon
Essential Climate Variable (ECV) Inventory for Climate Change Monitoring – The release of ECV Inventory (Ver3) –
1. ECV Inventory for Climate Change Monitoring
As is evident from the Assessment Report (AR) of Intergovernmental Panel on Climate Change (IPCC) and the Paris Agreement adopted by the United Nations Framework Convention on Climate Change (UNFCCC), each country is addressing climate change including global warming as the global policy agenda.
JAXA has developed and operated Earth observation satellites, and above all, elucidating the mechanism of climate change is one of the major roles of these satellites. In order to understand the status of climate change, it is necessary to observe various environmental factors of whole area on a global scale periodically and to detect changes through monitoring. In this context, Earth observation satellites can respond to such observation demands flexibly and effectively. Furthermore, it is expected that the accuracy of climate change monitoring will be improved by combining Earth observation satellites with conventional ground observations and aircraft observations.
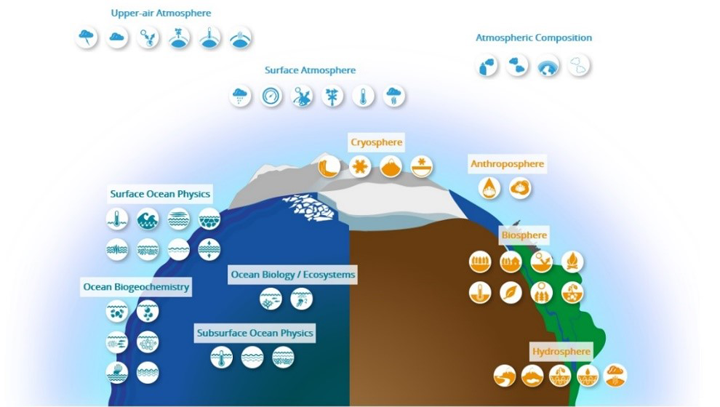
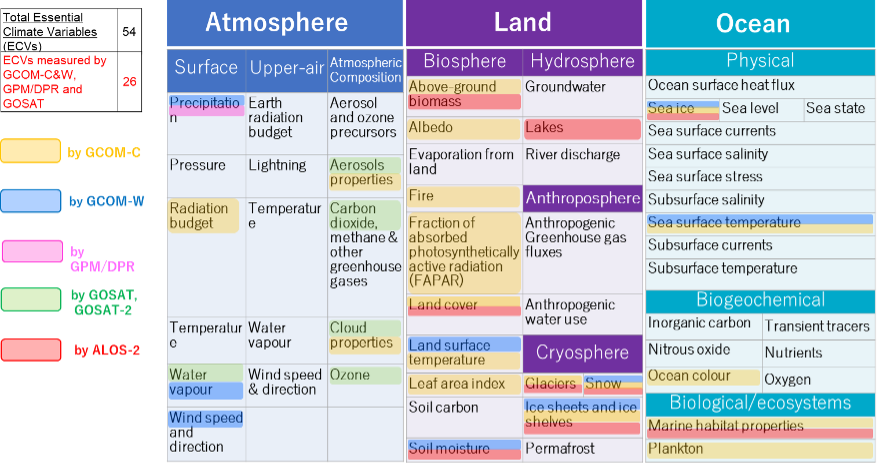
In 2004, Essential Climate Variables (ECVs) were established internationally (*1) by the Global Climate Observing System (GCOS) for the purpose of identifying and predicting specific and accurate changes in the global environment caused by climate change. Also, ECVs based on satellite observation were selected in 2006. ECVs are physical, chemical and biological variables or a combination of these variables which characterize Earth’s climate. At the moment, 54 variables are determined, as shown in Figure 1. The Climate Data Record (CDR) obtained from ECV observations provides the empirical evidence needed 1) to understand and predict climate change, 2) to guide mitigation and adaptation measures to the effects of climate change, 3) to assess risks and identify potential causes of extreme weather events.
https://gcos.wmo.int/en/essential-climate-variables/
2. The release of ECV Inventory (Ver3)
ECV Inventory is a database collected, compiled and updated CDR information produced from satellite observation. It is updated about every two years, and the latest version (Ver.3) was released in August 2020.
https://climatemonitoring.info/ecvinventory
In ECV Inventory (Ver.3), 1,137 CDRs are registered from more than 30 institutions around the world. This includes 766 existing CDRs and 371 planned CDRs (see Table 1).
The largest number of observation target is atmosphere, followed by land and ocean.
| Domain | Number of items | Existing | Planned |
| Atmosphere | 801 | 535 | 266 |
| Land | 203 | 141 | 62 |
| Ocean | 133 | 90 | 43 |
| Total | 1,137 | 766 | 371 |
3. JAXA’s contribution to ECV Inventory
JAXA operates satellites including GCOM-C “SHIKISAI” and GCOM-W “SHIZUKU” in the Global Change Observation Mission (GCOM) project for the purpose of the global, long-term observation of Earth’s environmental changes in atmosphere, ocean, land, snow and ice. These observation data are expected to contribute to ECV. As shown in Figure 2, GCOM-C observation contributes to 18 ECVs in atmosphere, land, and ocean. As a total, JAXA’s Earth observation satellites contribute to 26 ECVs.
At present, JAXA has registered eight CDRs for three ECVs: greenhouse gases, land cover, and sea ice in the inventory. JAXA will add registrations as new products are released (see Table 2). These observation data can be obtained from G-Portal etc. which are data provision sites of JAXA’s Earth observation satellites.
G-Portal:https://gportal.jaxa.jp/gpr/?lang=en
| Domain | ECV | ECV Product | Satellites/Sensors |
| Atmosphere | Carbon Dioxide, Methane, other greenhouse gases |
Tropospheric CO2 column Tropospheric CH4 column |
GOSAT-1/TANSO-FTS, GOSAT-2/TANSO-FTS/2 |
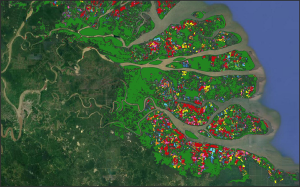
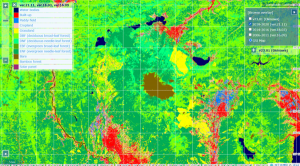
| Land, Ocean | Land cover | Maps of land cover | JERS-1/SAR, ALOS/PALSAR, ALOS-2/PALSAR-2 |
| Sea ice | Sea-ice concentration | Aqua/AMSR-E, GCOM-W/AMSR2, Other foreign microwave radiometers |
For the next version, ECV inventory Ver4, JAXA is planning to resister ECV products in Table 3.
| Domain | ECV | ECV Product | Satellites/Sensors |
| Atmosphere | Aerosol | Aerosol optical depth | GOSAT-2/TANSO-CAI/2, GCOM-C/SGLI |
| Precipitation | Precipitation (liquid and solid) | Aqua/AMSR-E, GCOM-W/AMSR2, TRMM/PR, GPM/DPR |
|
| Water vapour | Total column water vapour | Aqua/AMSR-E, GCOM-W/AMSR2 |
|
| Cloud properties | Cloud amount | GCOM-W/AMSR2 | |
| Wind speed | Sea Surface wind speed | Aqua/AMSR-E, GCOM-W/AMSR2 |
|
| Land | Land-surface temperature | Maps of land-surface temperature | Aqua/AMSR-E, GCOM-W/AMSR2 |
| Land-surface temperature | Maps of land-surface temperature | Aqua/MODIS, Terra/MODIS, GCOM-C/SGLI |
|
| Snow | Area covered by snow·Snow depth | Aqua/AMSR-E, GCOM-W/AMSR2 |
|
| Snow | Area covered by snow | Aqua/MODIS, Terra/MODIS, NOAA/AVHRR, GCOM-C/SGLI |
|
| Soil moisture | Surface soil moisture | Aqua/AMSR-E, GCOM-W/AMSR2 |
|
| Fire | Burnt areas | Aqua/MODIS, Terra/MODIS, GCOM-C/SGLI |
|
| Ocean | Sea-surface temperature | Sea-surface temperature | Aqua/AMSR-E, GCOM-W/AMSR2 |
| Sea-surface temperature | Sea-surface temperature | Aqua/MODIS, Terra/MODIS, GCOM-C/SGLI |
|
| Ocean color | Chlorophyll-a concentration | Aqua/MODIS, Terra/MODIS, GCOM-C/SGLI |
4. Examples of contributions to climate change analysis
(1) Ocean
“Sea ice”, one of the ECVs, is a high-profile indicator of global warming. It is one of the variables that are particularly important to observe from satellites. For example, the IPCC The Fifth Assessment Report (AR5) of the Working Group I published in 2013 describes that according to analysis of observations with satellite microwave radiometers, the annual mean Arctic sea ice extent decreased over the period 1979 to 2012. The rate of decrease was very likely (90%) in the range 3.5 to 4.1% per decade. It is also reported that the Arctic sea ice will continue to shrink both in extent and thickness during the 21st century. There is very high confidence (90%) that the snow cover extent has decreased in the Northern Hemisphere in spring.
Even after 2013, a decreasing trend in Arctic sea ice extent has been observed by satellites. According to JAXA’s analysis, September 2020 marked the second smallest minimum in history (the smallest ever was in September 2012) since 1979, when satellite observations began at full scale.
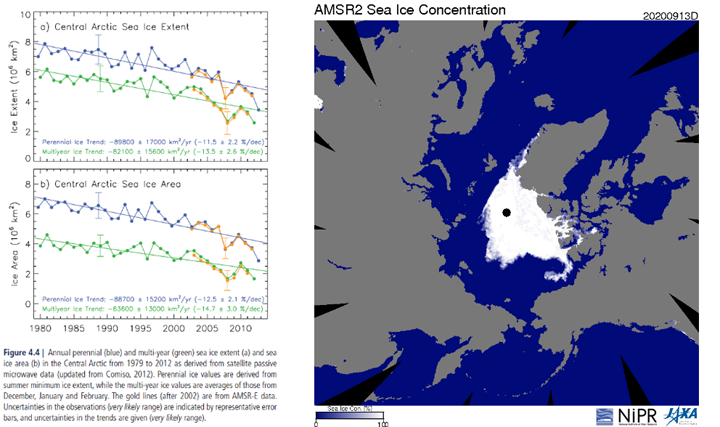
Figure 4 (Right) : Arctic sea ice distribution on September 13, 2020 based on observation data from Global Change Observation Mission – Water “SHIZUKU” (GCOM-W)
(2) Atmosphere
The Greenhouse gases Observing SATellite “IBUKI” (GOSAT) has been observing “carbon dioxide concentration”, one of the ECVs, for more than ten years. It captures increasing trend of CO2 concentration (Figure 5). Thereby, for example, comparing 2019 with 2009, we found that CO2 concentration has increased by 2.4 ppm in the past decade.
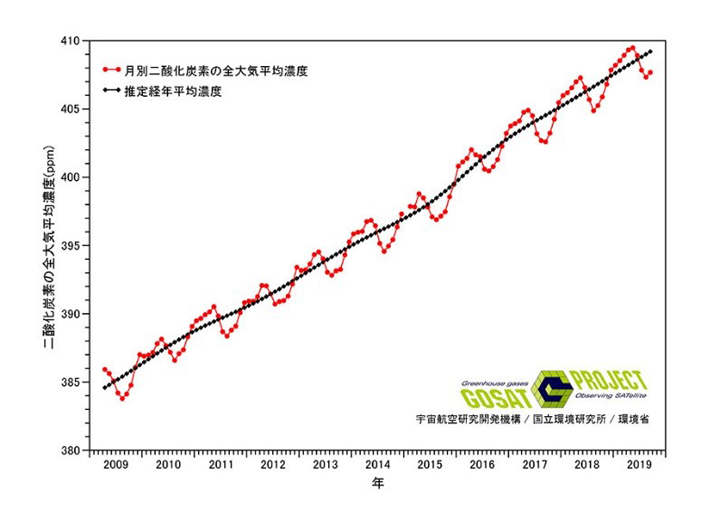
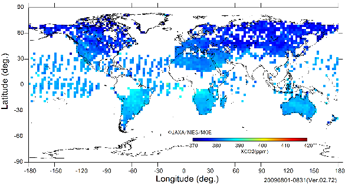
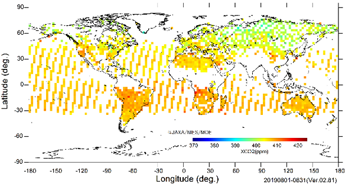
In this way, long-term satellite observation data allow us to understand changes in the global environment associated with climate change including ECVs.
JAXA aims to contribute to elucidation of climate change and policies for a better environment and disaster response through continuous operation of high-quality satellite observations and data provision.
*1 : ECVs were specified by Global Climate Observing System (GCOS) established by WMO and other organizations in 1992.
Search by Year
Search by Categories


Tags
-
#Earthquake
-
#Land
-
#Satellite Data
-
#Aerosol
-
#Public Health
-
#GCOM-C
-
#Sea
-
#Atmosphere
-
#Ice
-
#Today's Earth
-
#Flood
-
#Water Cycle
-
#AW3D
-
#G-Portal
-
#EarthCARE
-
#Volcano
-
#Agriculture
-
#Himawari
-
#GHG
-
#GPM
-
#GOSAT
-
#Simulation
-
#GCOM-W
-
#Drought
-
#Fire
-
#Forest
-
#Cooperation
-
#Precipitation
-
#Typhoon
-
#DPR
-
#NEXRA
-
#ALOS
-
#GSMaP
-
#Climate Change
-
#Carbon Cycle
-
#API
-
#Humanities Sociology
-
#AMSR
-
#Land Use Land Cover
-
#Environmental issues
-
#Quick Report
-
#GOSAT-GW
Related Resources


Related Tags
Applications Related Articles
-
 Applications 2024.01.15 Mon The Use of Earth Observation Satellite Data in the Humanities and Social Sciences (2)
 -
 Applications 2023.11.29 Wed The Use of Earth Observation Satellite Data in the Humanities and Social Sciences (1)
 -
 Applications 2023.08.04 Fri Contribution to SDGs Goal 6 “Clean Water and Sanitation”
 -
 Applications 2023.07.10 Mon Contribution to SDGs Goal 15 “Life on Land”
Stay Connected
