


JAXA has been addressing global precipitation-related issues under the Global Precipitation Measurement (GPM) Mission by utilizing the 3D precipitation product “Dual-frequency Precipitation Radar (DPR)” onboard GPM core observatory and multi-satellite precipitation product “Global Satellite Mapping of Precipitation (GSMaP)“.
In this article, we overview the case analysis for the Typhoon Kammuri which brought serious damages in Philippines in December 2019.
The Manila Observatory issued and updated the reports regarding to the Typhoon Kammuri. GSMaP data were utilized as a source of information to capture the status of the typhoon activities.

Disaster
2019.12.05 Thu
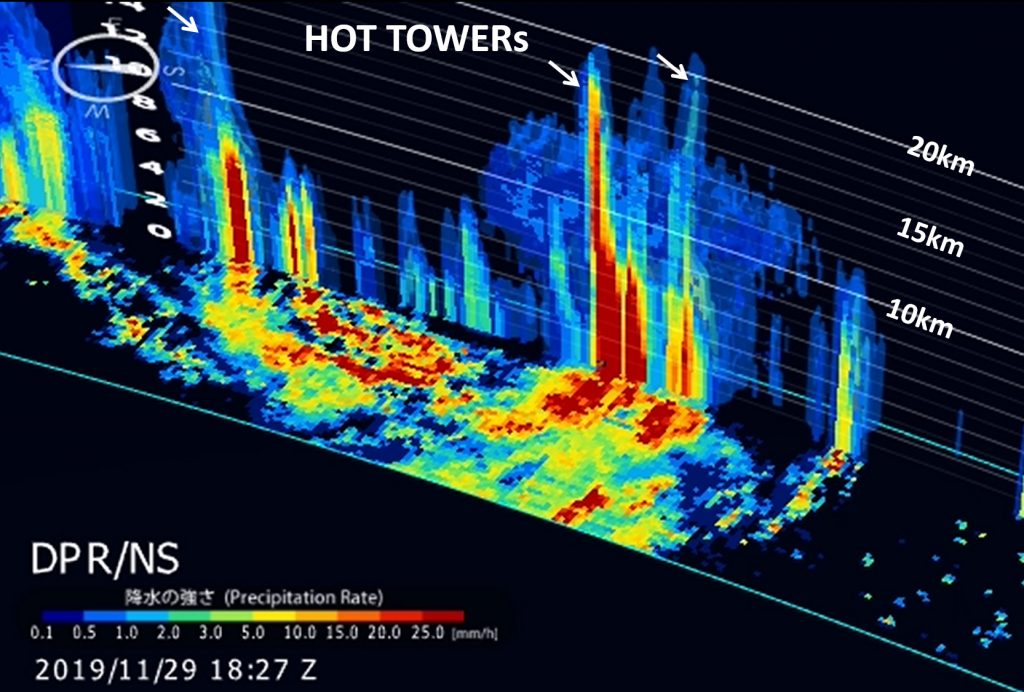
GPM/DPR observed “Hot tower” in Typhoon Kammuri which hit Philippines
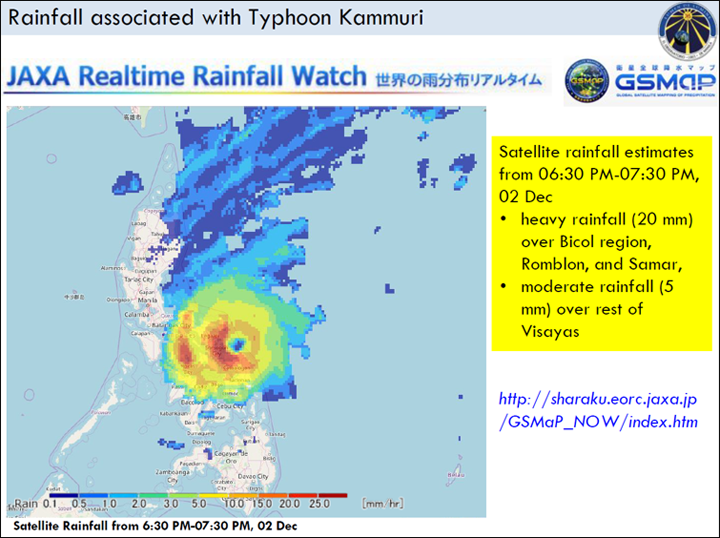
<<Time series of precipitation with the Typhoon Kammuri by GSMaP>>
The Typhoon Kammuri hit Philippines on December 2nd (local time) and caused serious damage there.
As an advantage to measure precipitation from space, we can capture precipitation distributions in global coverage including over the oceans far from land.
Figure 2 shows the timeseries of precipitation with Typhoon Kammuri by GSMaP from November 26th to December 4th.
|
|
| Fig.2 Time series of precipitation with the Typhoon Kammuri by GSMaP. (From November 26th to December 4th) |
<<3D structure of precipitation with the Typhoon Kammuri observed by GPM/DPR>>
GPM core observatory observed precipitation with the Typhoon Kammuri at 2:30 on November 30th (local time) shown in Figures 3 and 4.
GPM core observatory carries Dual-frequency Precipitation Radar (DPR) developed by Japan and GPM Microwave Imager (GMI) developed by the U.S. DPR can detect 3D structures of precipitation as shown in Figure 3.
|
|
| Fig.3 3D structure of precipitation with the Typhoon Kammuri observed by GPM/DPR. |
Figure 4 shows tall rain clouds in the 3D structure of the Typhoon Kammuri, which is called “hot tower” because it brings heating to the upper atmosphere as latent heating by precipitation formation. GPM/DPR observed that the precipitation top heights of the hot towers reached over 15 km.
The DPR observation data has been utilized for weather forecasting by Japan Meteorological Agency since March 2016.
Related Links
Search by Year
Search by Categories


Tags
-
#Earthquake
-
#Land
-
#Satellite Data
-
#Aerosol
-
#Public Health
-
#GCOM-C
-
#Sea
-
#Atmosphere
-
#Ice
-
#Today's Earth
-
#Flood
-
#Water Cycle
-
#AW3D
-
#G-Portal
-
#EarthCARE
-
#Volcano
-
#Agriculture
-
#Himawari
-
#GHG
-
#GPM
-
#GOSAT
-
#Simulation
-
#GCOM-W
-
#Drought
-
#Fire
-
#Forest
-
#Cooperation
-
#Precipitation
-
#Typhoon
-
#DPR
-
#NEXRA
-
#ALOS
-
#GSMaP
-
#Climate Change
-
#Carbon Cycle
-
#API
-
#Humanities Sociology
-
#AMSR
-
#Land Use Land Cover
-
#Environmental issues
-
#Quick Report
-
#GOSAT-GW
Related Resources


Related Tags
Disaster Related Articles
-
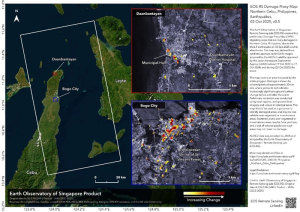 Disaster 2025.10.23 Thu ALOS-2 Observations of the Earthquakes in the Philippines
(Cebu Island and Mindanao Island) -
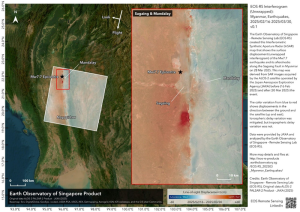 Disaster 2025.04.04 Fri ALOS-2 Observation of the M7.7 Earthquake in Myanmar
 -
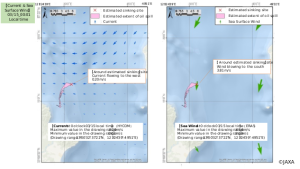
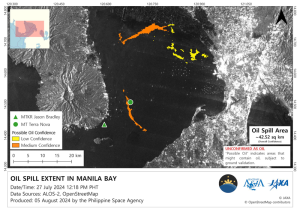 Disaster 2024.09.09 Mon ALOS-2 Observation of the Oil Spill Caused by the Sinking of a Tanker in Manila Bay, Philippines
 -
 Disaster 2023.04.07 Fri ALOS-2 observation: Oil spill from sunken oil tanker off Mindoro Island, Philippines (follow-up report)
Stay Connected
