


Applications
2019.03.25 Mon
Utilization of Global Satellite Mapping of Precipitation (GSMaP) in the agricultural field overseas
Under the Global Precipitation Measurement (GPM) project, JAXA has been providing global precipitation data based on “Global Satellite Mapping of Precipitation (GSMaP) ”, which was created by multiple satellite data from GPM Core Observatory, Global Change Observation Mission – Water “SHIZUKU” (GCOM-W), etc. The “JAXA Global Rainfall Watch” website, which displays GSMaP allows us to view hourly rainfall around the world.
So far, GSMaP has been used in many cases in the field of meteorology and disaster prevention. Recently, in the agricultural field, the use of precipitation data from GSMaP is expanding as basic information that is important for determining crop growth.
Since precipitation observation data of GSMaP specifies not only “the amount and location of rainfall” but also “locations where it is not raining”, this information is useful for capturing droughts that have a significant impact on agriculture, including crop growth conditions and yields. Drought damage suffered by farmers has been pointed out to be getting worse in recent years due to climate change and global warming.
There are various measures to reduce the risk of drought damage to agricultural products, and we introduce the example of social implementation that GSMaP data are actually used in private companies. “Weather index insurance” was developed by a private Japanese company to help farmers in developing Asian countries, which are exposed to risks from drought and other weather and climate changes, to run stable businesses. In the process to develop this weather index insurance, ground observation was not enough at the site, so GSMaP data is used to determine actual precipitation. One of Thailand’s major export crops is a tropical fruit called “longan”, which belongs to the same family as litchee. This longan is also exposed to drought risk, and information has been released that a weather index insurance for longan farmers covering Chiang Mai will be available from February 2019.
In addition to the private sector use described above, JAXA is also promoting the use of GSMaP in the agricultural field.
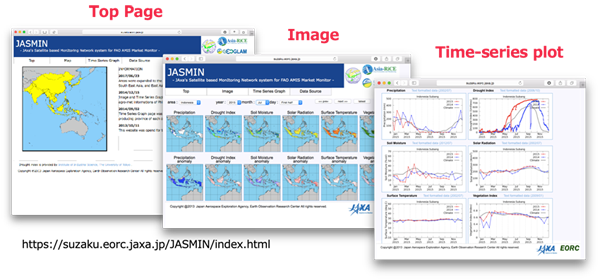
As a part of the Asian Rice Crop Estimation and monitoring (Asia-RiCE) project under the Group on Earth Observations (GEO) Global Agricultural Monitoring initiative (GEOGLAM) adopted at the G20 Agriculture Ministers’ Meeting in 2011, JAXA has developed a web system called JAxa’s Satellite based MonItoring Network system (JASMIN) and made it available on the internet in order to provide agricultural meteorological information to the ministries of agriculture in Southeast Asian countries. The system provides not only GSMaP, but also soil moisture content, solar radiation, surface temperature, vegetation index, and drought index (drought index data is provided by Institute of Industrial Science, the university of Tokyo) generated from various satellites and sensors, so that important weather information for agriculture can be viewed at a glance through satellite observation. Moreover, in order to utilize this system effectively, JAXA cooperates with agricultural statisticians of the Ministry of Agriculture of each country and experts of the ASEAN Food Security Information System (AFSIS) , and produce monthly Rice Growing Outlook (RGO) report. The RGO report is provided to the Agricultural Market Information System (AMIS) operated by the Food and Agriculture Organization (FAO) and other organizations through GEOGLAM and is used by the crop monitor in the Market Monitor published monthly by AMIS. This effort is also included in the Japanese government’s Sustainable Development Goal (SDG) Action Plan 2019 as “Monitoring the Rice Crop in Southeast Asia.”
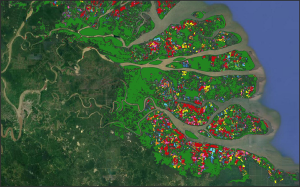
As an application case of JASMIN, here is an example of the 2015 drought in Chiang Mai, Thailand, which is covered by weather index insurance.
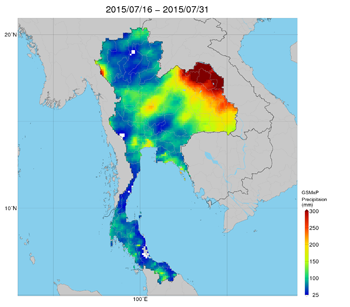
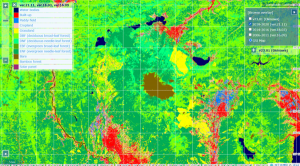
In the summer of 2015, as the Asian monsoon was weaker than normal, precipitation was below normal in northwestern Thailand. JASMIN captured the rising risk of drought (Figure 2) . The temporal variation of precipitation in Chiang Mai (northwest) at this time also shows that precipitation during June-September is below normal (Figure 3) .


Figure 2. Distribution of GSMaP precipitation (left) and drought index (right) values (top) and anomalies from normal (bottom) in Thailand in late July 2015. A higher value of the drought index indicates a higher risk of drought. *From JASMIN
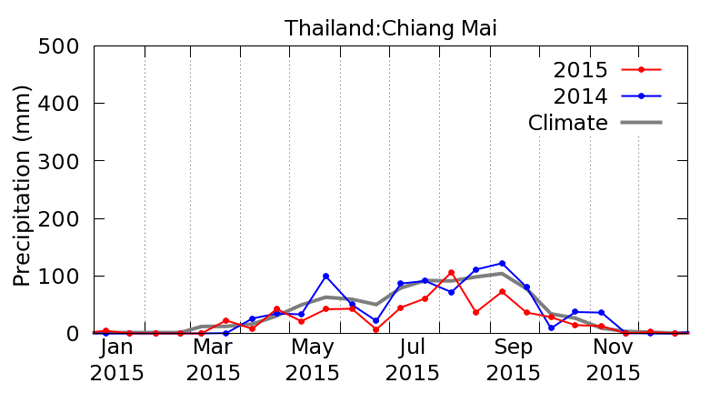
(Red: 2015, Blue: 2014, Gray: normal value) *From JASMIN
In many areas of the world, the ground observation network is not sufficient to monitor precipitation, thus GSMaP, which was developed based on data from satellites to cover the entire globe, is helpful.
Observation images
Observation images
Search by Year
Search by Categories


Tags
-
#Earthquake
-
#Land
-
#Satellite Data
-
#Aerosol
-
#Public Health
-
#GCOM-C
-
#Sea
-
#Atmosphere
-
#Ice
-
#Today's Earth
-
#Flood
-
#Water Cycle
-
#AW3D
-
#G-Portal
-
#EarthCARE
-
#Volcano
-
#Agriculture
-
#Himawari
-
#GHG
-
#GPM
-
#GOSAT
-
#Simulation
-
#GCOM-W
-
#Drought
-
#Fire
-
#Forest
-
#Cooperation
-
#Precipitation
-
#Typhoon
-
#DPR
-
#NEXRA
-
#ALOS
-
#GSMaP
-
#Climate Change
-
#Carbon Cycle
-
#API
-
#Humanities Sociology
-
#AMSR
-
#Land Use Land Cover
-
#Environmental issues
-
#Quick Report
-
#GOSAT-GW
Related Resources


Related Tags
Applications Related Articles
-
 Applications 2024.01.15 Mon The Use of Earth Observation Satellite Data in the Humanities and Social Sciences (2)
 -
 Applications 2023.11.29 Wed The Use of Earth Observation Satellite Data in the Humanities and Social Sciences (1)
 -
 Applications 2023.08.04 Fri Contribution to SDGs Goal 6 “Clean Water and Sanitation”
 -
 Applications 2023.07.10 Mon Contribution to SDGs Goal 15 “Life on Land”
Stay Connected
