


Disaster
2018.08.08 Wed
Flood damage caused by the 2018 West Japan heavy rain as reproduced by Today’s Earth
The 2018 West Japan heavy rain caused extensive damage over a wide area, including Kyushu, Chugoku, Shikoku, and Kinki regions. We wish to extend our deepest sympathy to all those who have suffered hardship from the disasters.
JAXA has been analyzing the heavy rains using the Global Precipitation Measurement (GPM) core observatory and the Global Satellite Mapping of Precipitation (GSMaP) and analyzing the flooded areas using the Advanced Land Observing Satellite-2 “DAICHI-2” (ALOS-2). In addition to the above, this time we used a high-resolution version of the terrestrial hydrological simulation model, “Today’s Earth (TE)”, which is being developed jointly with the University of Tokyo, to conduct experiments to reproduce the river flooding and inundation that caused severe damage.
Overview of heavy rain
The rainy season front, which had been stagnant near west Japan since around July 5, 2018, and the influence of the extratropical cyclone that changed from Typhoon No. 7, continued to supply warm and very humid air near Japan, resulting in record-breaking heavy rains over a wide area of the country, mainly in west Japan (Figure 1). The Ministry of Land, Infrastructure, Transport and Tourism says that the heavy rains caused levees of 22 rivers across Japan to collapse, leading to widespread flooding and inundation damage.
Flooding and inundation reproduced by Today’s Earth
Since precipitation is closely related to the risk of flooding in a given area, rainfall observation is essential for evacuation planning. However, this alone does not allow for a detailed understanding or prediction of where and to what extent flooding and inundation damage will actually occur. Today’s Earth (TE) can reproduce flooding and inundation by calculating (simulating) the movement of water and heat on the land surface on a computer based on meteorological data, including physical quantities such as precipitation observed by satellites. This time, in order to understand the situation in western Japan, which was severely damaged by the heavy rains, we conducted a hindcast simulation using a system with a spatial resolution of 1 km (under development).
Figure 2 shows the results of the hindcast simulation in Takahashi River, Kurashiki City, Okayama Prefecture, where flood damage was particularly severe. The images reproduce the rapid increase in river flow in the mainstream (Takahashi River) flowing from north to south due to heavy rains, followed by the spread of flooding around the confluence because the river could no longer withstand the inflow from the tributary (Oda River).
Figure 2. River flow conditions around the Takahashi River from 0:00 on July 6 to 0:00 on July 8 (Japan time). The left image shows the river flow rate, and the right image shows the flooded area. The red frames show the areas that suffered the most severe flood damage. The Takahashi River flows into the Seto Inland Sea from the north, and the Oda River joins it from the west.
Figure 3 shows the results of the hindcast simulation in Hijikawa River, Ozu City, Ehime Prefecture, where extensive damage occurred. Since around midnight on July 6, when a flood warning was issued by the Japan Meteorological Agency, the river has continued to flow at high rates, and by the afternoon of the same day, an orange to red grid indicating flooding can be seen spreading around the meandering parts of the river as it flows from southeast to northwest.
Figure 3. River flow conditions around the Hijikawa River from 0:00 on July 6 to 0:00 on July 8 (Japan time). The left image shows the river flow rate, and the right image shows the flooded area. The red frames show the areas that suffered the most severe flood damage. The Hijikawa River meanders from southeast to northwest.
In both results, the areas where TE determined that the flood damage would be severe (orange to red grids) roughly correspond to the flooded areas (Takahashi River and Hijikawa River) on July 7 as estimated by the Geospatial Information Authority of Japan (GSI) based on video information. In addition, the resolution is at a level that can adequately show the scope and scale of the disaster. For more detailed information on the flood damage, please refer to the reports from the Institute of Industrial Science at the University of Tokyo and others.
As stated above, 1-km resolution simulations can provide information that is directly related to decision-making in daily life, including physical quantities that cannot be observed by satellites. While this is a post-disaster analysis, we plan to operate this system on a regular basis. JAXA/EORC will work to improve the accuracy of the satellite data that is used in the simulations and cooperate with the University of Tokyo in order to develop and implement a high-spatial resolution terrestrial model. This will provide more useful information quickly and accurately.
Explanation of the Images
Figure 1
| Satellite | Global Precipitation Measurement (GPM) core observatory |
|---|---|
| Sensor | Dual-frequency Precipitation Radar (DPR) |
| Date | July 6, 2018 0:00 – July 8, 2018 0:00 (Japan time) |
Related Sites
Today’s Earth – Global
JAXA Global Rainfall Watch (GSMaP)
GPM Website
Yoshimura Laboratory, the Institute of Industrial Science, the University of Tokyo
Updates on Earth Disaster
Search by Year
Search by Categories


Tags
-
#Earthquake
-
#Land
-
#Satellite Data
-
#Aerosol
-
#Public Health
-
#GCOM-C
-
#Sea
-
#Atmosphere
-
#Ice
-
#Today's Earth
-
#Flood
-
#Water Cycle
-
#AW3D
-
#G-Portal
-
#EarthCARE
-
#Volcano
-
#Agriculture
-
#Himawari
-
#GHG
-
#GPM
-
#GOSAT
-
#Simulation
-
#GCOM-W
-
#Drought
-
#Fire
-
#Forest
-
#Cooperation
-
#Precipitation
-
#Typhoon
-
#DPR
-
#NEXRA
-
#ALOS
-
#GSMaP
-
#Climate Change
-
#Carbon Cycle
-
#API
-
#Humanities Sociology
-
#AMSR
-
#Land Use Land Cover
-
#Environmental issues
-
#Quick Report
-
#GOSAT-GW
Related Resources


Related Tags
Disaster Related Articles
-
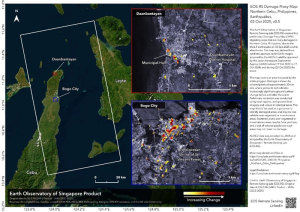 Disaster 2025.10.23 Thu ALOS-2 Observations of the Earthquakes in the Philippines
(Cebu Island and Mindanao Island) -
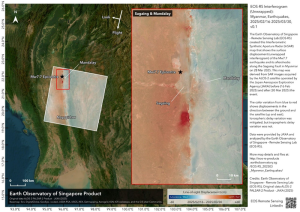 Disaster 2025.04.04 Fri ALOS-2 Observation of the M7.7 Earthquake in Myanmar
 -
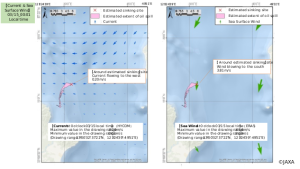
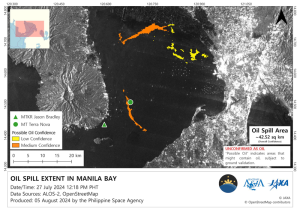 Disaster 2024.09.09 Mon ALOS-2 Observation of the Oil Spill Caused by the Sinking of a Tanker in Manila Bay, Philippines
 -
 Disaster 2023.04.07 Fri ALOS-2 observation: Oil spill from sunken oil tanker off Mindoro Island, Philippines (follow-up report)
Stay Connected
