


Applications
2013.05.28 Tue
Exploitation of Sea Surface Wind Resources: Earth Observation Satellite for Addressing Challenges in Renewable Resources
According to the Kyoto Protocol adopted in the Third Session of the Conference of the Parties to the United Nations Framework Convention on Climate Change (COP3), held in Kyoto in December 1997, it is our duty to decrease emissions of six greenhouse gases (such as CO2) and to create a low-carbon society (Ref. 1). Renewable energy is derived from sources that can be continually replenished, such as solar, geophysical, or biological resources (solar power, sea surface wind, geothermal power, and biomass). The use of such resources emits limited amounts of CO2 gas, unlike the burning of fossil fuels such as oil and coal (Ref. 2), and thus contributes to the amelioration of global warming. In Japan, the use of sea surface wind is the primary contender for use as a renewable energy source. However, when choosing an appropriate location for the construction of a land-based wind farm, factors such as disturbance to the wind stream by geographical features and ground-based obstacles need to be considered. In contrast, the construction of windmills over the sea does not have such obstacles, and instead benefits from a good wind synopsis and little turbulence. In addition, the need to consider noise, pollution, and the preservation of scenery on land, when building a wind farm, shows that constructing the farms over the ocean could be considered a viable alternative.
In March 2013, the first giant windmill built in the Sea in Japan began operation as an offshore power resource near Choshi City in Chiba Prefecture. The windmill has been built for an empirical research project by the New Energy and Industrial Technology Development Organization (NEDO), and is located about 3.1 km offshore from Choshi City. The windmill stands at a height of 80 m above the sea surface, has a diameter of 92 m, and generates wind power up to 2,400 kW (Ref. 3).
Choshi City is located at the eastern end of Chiba prefecture, where the prevailing wind in winter is a cold northwesterly formed due to the Siberian high pressure, and the prevailing southerly wind in summer is produced from high pressure over the Pacific Ocean. Strong winds often blow on the coastal zone, which is open to the south and the north, and according to the Local Meteorological Observatory of Choshi, the annual mean wind speed along the seashore is 3 to 6 m/s. Choshi city, in particular, is subjected to frequent strong winds, as shown in records of maximum daily wind speeds of over 10 m/s, as observed on 140 days a year (Ref. 4).
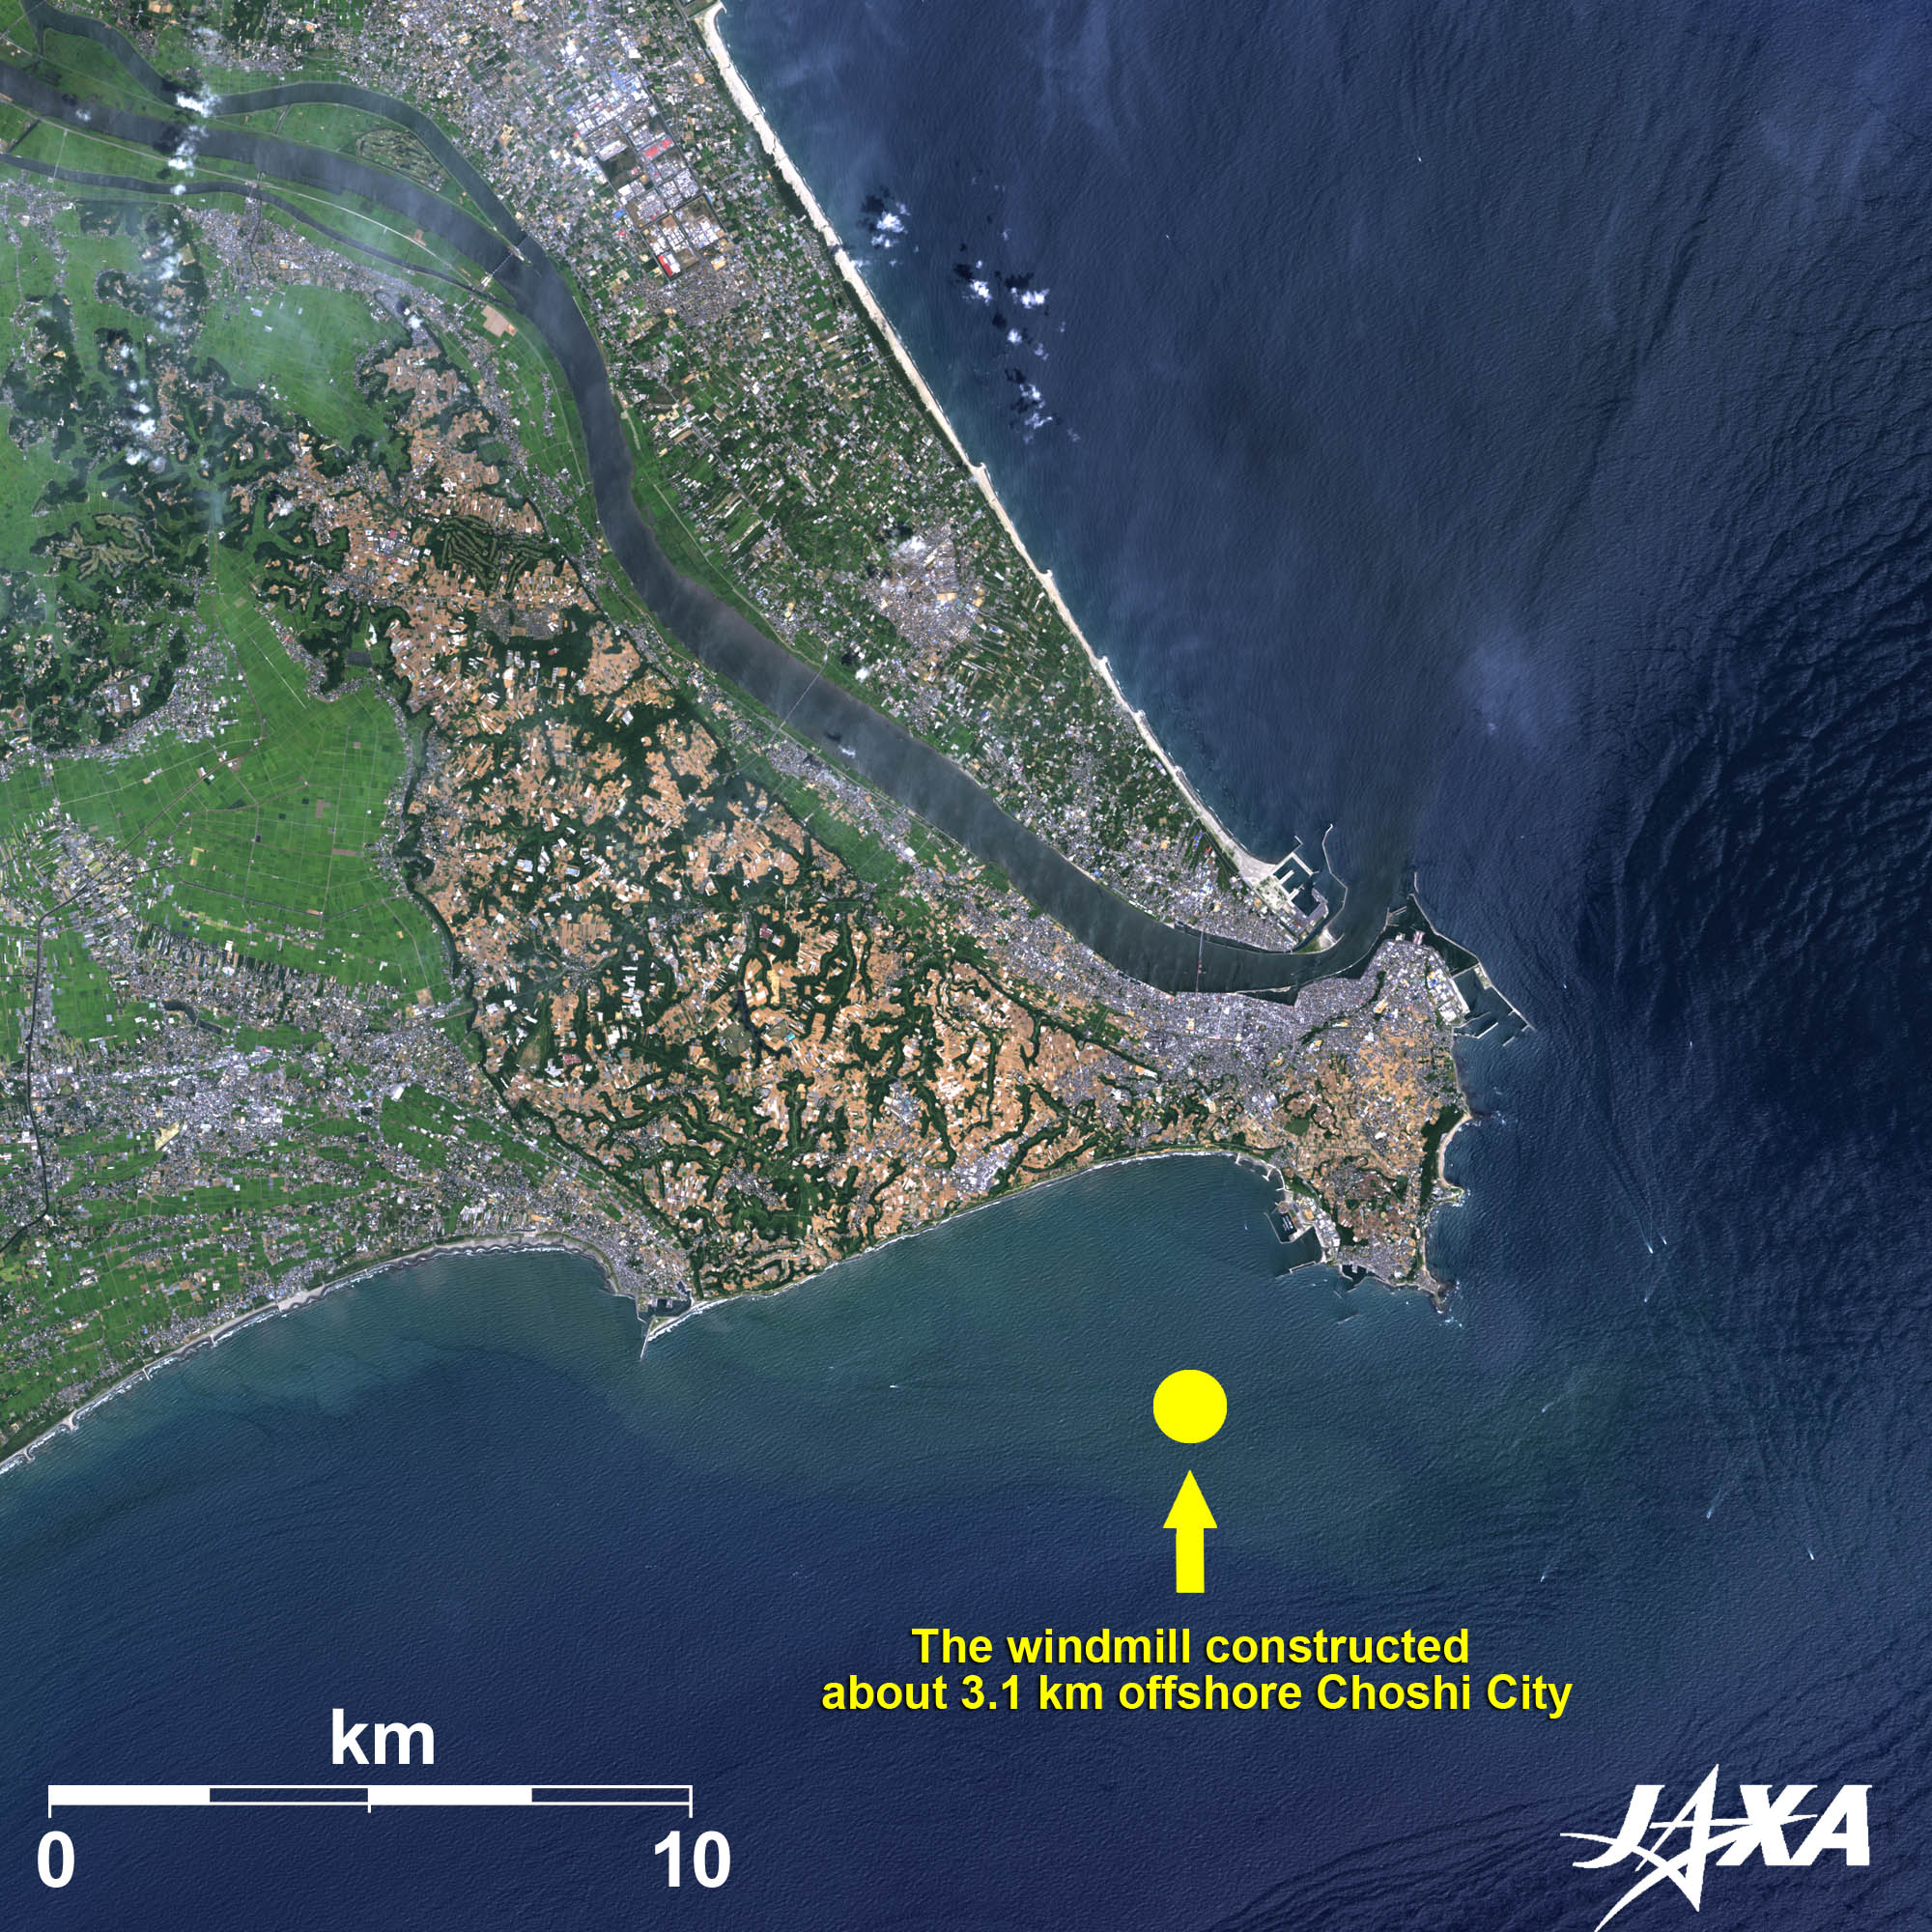
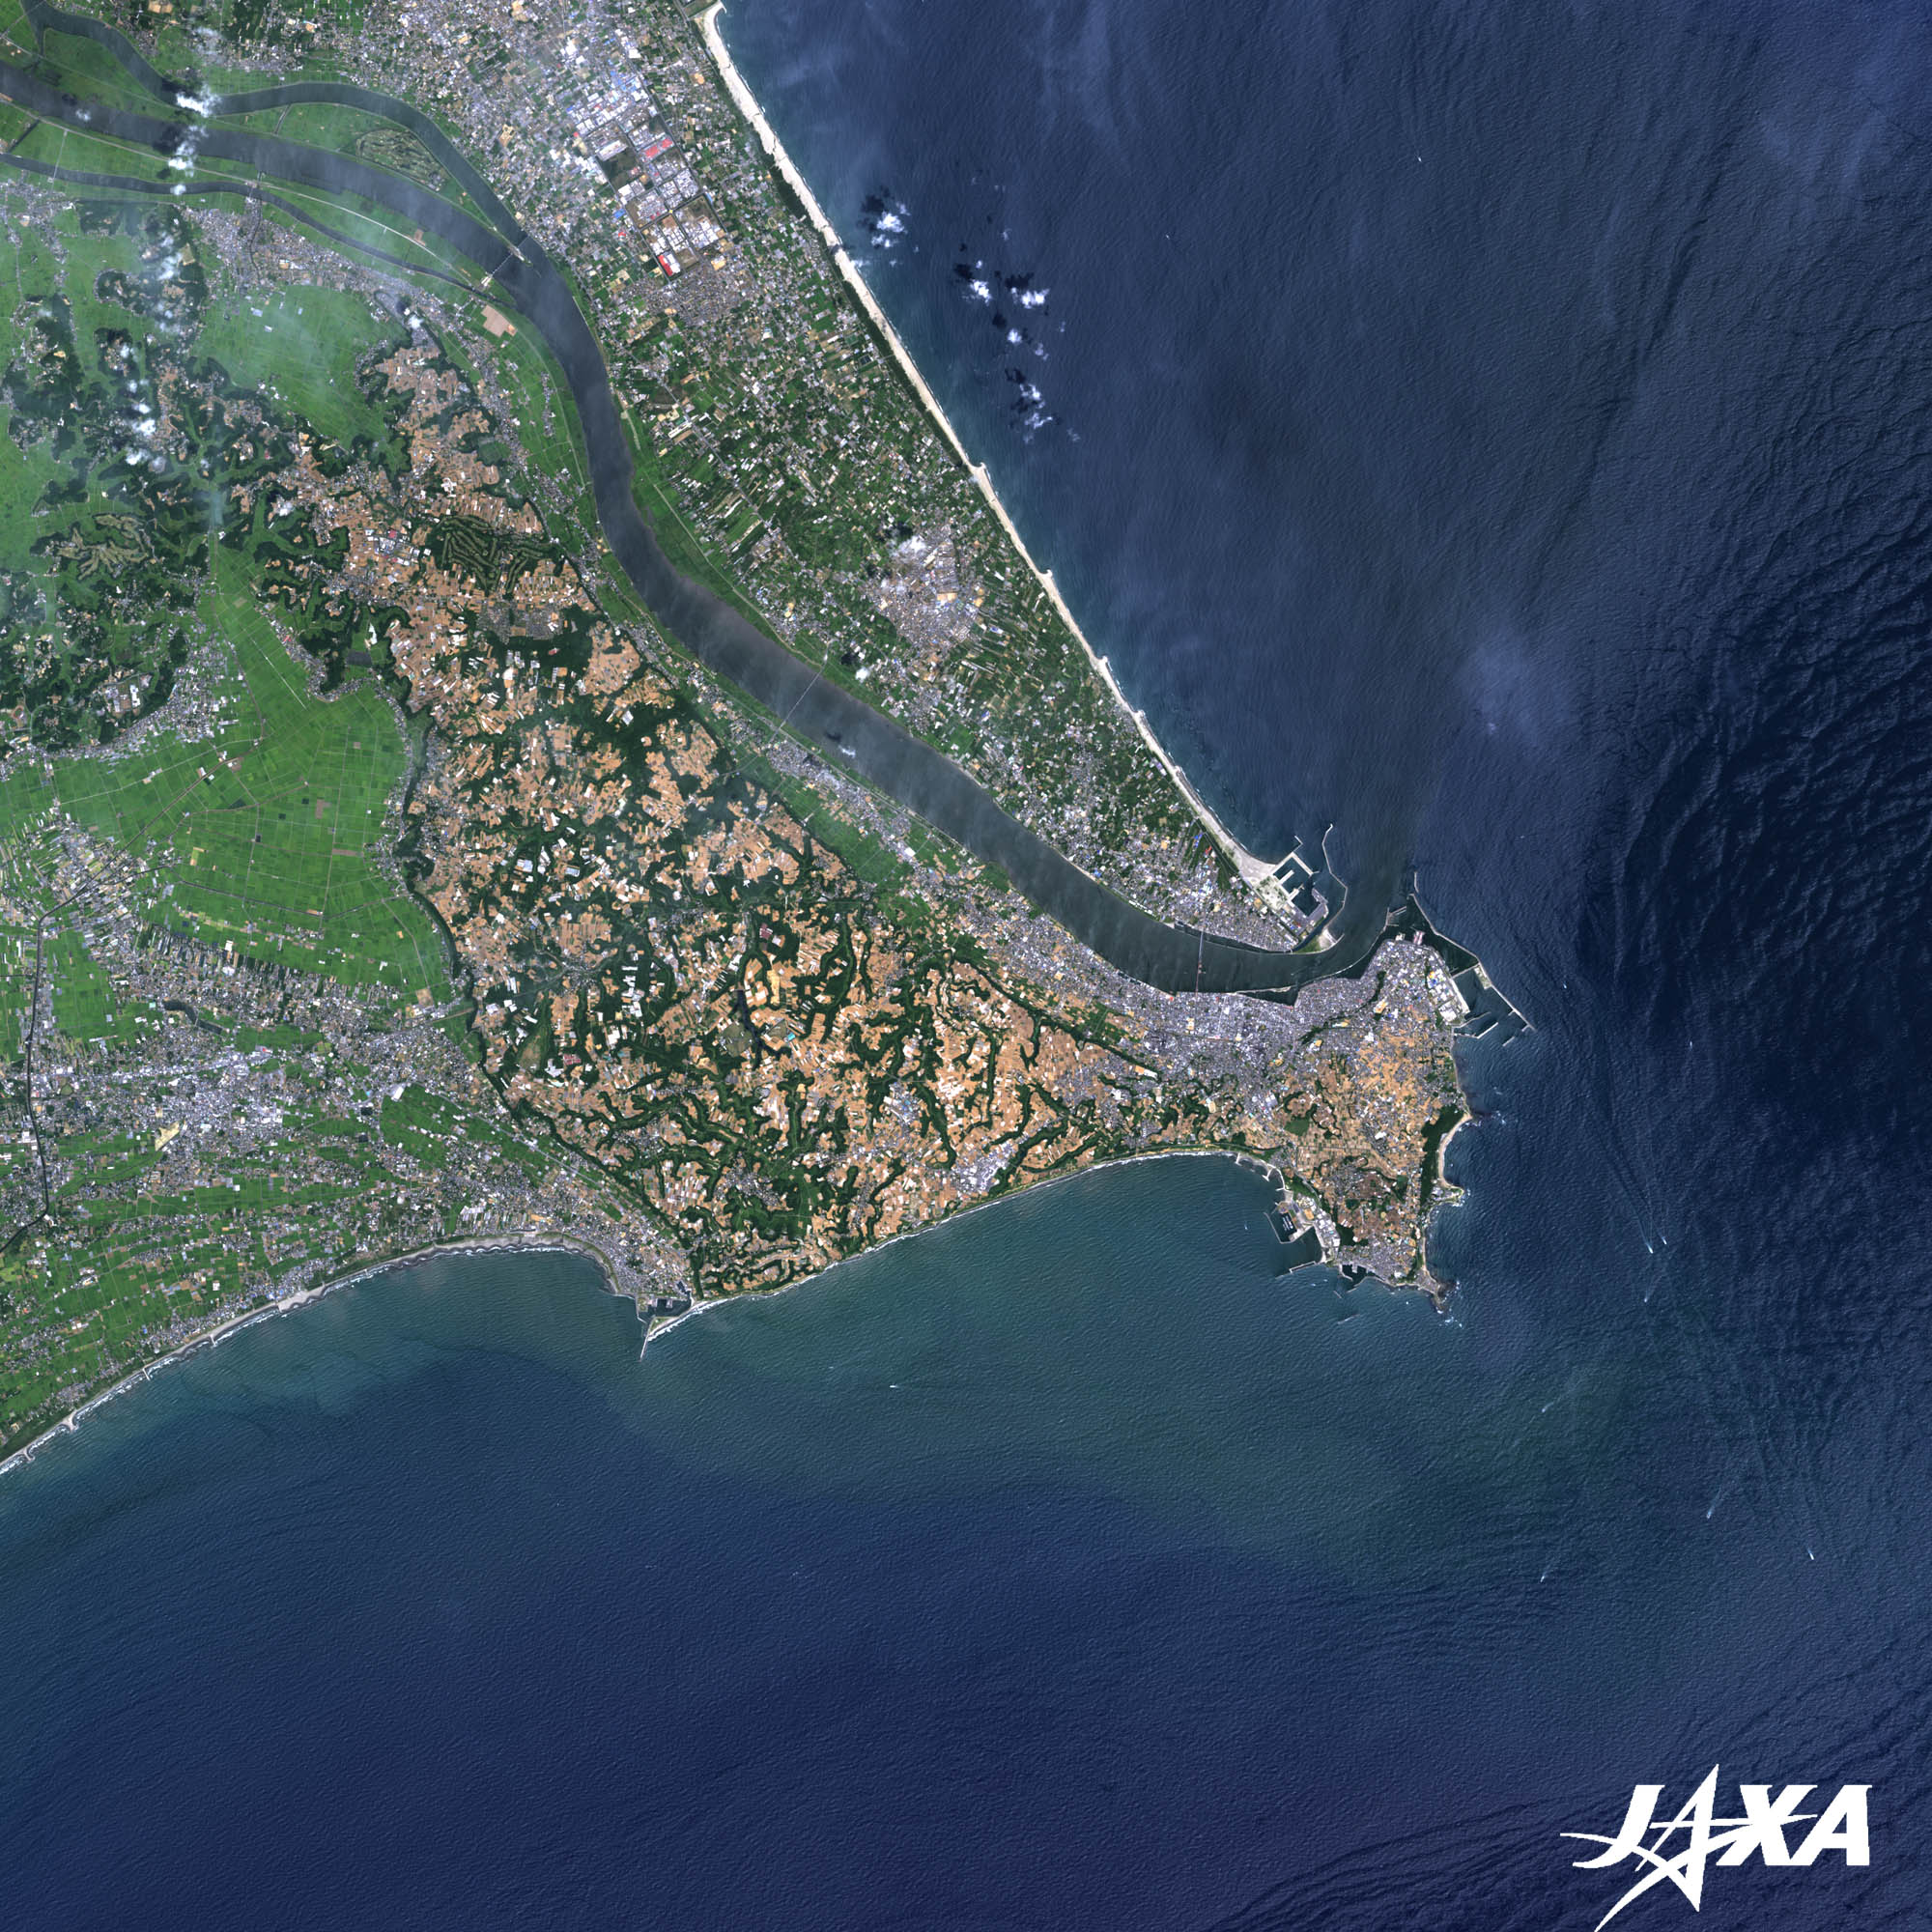
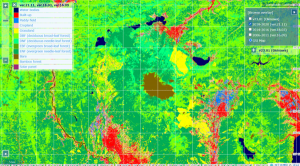
Fig.1 shows the sea surface wind distribution around Japan, derived from observed data by ScanSAR mode observation from a synthetic aperture radar (SAR) (PALSAR) onboard “Daichi” (ALOS), on April 1 and January 11, 2009. The intensity of the back-scattering of the microwaves on the sea’s surface is related to the following factors: the wave length, polarization, angle of incidence, sea surface wind speed, angle (relative wind direction) between the microwave incidence azimuth angle and the wind direction angle, and the back scattering intensity that generally increases with an increase in wind speed. When using a scatterometer, the multiple angle observation provides wind direction information as well as wind speed, but with a synthetic aperture radar only one azimuth angle observation can be conducted. Therefore, the wind direction information was provided based on other available data for the mapping used in this study. For the observation data on January 11, the wind distribution captured typical patterns of the north wind blowing over Japan from the continent in winter (Ref. 5). Fig.2 is the image of Chioshi City observed from “Daichi” (ALOS) on August 6, 2010. The windmill of the wind farm is located offshore Byobugaura.
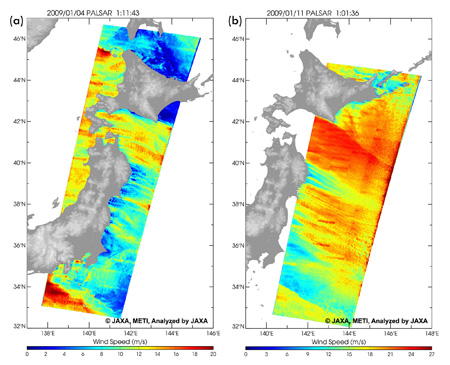
Fig. 1. Wind speed information derived from SAR data observed from “Daichi” (ALOS).
caption on
caption off
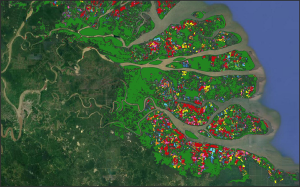
Fig. 2.Enlarged Image of Choshi City observed by “Daichi” (ALOS) Chioshi City (kmz, 4.32 MB low-resolution) as seen on Google Earth
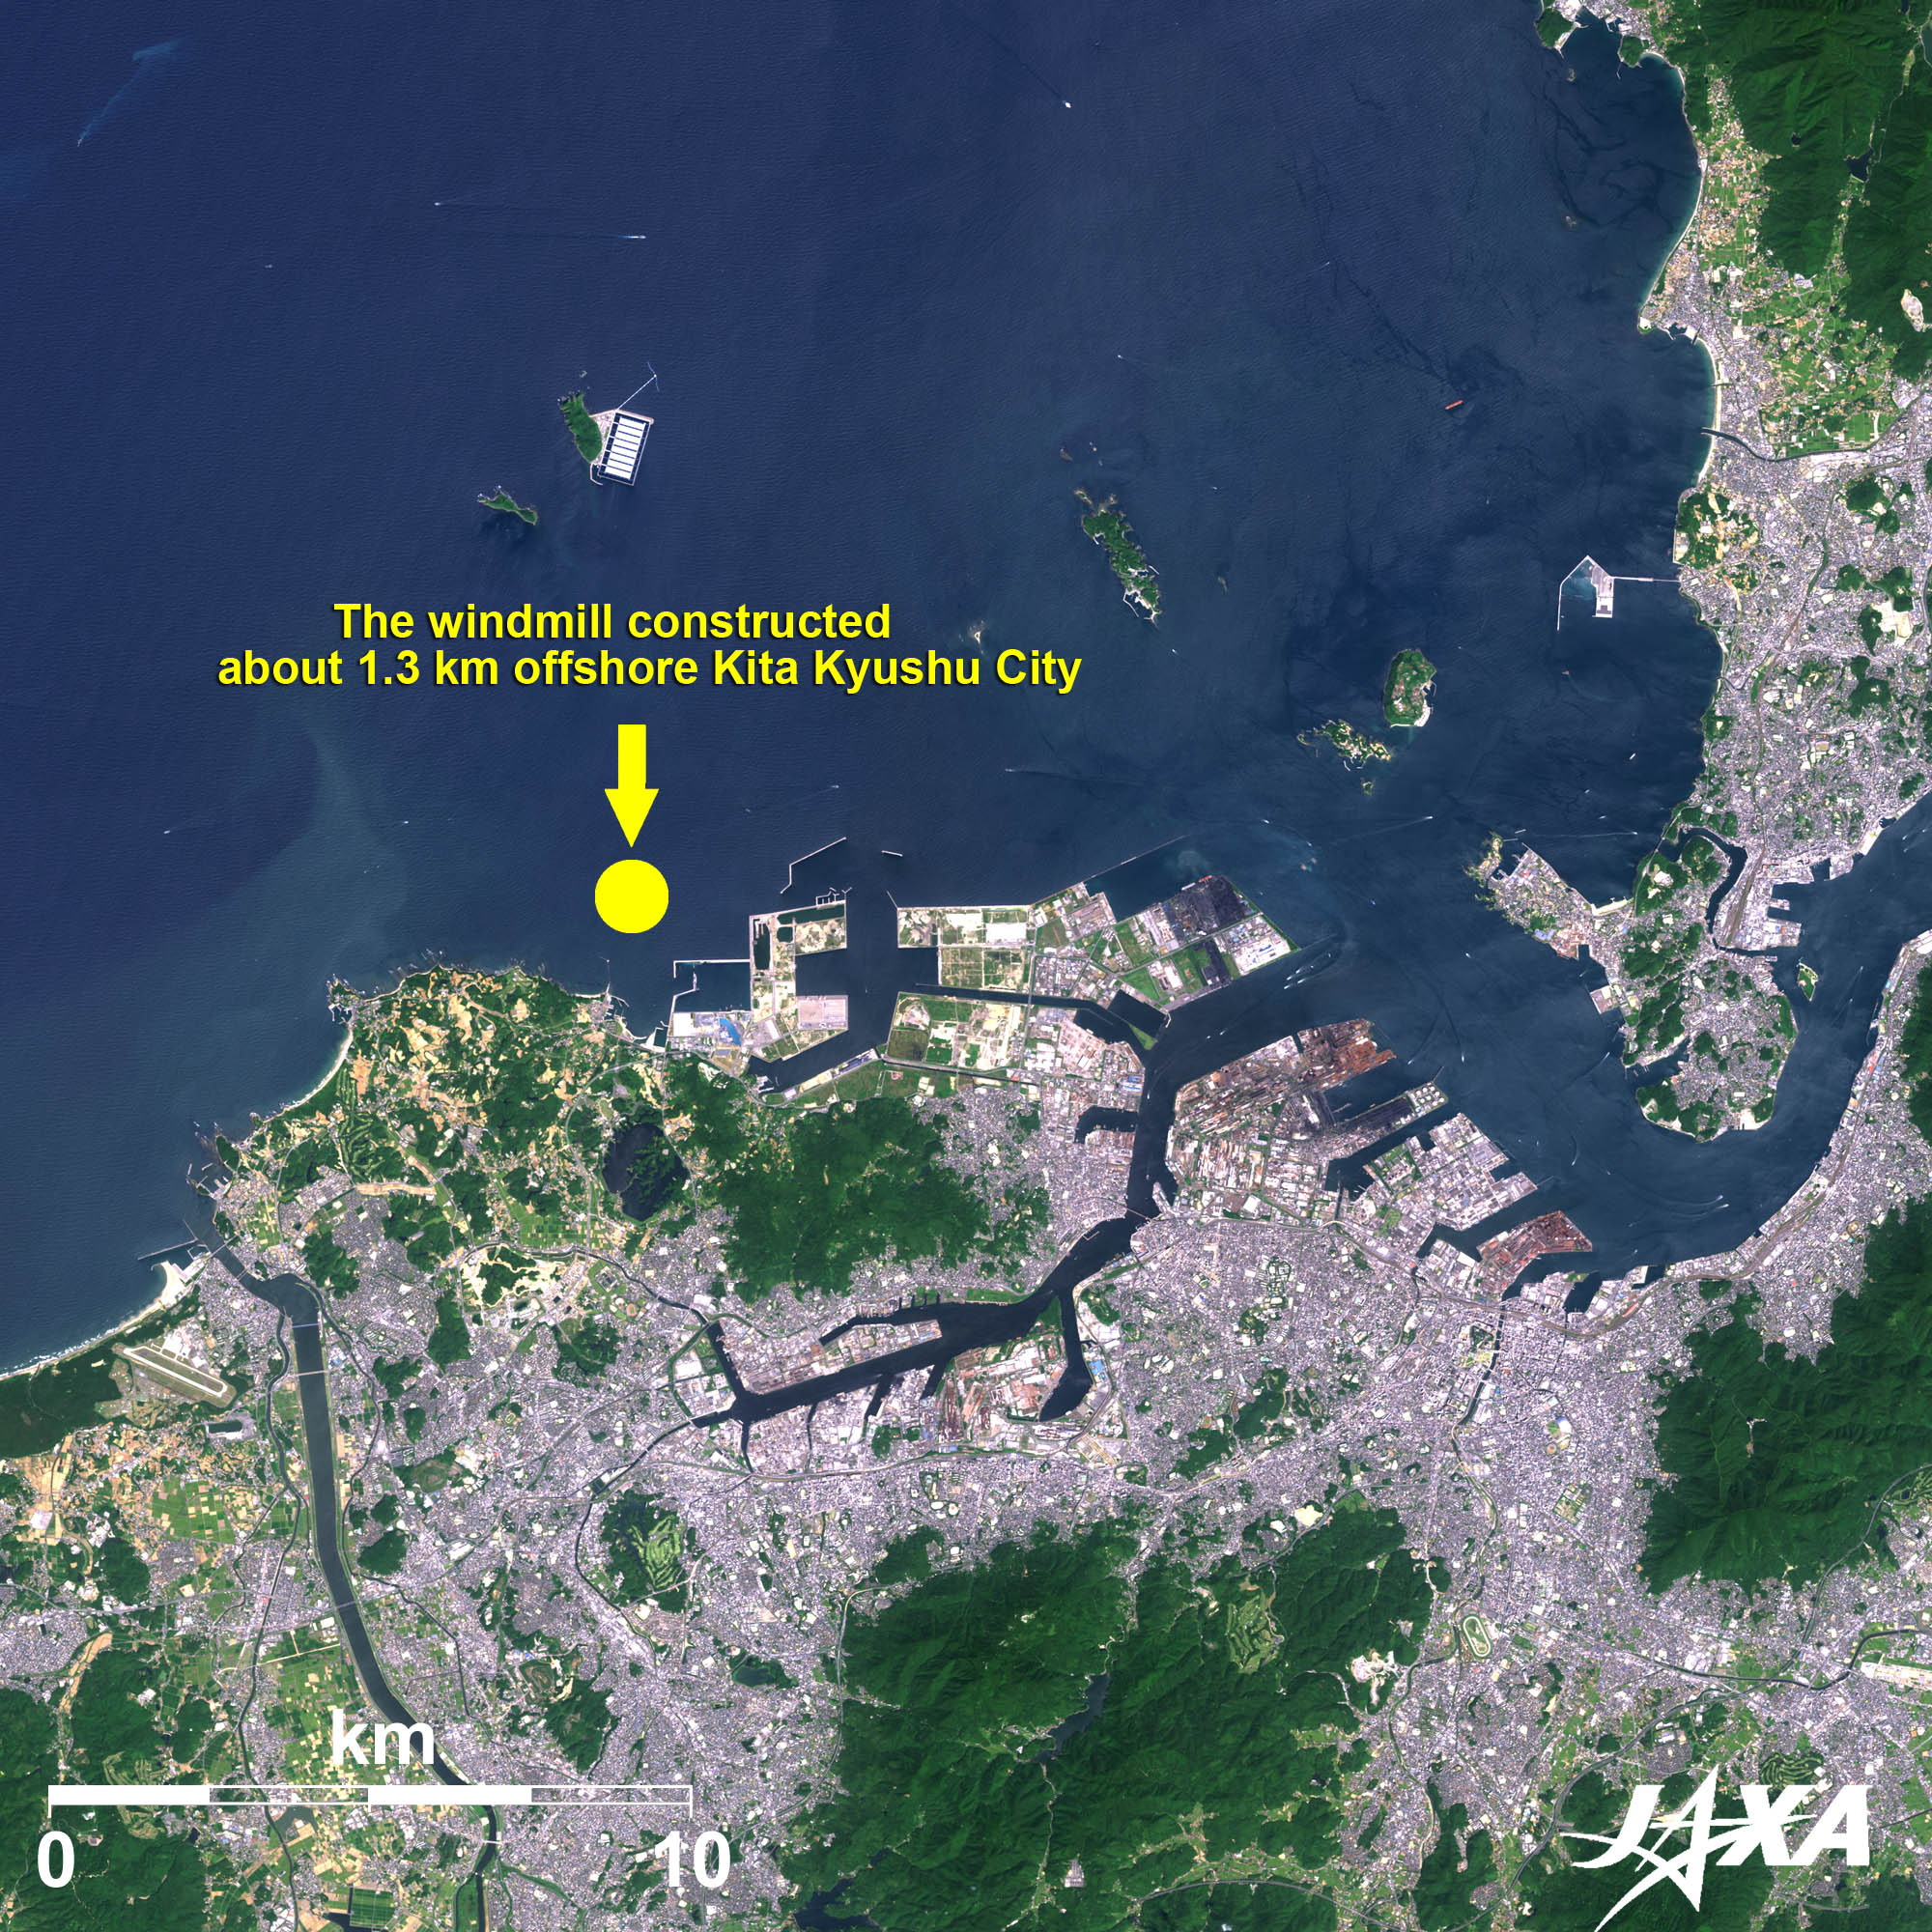
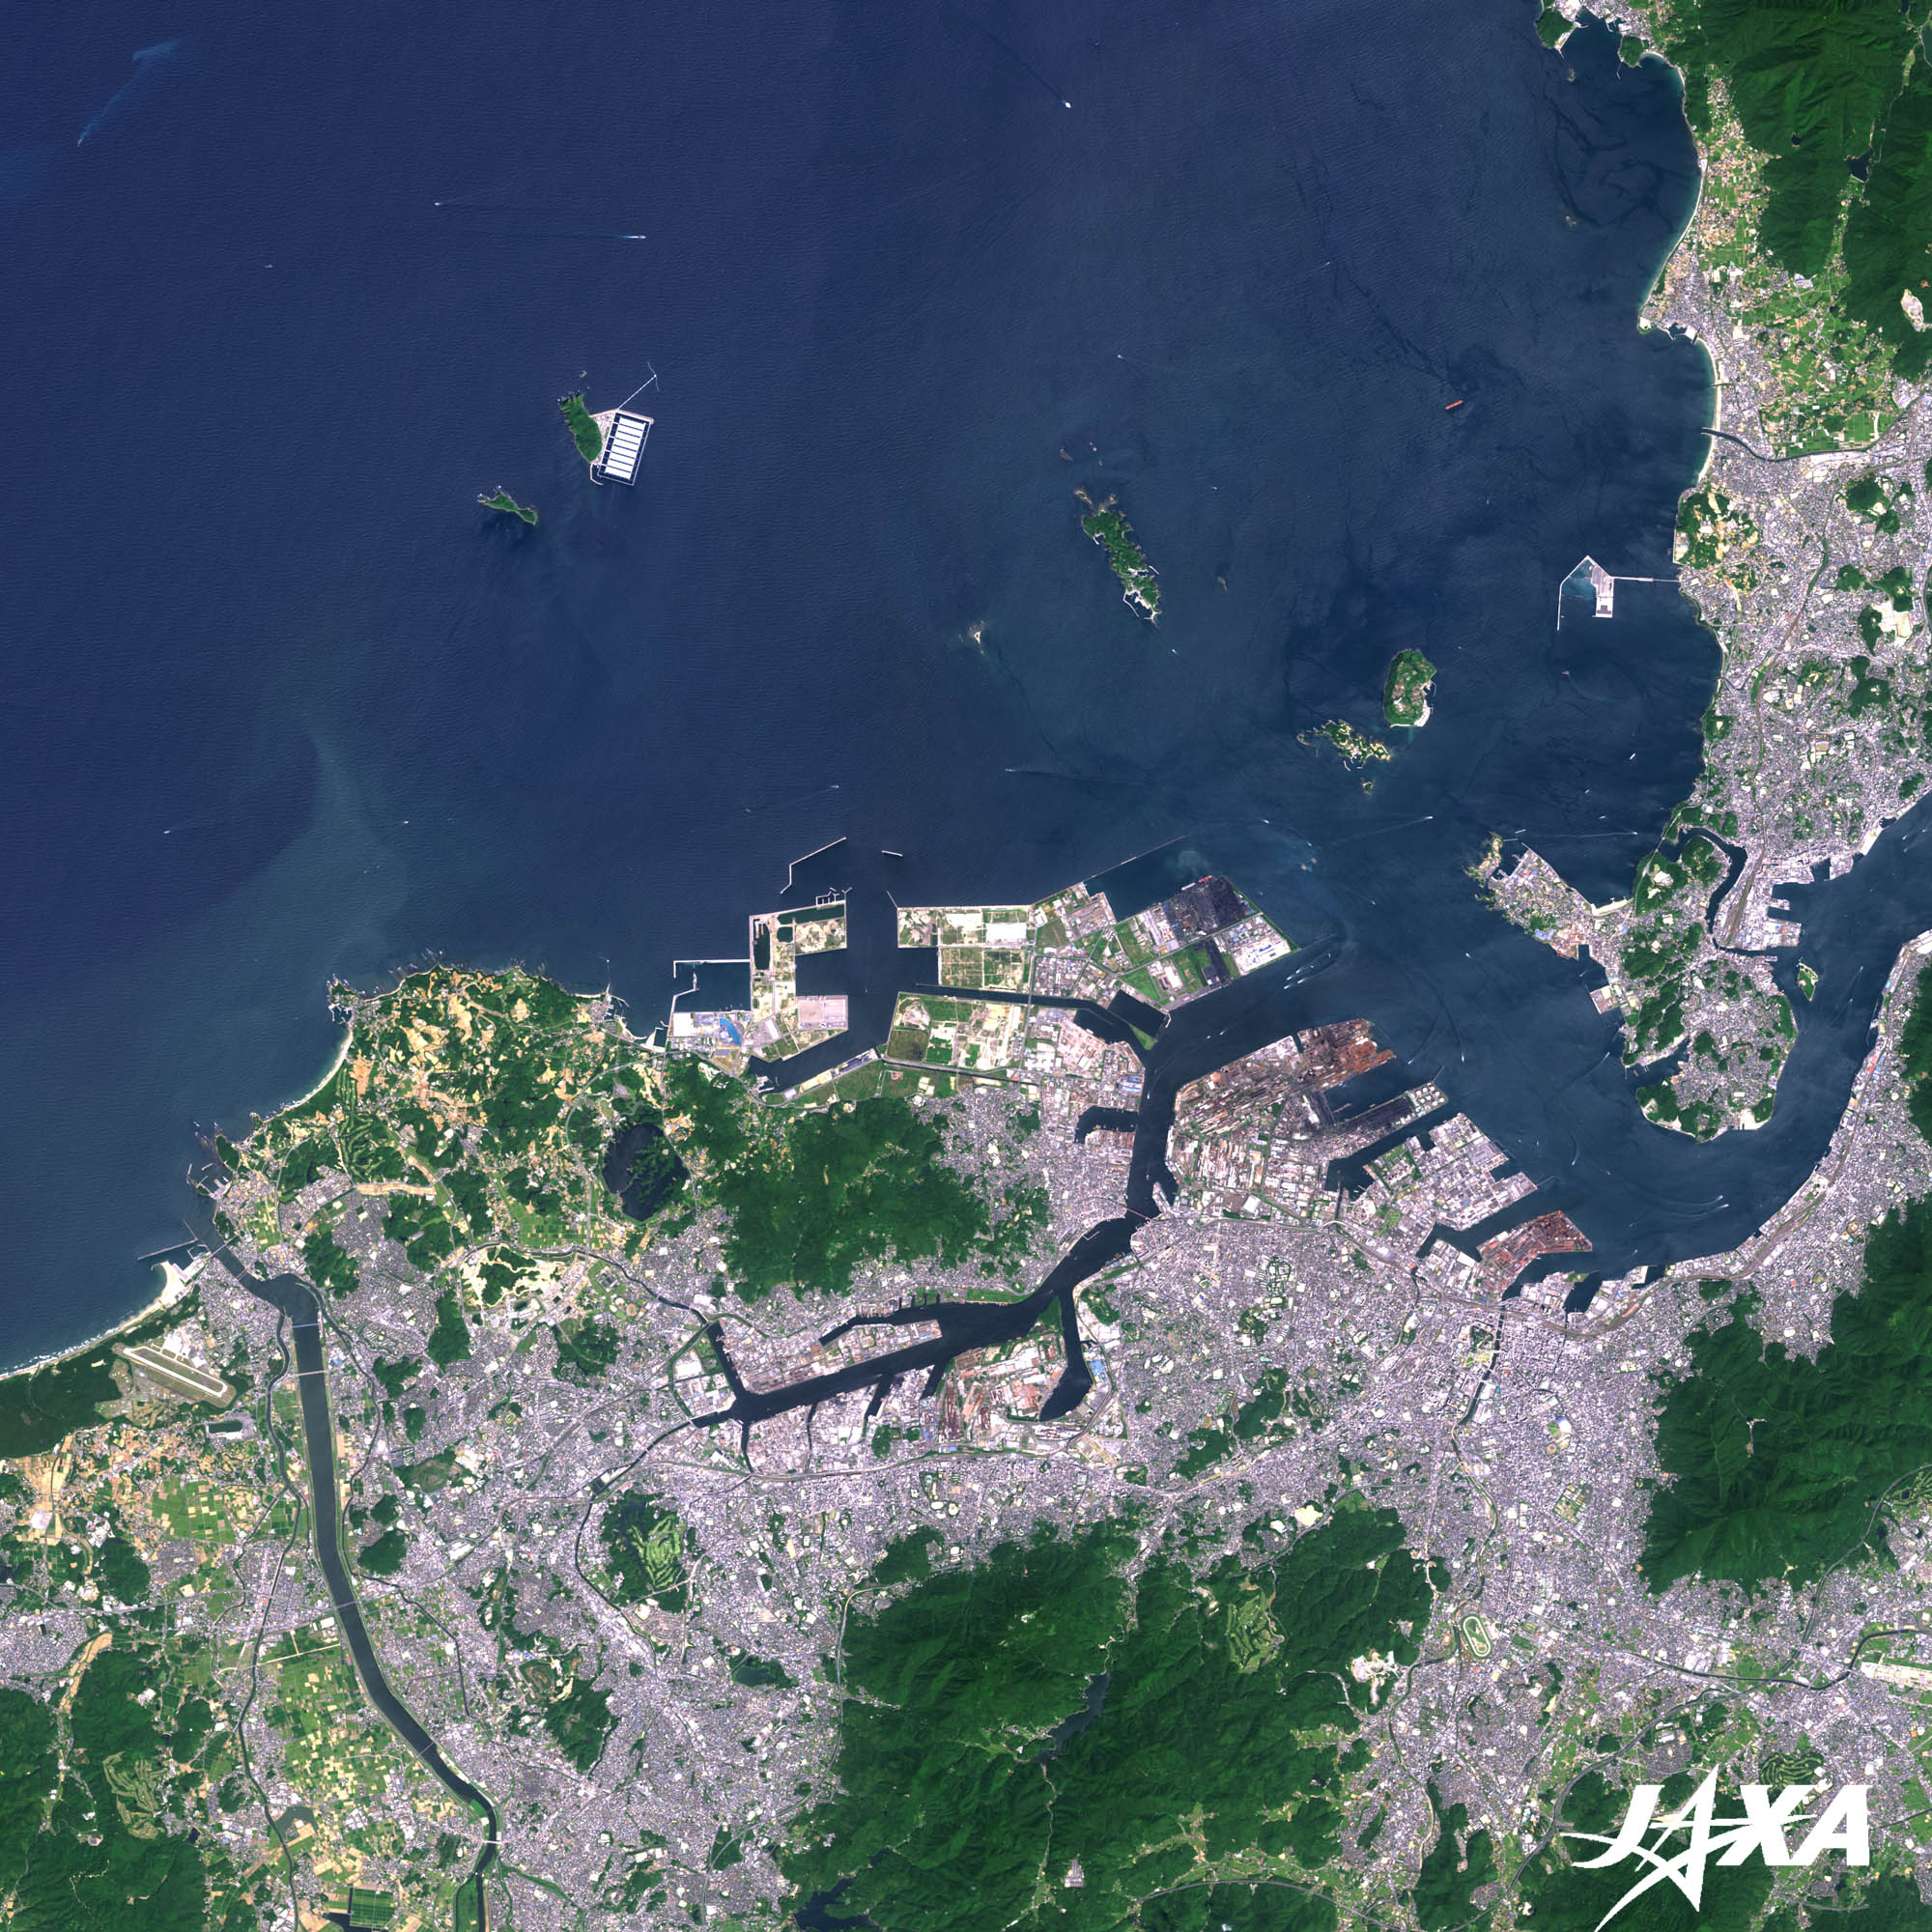
The image of Kita Kyushu City in Fukuoka prefecture, observed on September 2, 2009, is shown in Fig. 3. Another windmill in the Sea of Japan, located offshore from Kita Kyushu City was constructed following operation of the windmill offshore from Choshi, and it began operation in June 2013. The windmill is constructed about 1.3 km offshore from Kita Kyushu City. The height of its hub is 80 m, and it has a diameter of 83 m; generating 2000 kW of power (Ref. 6).
caption on
caption off
Fig. 3. Enlarged image of Kita Kyushu City observed by “Daichi” (ALOS)
Kita Kyushu City (kmz, 4.32 MB low-resolution) as seen on Google Earth
“Daichi 2” (ALOS-2) is planned for launch within the Japanese Fiscal Year of 2013, and the prospective application of the data obtained from its operation will be to make sea surface wind measurements and to contribute to a survey with the aim of finding an appropriate site for a wind farm. Additionally, earth observation satellite monitoring is expected to provide environmental monitoring information applicable for assessing the influences of the windmill.
Reference sites
Explanation of the Images:
| Satellite: | Advanced Land Observing Satellite (ALOS) (Daichi) |
|
Phased Array type L-band Synthetic Aperture Radar (PALSAR) (Fig. 1) Advanced Visible and Near Infrared Radiometer-2 (AVNIR-2) (Fig. 2 and 3) |
|
| Date: |
About 01:11 (UTC) on January 4, 2009 (Fig. 1, Left) About 01:01 (UTC) on January 11, 2009 (Fig. 1, Right) About 02:08 (UTC) on August 6, 2010 (Fig. 2) About 01:48 (UTC) on September 2, 2010 (Fig. 3) |
| Ground resolution: | 100 m (PALSAR Scan SAR Mode) and 10 m (AVNIR-2) |
| Map Projection: | Universal Transversal Mercator (UTM) |
AVNIR-2 has four observation bands. The color composite images (Fig. 2 and 3) are usually produced by assigning red to Band 3 (610 to 690 nm), green to Band 2 (520 to 600 nm), and blue to Band 1 (420 to 500 nm). The resulting images have natural coloring, as if seen by the naked eye. Thus, each color indicates the following objects: Color Legend
| Blue or Bluish-green: | Water surfaces |
| Grey: | Urban areas |
| Dark Green: | Forests |
| Green: | Grass fields |
| White: | Buildings, seashore or clouds |
PRISM is an optical sensor for observing ground surfaces with visible and near-infrared signals in the 520- to 770-nanometer (one-billionth of a meter) band. The image is monochromatic but has a higher resolution. PRISM has three independent optical systems for acquiring images in the view of nadir, forward, and backward simultaneously. Only the nadir images are used in figures.
The AVNIR-2 color composite image assigning red to Band 3 (610 to 690 nm), green to Band 2 (520 to 600 nm), and blue to Band 1 (420 to 500 nm) is decomposed into hue, saturation, and intensity. The intensity portion is replaced by PRISM data. The hue, saturation, and intensity, data are then reversed into a color image. This color image has a virtual 2.5-m resolution. Figures 2 and 3, composed by combining higher resolution monochromatic images and a lower resolution color images, are called pan-sharpened images.
Search by Year
Search by Categories


Tags
-
#Earthquake
-
#Land
-
#Satellite Data
-
#Aerosol
-
#Public Health
-
#GCOM-C
-
#Sea
-
#Atmosphere
-
#Ice
-
#Today's Earth
-
#Flood
-
#Water Cycle
-
#AW3D
-
#G-Portal
-
#EarthCARE
-
#Volcano
-
#Agriculture
-
#Himawari
-
#GHG
-
#GPM
-
#GOSAT
-
#Simulation
-
#GCOM-W
-
#Drought
-
#Fire
-
#Forest
-
#Cooperation
-
#Precipitation
-
#Typhoon
-
#DPR
-
#NEXRA
-
#ALOS
-
#GSMaP
-
#Climate Change
-
#Carbon Cycle
-
#API
-
#Humanities Sociology
-
#AMSR
-
#Land Use Land Cover
-
#Environmental issues
-
#Quick Report
-
#GOSAT-GW
Related Resources


Related Tags
Applications Related Articles
-
 Applications 2024.01.15 Mon The Use of Earth Observation Satellite Data in the Humanities and Social Sciences (2)
 -
 Applications 2023.11.29 Wed The Use of Earth Observation Satellite Data in the Humanities and Social Sciences (1)
 -
 Applications 2023.08.04 Fri Contribution to SDGs Goal 6 “Clean Water and Sanitation”
 -
 Applications 2023.07.10 Mon Contribution to SDGs Goal 15 “Life on Land”
Stay Connected
