


Applications
2013.01.28 Mon
Climate Change and Forest – Decreasing Forest Resources and Illegal Logging –
The 18th session of the Conference of the Parties to the United Nations Framework Convention on Climate Change (UNFCCC/COP18) was held from November 26 to December 8, 2012, with the term extended for one day, in Doha, the capital city of Qatar. In 2012, at the end of the first commitment period of the Kyoto Protocol, 2008~2012, discussions had taken place on the commencement of the second commitment period, the construction of new framework after 2020, and the technical cooperation and grant aid from advanced to developing countries under Green Climate Fund management.
Land use and land-cover change are among the issues of concern as climate change forcing factors, the result of anthropogenic causes. The program Reducing Emission from Deforestation and Forest Degradation (REDD) plays a critical role in developing countries with at-risk forest land. The focus of REDD+ is to increase the carbon fixation, or stockpile, by strengthening conservation and sustainable maintenance of forest resources with carbon sink potential. The most appropriate choice by which to record and track this data is the use of Earth observation satellites. Forests cover approximately 30% (3,900 million hectare) of the global land surface, and its type is determined by regional climate factors, including temperature, precipitation and geography, and soil. Its ecosystem is composed of an abundance of trees and bushes, floor plants, animals, insects, and fungus, among other items. Climate change strongly influences forests. However, because forests play an important role in the terrestrial carbon cycle, climate also participates within the changing structure of the mutually interactive relationship.
With the first launch of the Landsat series of satellites in 1972, this project provides continuously archived observation data for users, up to the project’s 40-year anniversary in 2012. Landsat is capable of continuous global and systematic periodical observation, which makes it possible to map vast areas and to monitor changes in forest cover by using cloud-free, color-composite mosaic images of the qualitative and quantitative conditions of forests and surrounding areas.
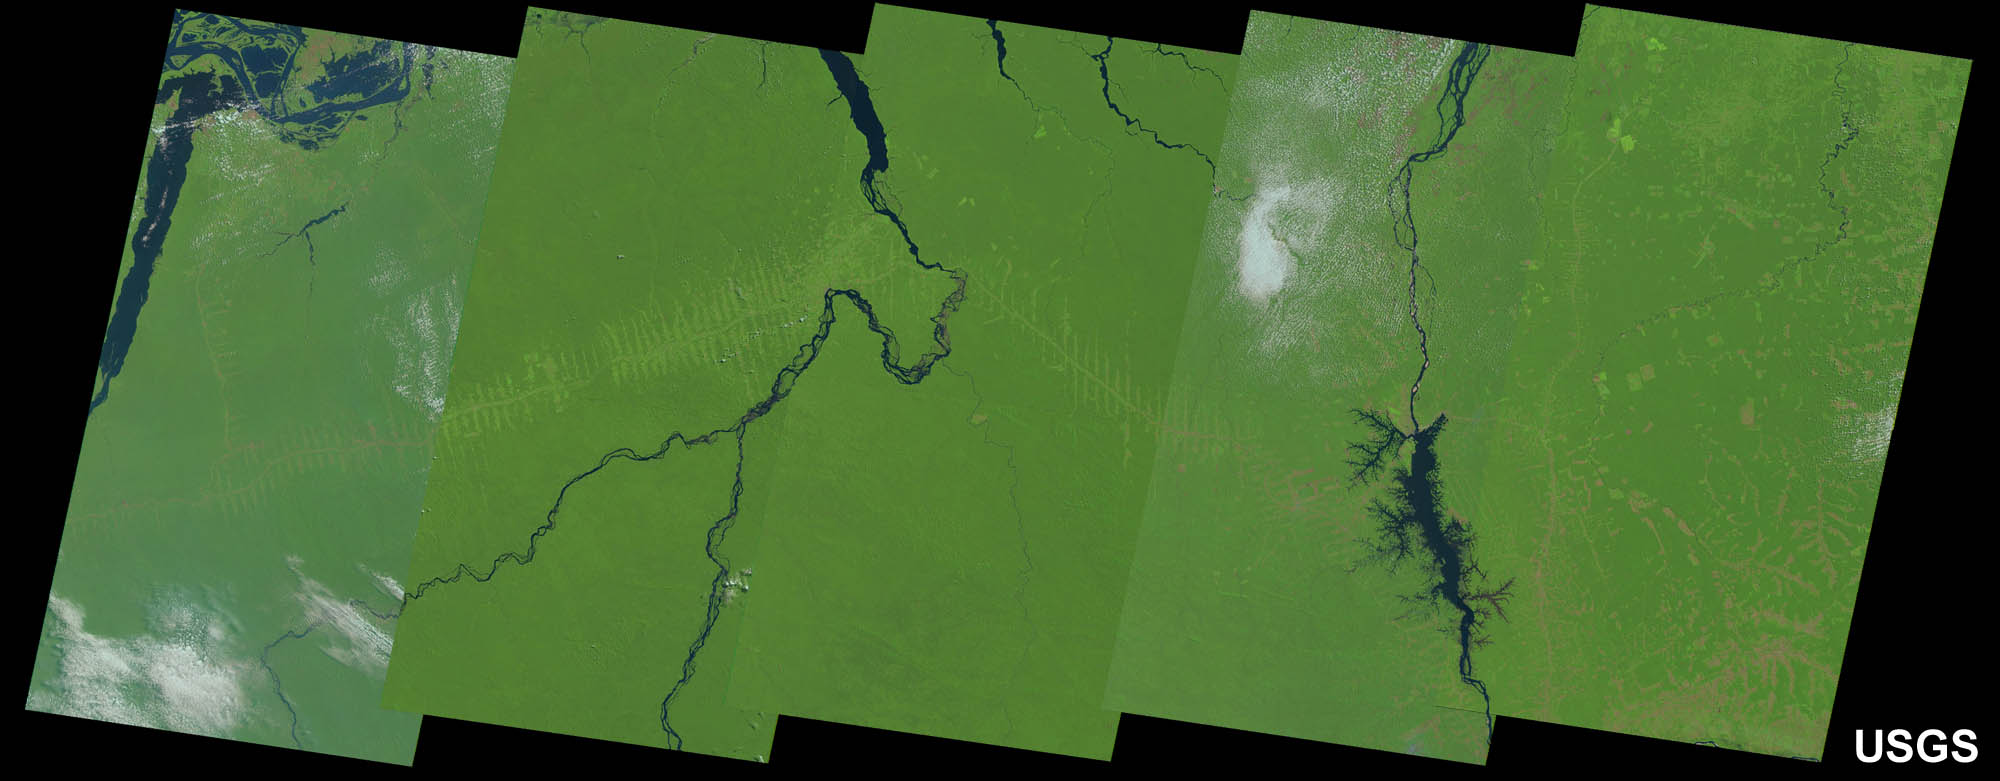
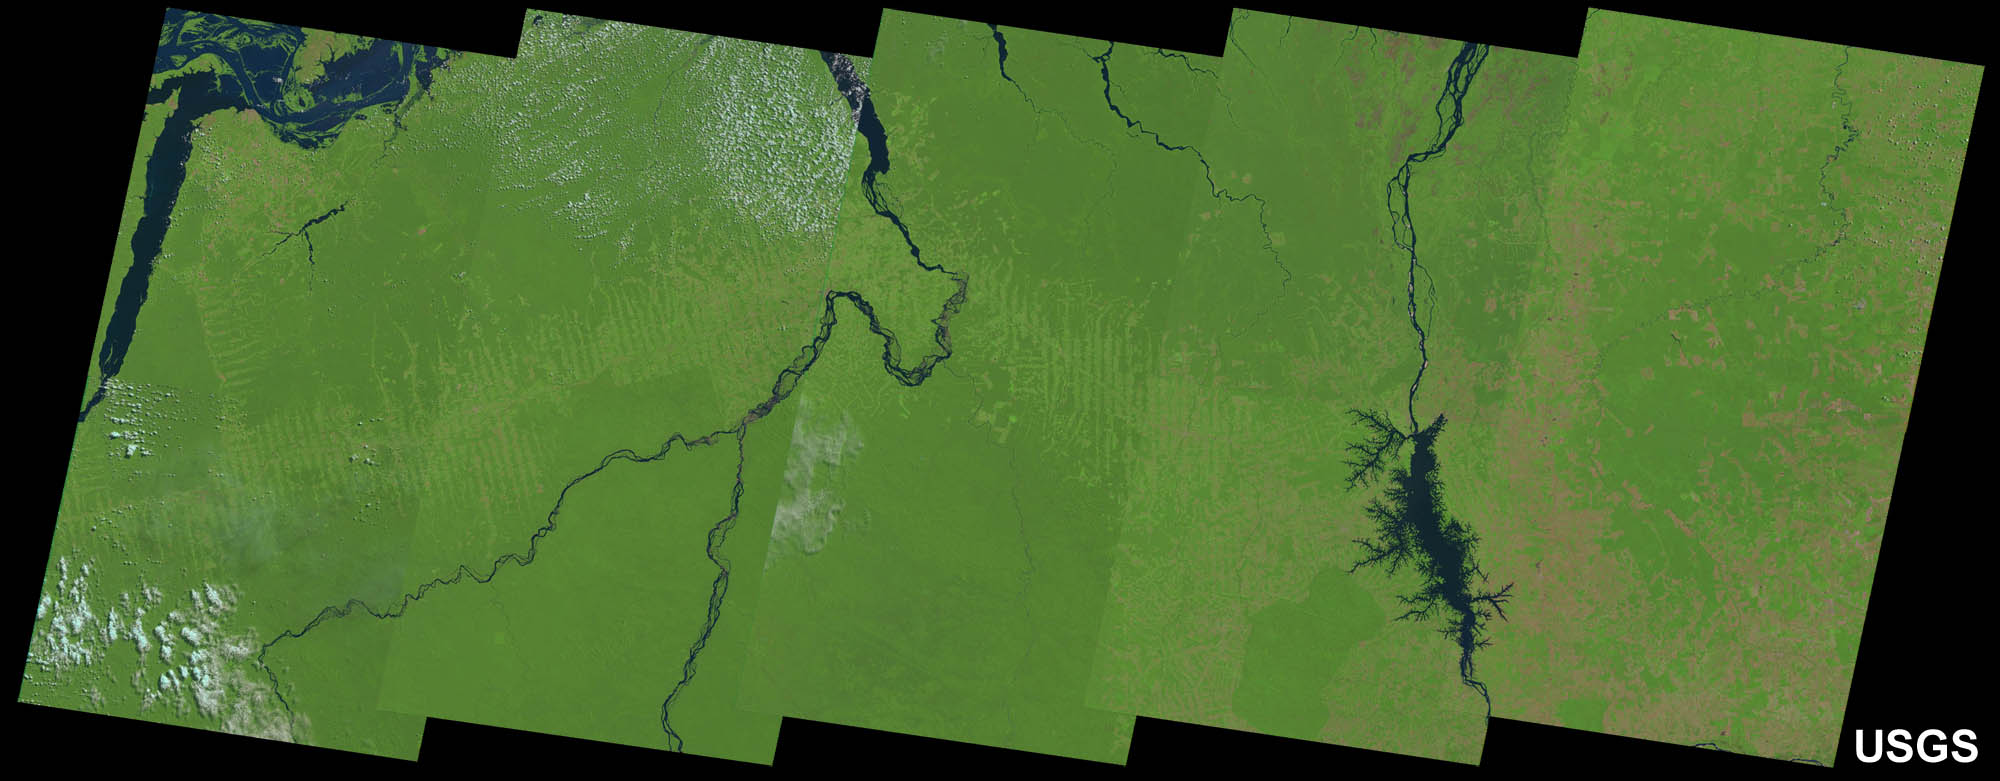
Fig. 1. Landsat images capturing deforestation in the Amazon rainforest
Upper image: 1980s; Lower panel: 2000s
The Japanese Earth Resources Satellite (JERS-1), which was launched in 1992, is equipped with two sensors -optical (OPS) and L-band synthetic aperture radar (SAR)- that were developed in and operated from Japan. L-band SAR transmits radar signal with wavelength of 23.6 cm, which can penetrate tree leaves and branches, and retunes to the SAR receiver after double-bounce scattering on the trunks. The ground surface then returns the back-scattering wave to include information about the cross section of tree trunks for the estimation of forest biomass.
Since 1990, research on the relationship between forest biomass and the radar back-scattering coefficient for the Amazon and other areas has shown the effective sensitivity of this biomass measurement to be 100~200 tons/ha. An ongoing challenge for the Forest Carbon Tracking (FCT) project of the Group on Earth Observations (GEO) is that one of the fundamental data points, forest/non-forest classification, is required to quantify the relationship. Next, the quantitative estimation of higher forest biomass (more than 200 tons/ha) must be solved.
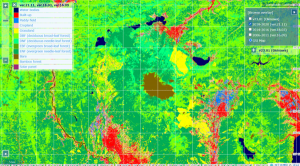
Phased array-type L-band synthetic aperture radar (PALSAR) image data agrees well in both radiometric and geometric accuracy; thus, a global mosaic image was successfully produced. The Japan Aerospace Exploration Agency (JAXA) has produced global mosaic images within spatial resolutions of 10 m, 25 m, and 50 m by using observed data from the years 1995, 2007, 2008, 2009, and 2010. By using these images, the evaluation of the accuracy of forest/non-forest classification is ongoing, as shown in the 10 m resolution image obtained in 2009 (Fig. 2).
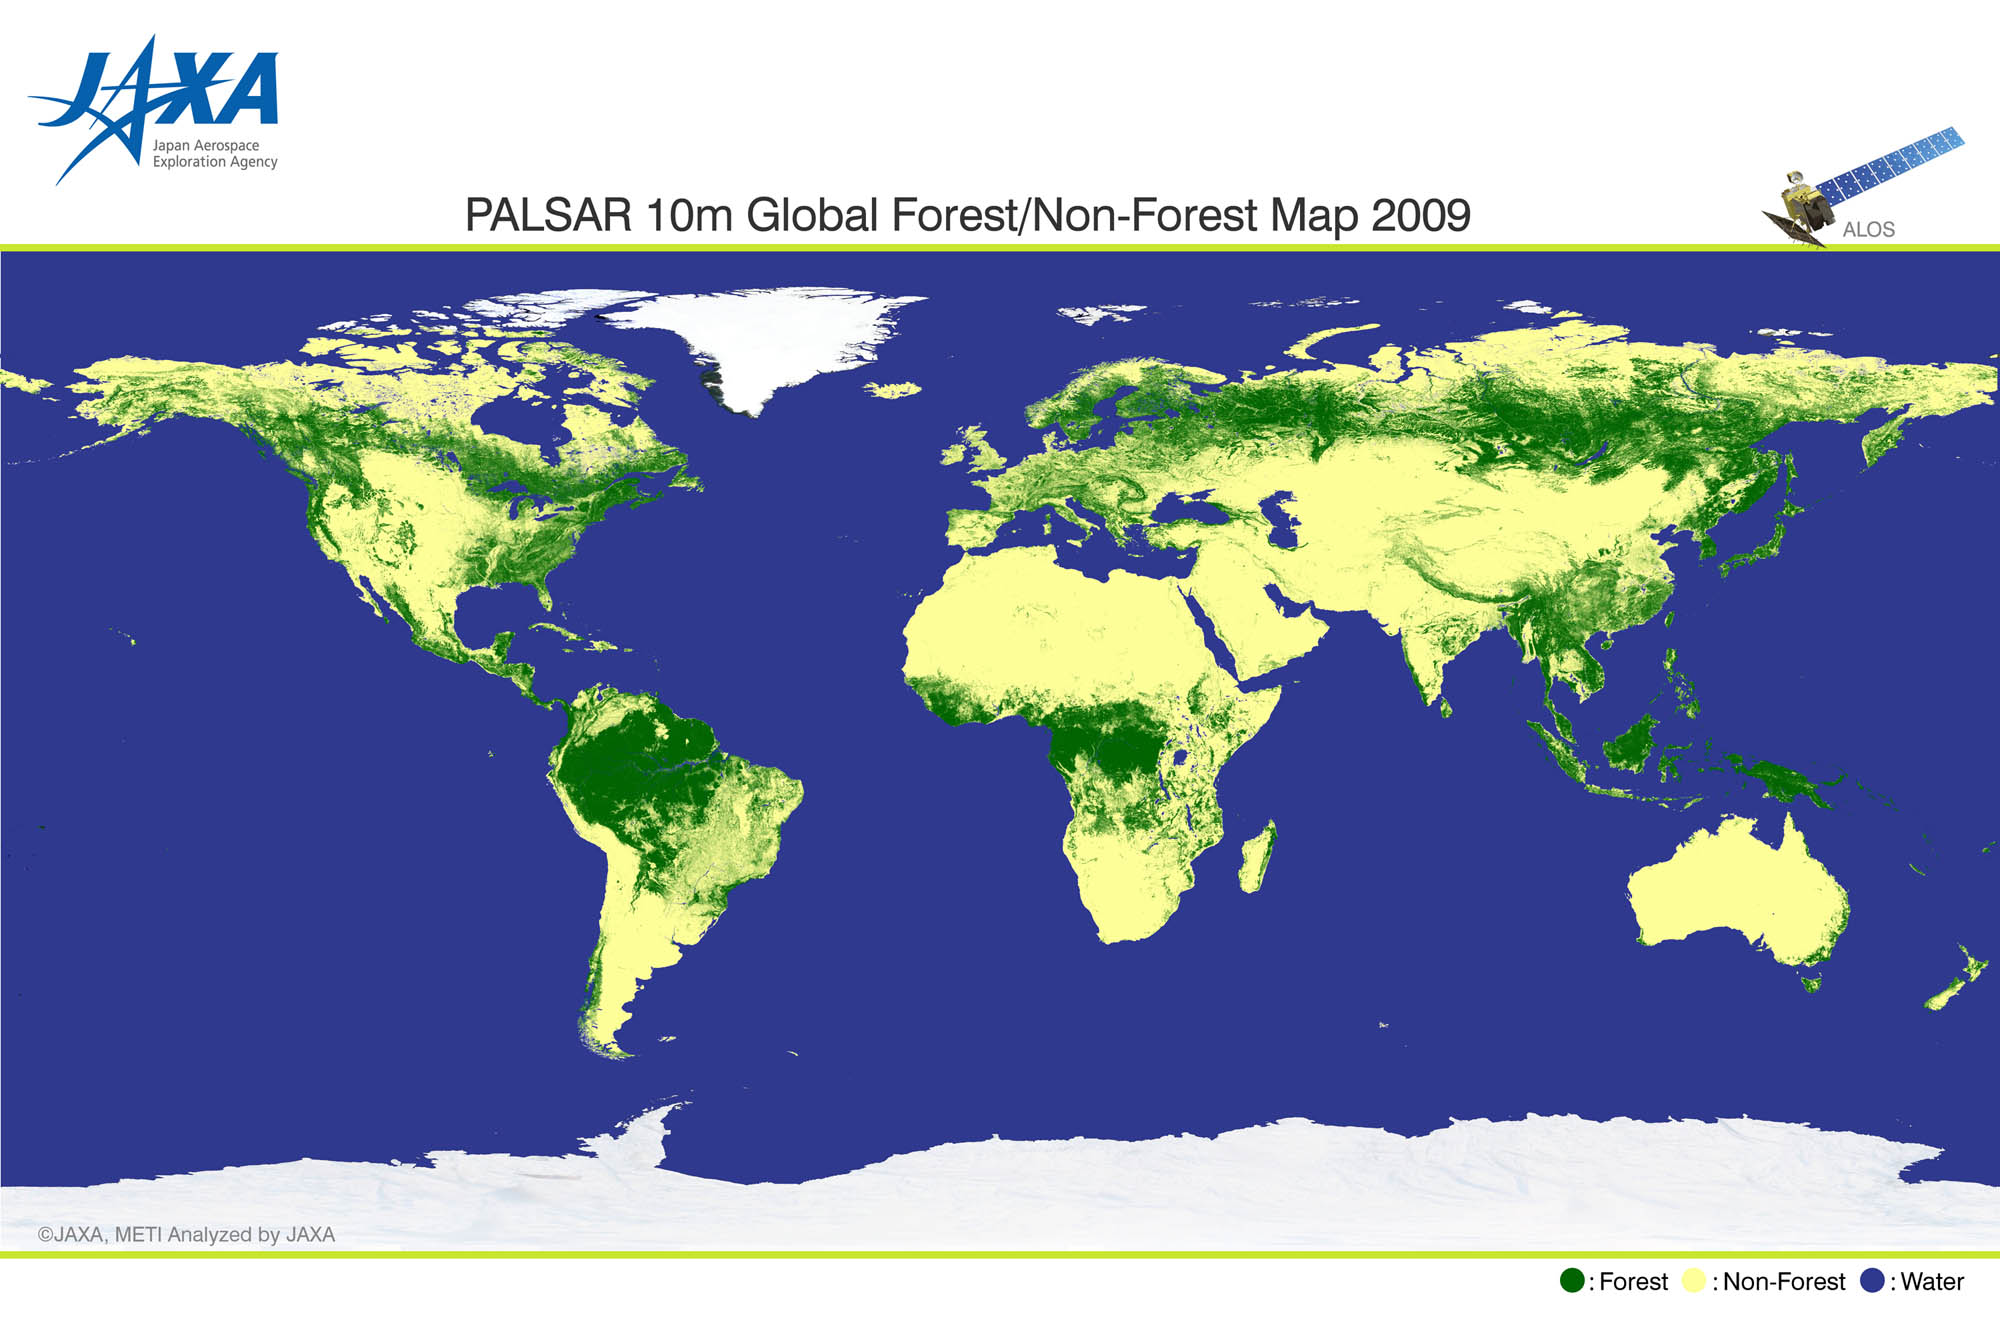
Fig. 2. Forest/non-forest classification map in 2009 (Ref. 1)
The actual lifespan of JERS-1 was six years and eight months during the period from February 1992 to October 1998, which is longer than that of the designed lifespan, and the archived data is available for users. Furthermore, an Advanced Land Observation Satellite (ALOS) was operated for five years and three months during the period January 2006 to April 2011, and the data archive is available.
It is known that Amazon Forest logging has been curbed through the use of Earth observation satellite surveillance data from Landsat, JERS-1, and SAR, among others. Since 2004, the National Institute for Space Research (INPE) had been providing information to the Brazilian Institute of Environment and Renewable Natural Resources (IBAMA) for the regulation of illegal forest logging in the Amazon by using satellite-borne optical sensor data. However, for approximately five months during the rainy season, they have been hampered by a lack of updated information concerning forest logging detection.
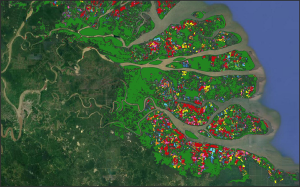
Based on an agreement between JAXA and IBAMA involving the use of ALOS PALSAR data uploaded to the JAXA data server, the formation of the Japan International Cooperation Agency (JICA), a technical cooperative between IBAMA and the Federal Police Department (DPF), demonstrated the effectiveness of illegal logging detection to aid aiding forest conservation *2 (Fig. 3).
Because of the high geographic and radiometric accuracy of ALOS PALSAR, it was relatively simple to determine of the precise location of logging activity. Whereas ALOS-2 awaits launch, the new function and performance of the wide swath width and dual-polarization observation modes of ALOS-2/PALSAR-2 is widely used to document areas of illegal forest logging.
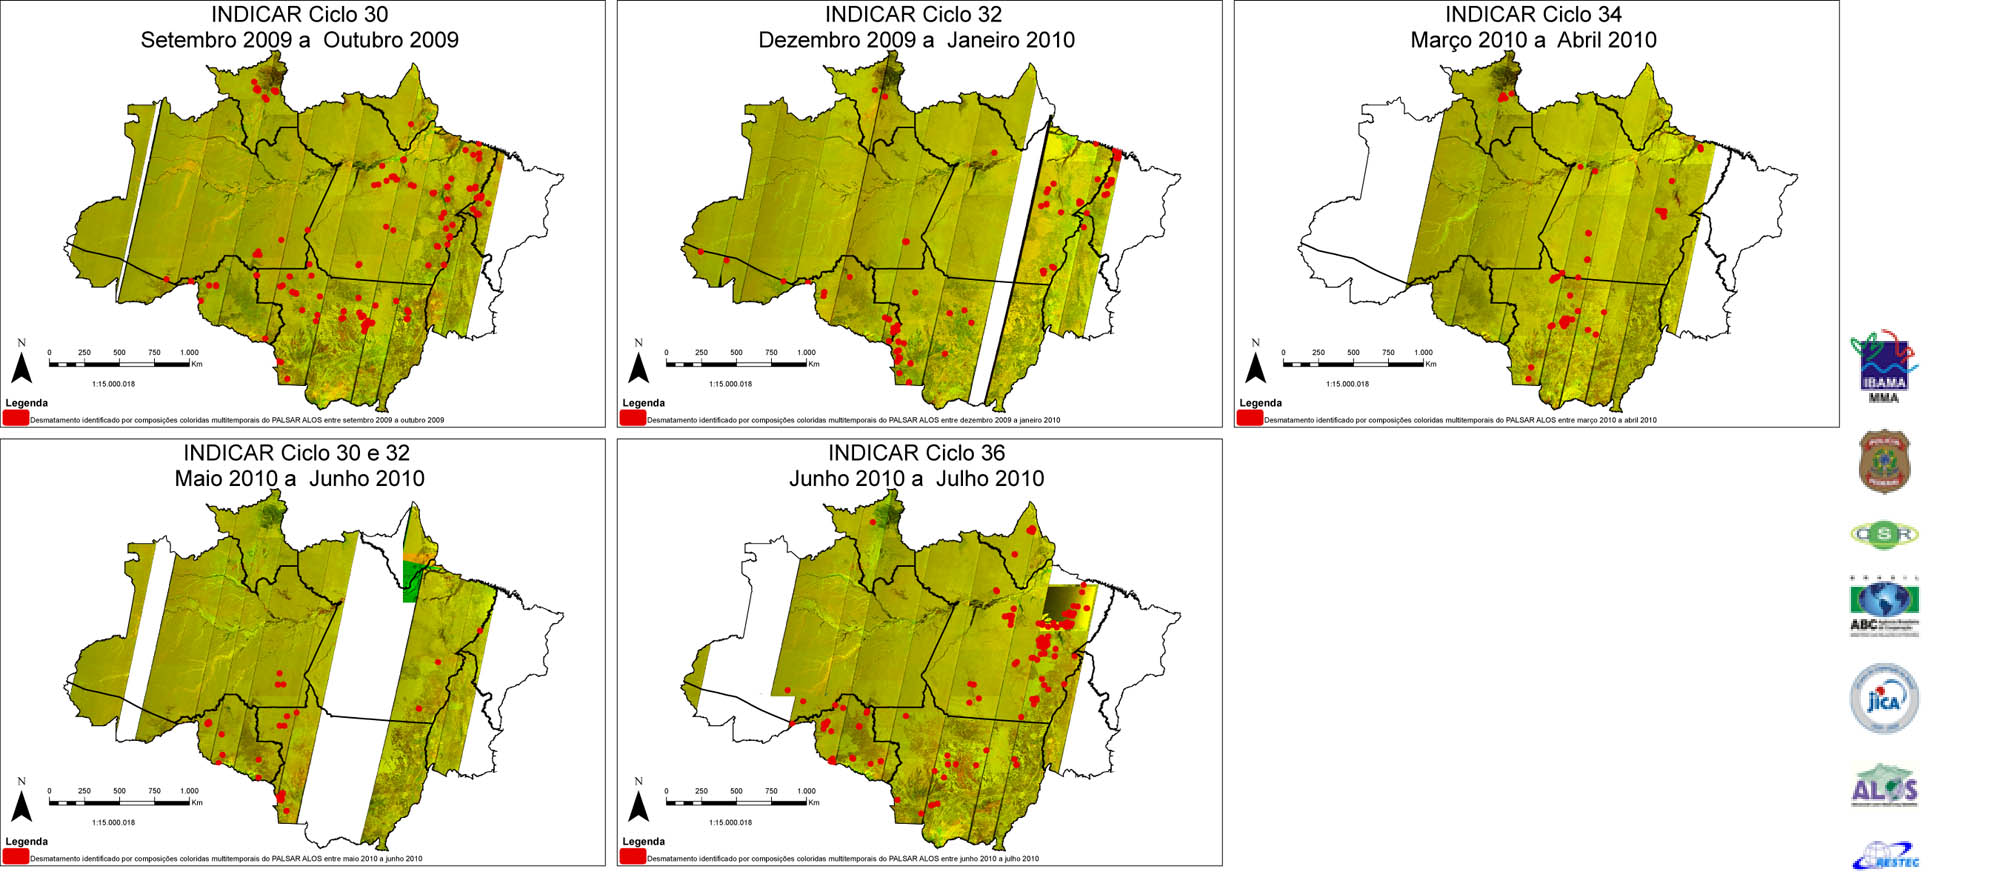
Fig. 3. Results of forest logging in the Amazon rainforest, Brazil (Ref. 2).
Forest-based carbon fixation estimation methods include the use of regional or national statistical data, remote-sensing data analysis, and transportation and biological models. More widespread accessibility of Earth observation satellite data has led to improvements in how remote sensing information is obtained for information such as forest-cover distribution, above-ground biomass, and species type.
Such observation methods can contribute to the improvement and documentation of forest-based and widespread carbon fixation, which can help to mitigate the effects of global warming by maintaining the sustainability of forest resources. Additionally, routine governmental use of satellite data has led to increased regulation and serves as a greater deterrent to illegal forest logging in Brazil, which demonstrates the potential benefits of satellite data as a useful tool for social infrastructure.
In accordance with forthcoming guidelines from the Intergovernmental Panel on Climate Change (IPCC), the UNFCCC will request reports on greenhouse gas absorption and emission data from each participating nation. This international cooperation is vital in the ongoing examination and improvement of satellite data applications, in addition to practical planning by which to adapt to changing research requirements.
Because of the importance of satellite data in the ongoing struggle against the effects of global warming, greater cooperation is needed between governmental and scientific communities to meet the challenges that lie ahead.
Footnotes
*1 During the 16th session of the Conference of Parties (COP16), held from November 29 to December 10, 2010, in Cancún, Mexico, a plan was adopted to grant $100 billion in aid to developing countries by 2020, as part of the post-2013 framework; the Green Climate Fund was launched to manage the grant.
*2 On Nov. 28, 2012, according to National Institute for Space Research (INPE) data, the area of deforestation in the Amazon region during August 2011–July 2012 was 4,656㎢, which is a decrease of approximately 27%, compared with that of the previous year. It is the minimum record in the period since the beginning of investigation in 1988, and the record breaks have continued for 4 years. The investigation area shown in Fig. 3 includes forest region covering nine states in northern Brazil and includes approximately 60% of the Amazon rainforest, which is the world’s largest. The area lost to deforestation documented by the INPE data, caused mainly due to logging, was approximately 16% from that of the Amazon’s maximum acreage of 1994~95. Armed with this most recent advanced data analysis from Earth observation satellites, the Brazilian government continues its battle against illegal logging.
Reference sites
| (Ref.1) | Masanobu Shimada, Global forest monitoring using the Atmosphere and Land Observation and Assessment/ Phased array type L-band synthetic aperture radar (ALOA/PALSAR), The 38th Remote Sensing Symposium Proceedings, SICE, pp. 23–24, Nov. 2, 2012, Tokyo. |
| (Ref.2) | Makoto Ono, Prevention of illegal deforestation in Amazon Forest using the Atmosphere and Land Observation and Assessment/ phased array type L-band synthetic aperture radar (ALOA/PALSAR), 38th Remote Sensing Symposium Proceedings, SICE, pp. 25–26, Nov. 2, 2012, Tokyo. |
Explanation of the Images:
| Satellite: | Landsat-5 (U.S.) |
| Sensor: | Thematic Mapper (TM) |
| Date: | Aug. 30, 1986; June 23, 1987; July 15, 1986; July 27, 1987; and July 27, 1984 (UTC) (Fig.1 from left in upper panel) July 28, 2009; July 24, 2010; June 23, 2007; July 27, 2010; and August 17, 2009 (UTC) (Fig.1 from left in lower panel) |
| Ground resolution: | 30 m |
| Map Projection: | Universal Transversal Mercator (UTM) |
The image data in Figure 1 is downloaded free of charge from the U.S. Geological Survey’s (USGS) Global Visualization Viewer (GLOVIS).
| Satellite: | Advanced Land Observing Satellite (ALOS) (Daichi) |
| Sensor: | Phased Array type L-band Synthetic Aperture Radar (PALSAR) (Figs. 2, 3) |
| Date: | 2009 Mosaic Image(Fig. 2) September 2009~July 2010(Fig. 3) |
| Ground resolution: | 10 m |
| Map Projection: | Universal Transversal Mercator (UTM) |
Search by Year
Search by Categories


Tags
-
#Earthquake
-
#Land
-
#Satellite Data
-
#Aerosol
-
#Public Health
-
#GCOM-C
-
#Sea
-
#Atmosphere
-
#Ice
-
#Today's Earth
-
#Flood
-
#Water Cycle
-
#AW3D
-
#G-Portal
-
#EarthCARE
-
#Volcano
-
#Agriculture
-
#Himawari
-
#GHG
-
#GPM
-
#GOSAT
-
#Simulation
-
#GCOM-W
-
#Drought
-
#Fire
-
#Forest
-
#Cooperation
-
#Precipitation
-
#Typhoon
-
#DPR
-
#NEXRA
-
#ALOS
-
#GSMaP
-
#Climate Change
-
#Carbon Cycle
-
#API
-
#Humanities Sociology
-
#AMSR
-
#Land Use Land Cover
-
#Environmental issues
-
#Quick Report
-
#GOSAT-GW
Related Resources


Related Tags
Applications Related Articles
-
 Applications 2024.01.15 Mon The Use of Earth Observation Satellite Data in the Humanities and Social Sciences (2)
 -
 Applications 2023.11.29 Wed The Use of Earth Observation Satellite Data in the Humanities and Social Sciences (1)
 -
 Applications 2023.08.04 Fri Contribution to SDGs Goal 6 “Clean Water and Sanitation”
 -
 Applications 2023.07.10 Mon Contribution to SDGs Goal 15 “Life on Land”
Stay Connected
