


Applications
2012.12.27 Thu
Preservation of Biodiversity – Coral Reef of Ourawan Bay, Nago City, Okinawa –
2013 marked the 20th anniversary of the Earth Summit*1, in which global environmental concerns rose to the forefront and became a major issue. In this column, “Seen from Space,” biodiversity-related topics are introduced.
The 10th meeting of the Conference of the Parties (COP10) to the Convention on Biological Diversity (CBD) was held in Nagoya, Aichi Prefecture, and its significance was underscored by the adoption of the Nagoya Protocol. In October 2012, COP11 was held in Hyderabad, India, and included a report from the Ecologically and Biologically Significant Area (EBSA) regional workshop. This report was introduced for discussion among international organizations by which to empower countries to determine their own methods of conservation (Ref. 1). Biodiversity in oceanic and coastal zones are important issues for Japan; therefore, the EBSA workshop was conducted following the Marine Biodiversity Conservation Strategy of Japan by the Ministry of the Environment in March 2011 (Ref. 2, 3).
Because the availability of oceanic environmental information is significantly less than that of land, it is critical to take advantage of the opportunity provided by such data. The existence of wide-ranging oceanic environmental information; such as geophysical data of seabed topography, ocean currents, and distribution survey maps of the lives and habitats of ocean-dwelling organisms; makes it imperative to fully study the existing archived data sets acquired through past research and to comprehensively and expeditiously extract and verify such information.
Coral reefs, often called the rainforests of the sea because of the co-existence of such a rich abundance of species, exist in approximately 0.2% of the global ocean area, upon which approximately one-quarter of all marine life is dependent. Based on reef-building coral *2, an organism with photosynthetic ability, diverse benthic organisms and fish gather to create a unique ecosystem. Thus, the protection and preservation of coral reefs is seen as an important factor in nature.
In the tropical and sub-tropical zones near the equatorial regions of the Pacific, Atlantic, and Indian oceans, coral reefs are widely spread among warm ocean waters with sea temperatures of 25–29 °C near islands. Near Japan, coral reefs are observed near the southern Izu Islands and the northern Ogasawara Islands, with latitudes higher than 30° N, in the Pacific Ocean, where the warm Kuroshio Current flows, and up to the northern boundary near Genkainada, Iki, in the Japan Sea. Additionally, the majority of coral reefs are located in the south near the Amami and Okinawa regions.
Within coral reefs exists a diverse habitat, in which the high productivity of the coral ecosystem is supported by the mutualism weaved by the material cycle systems of reef-building coral and the symbiotic zooxanthellae; such coral ecosystems provide precious data concerning the history of climate change. Conversely, it is noted that there is a degradation of environmental habitats caused by anthropogenic stress due to land development, environmental stress resulting from recent global warming, and ocean acidification.
caption on
caption off
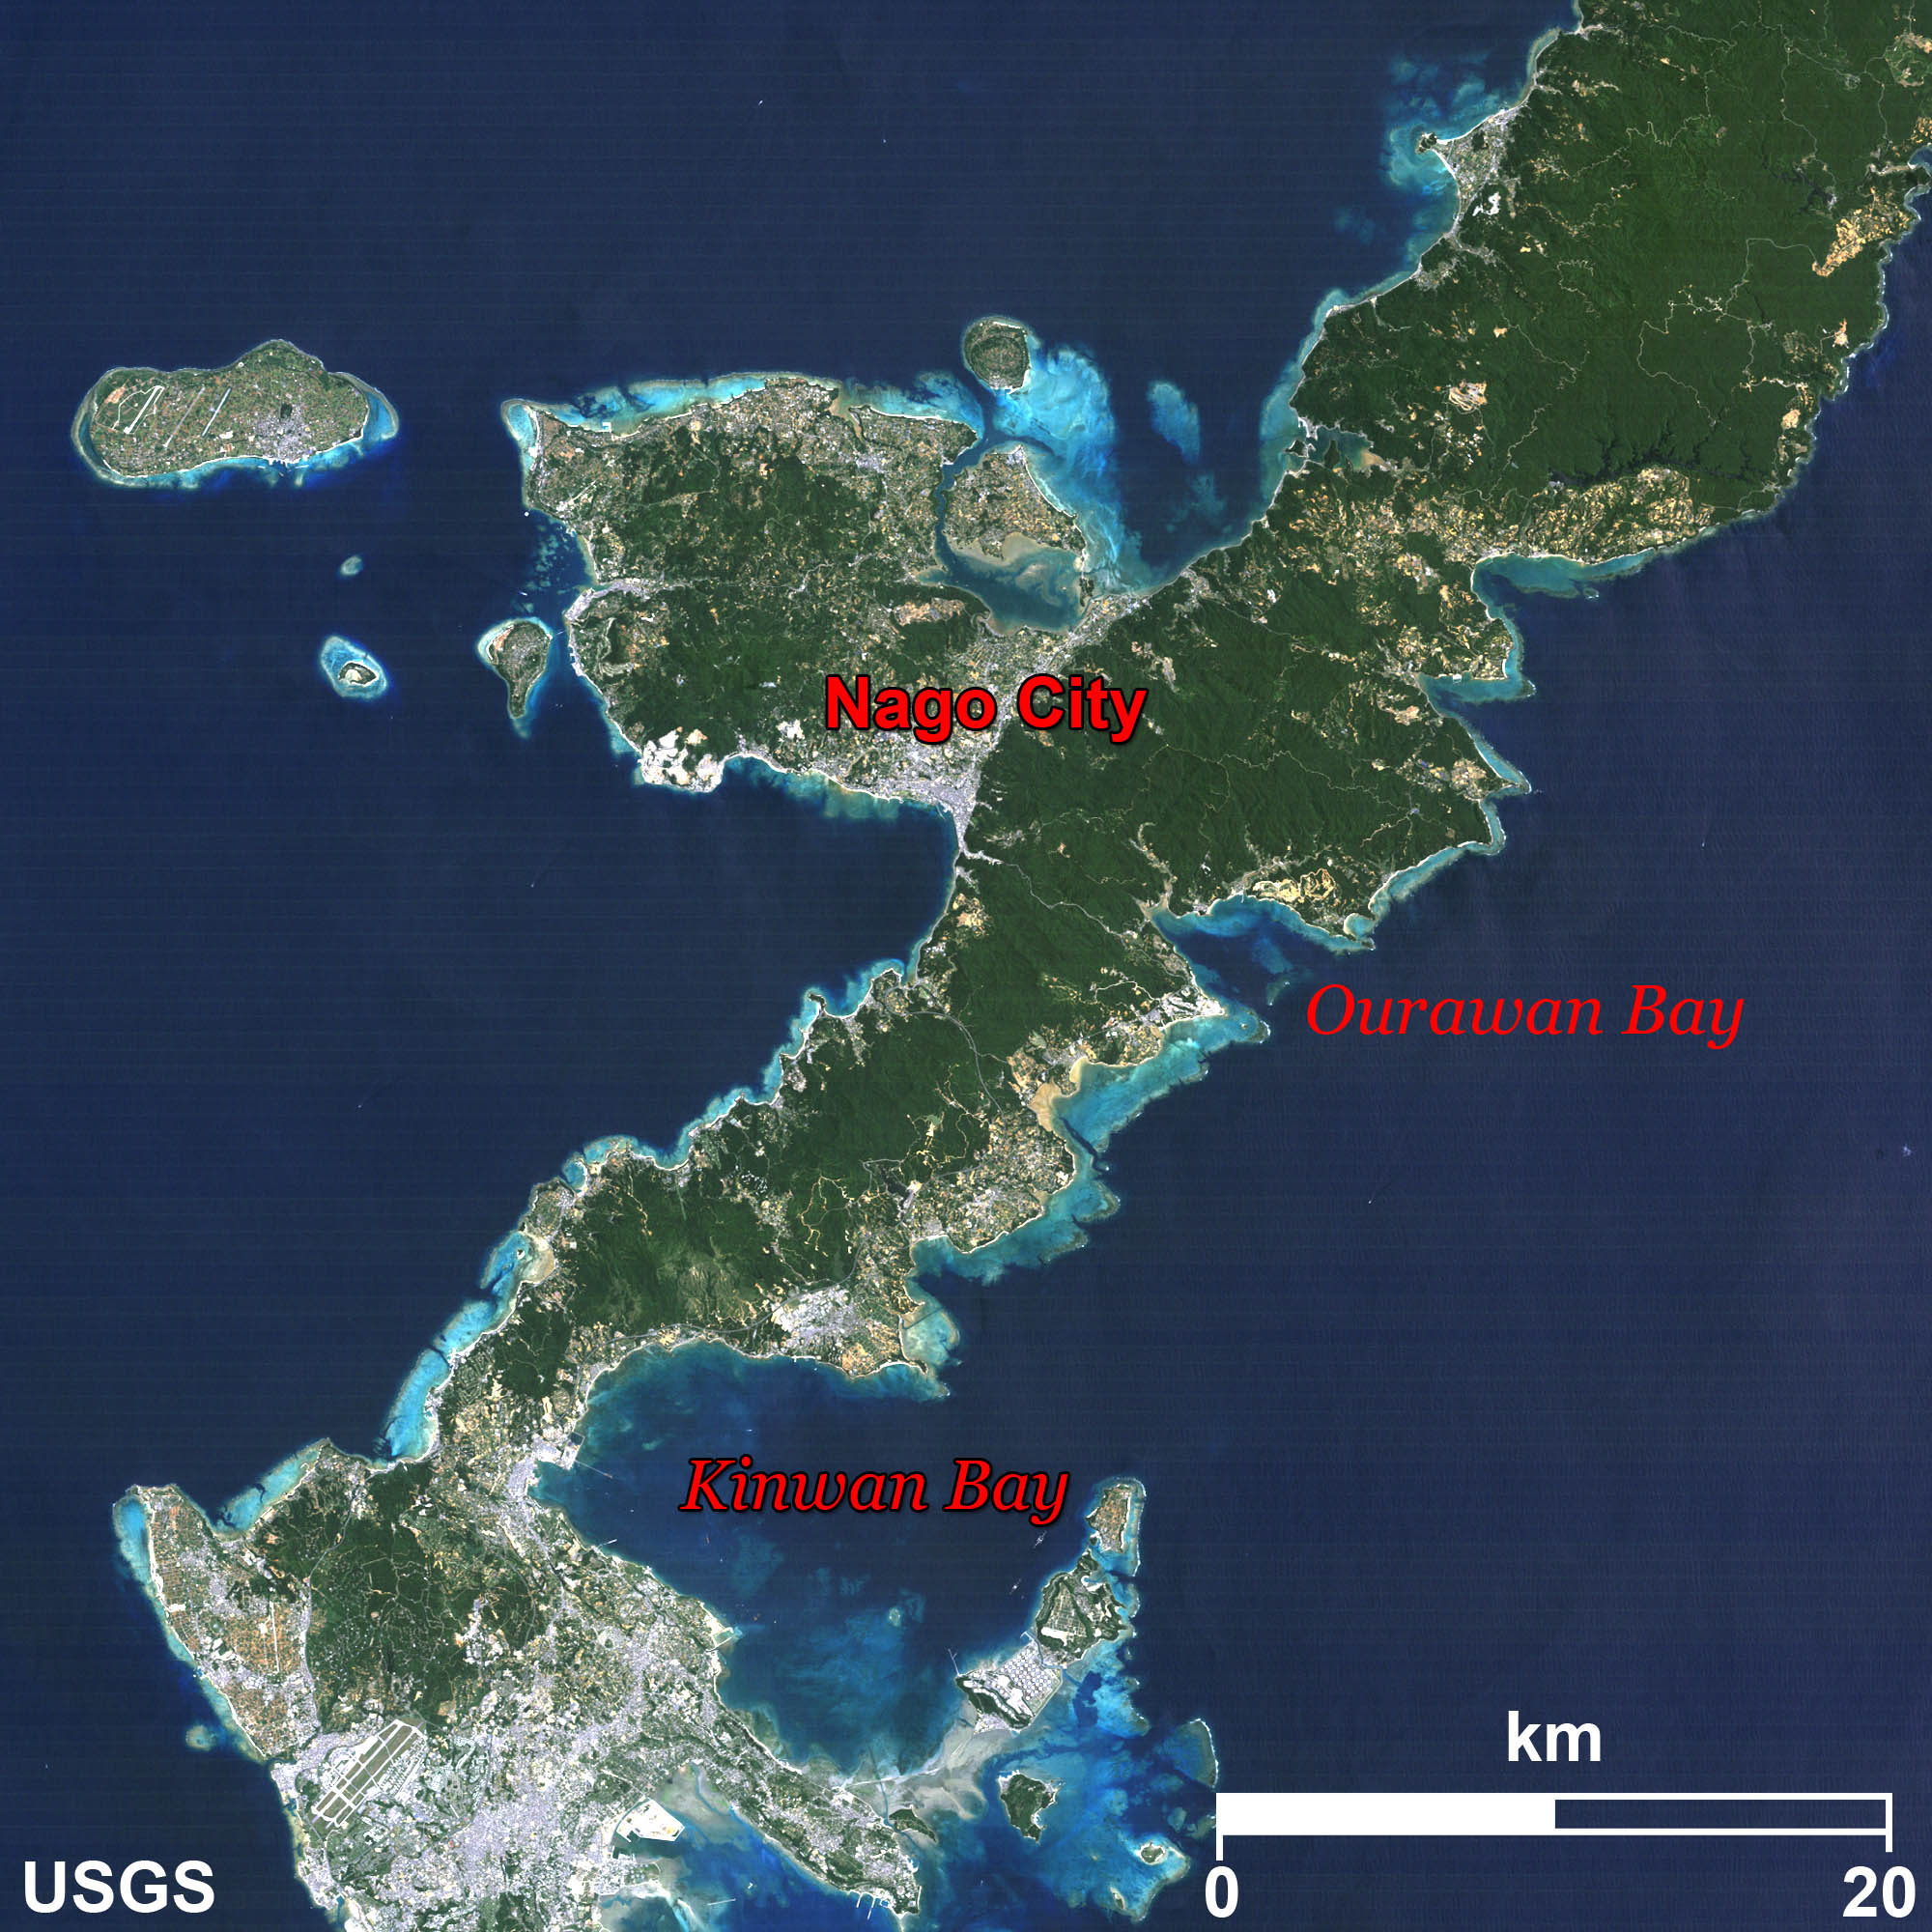
Fig. 1. The central region of Okinawa Island.
In May 1992, the main island of Okinawa observed by Landsat *3–5 is shown in Fig. 1. The blue area along the seashore appears to indicate an area of shallow water surrounded by coral reefs. In the view from space, in sunlight on a clear day, the long wavelength light in red tends to be absorbed first by ocean water. Conversely, the blue light in the deeper sea of more than 10 m in depth and its corresponding reflection can be observed. Therefore, in a coral reef area, color tone changes slightly from emerald green, which can be seen under the seashore and shallow water area with white sands, to deep blue, depending on the depth.
The coral in Okinawa suffered from large-scale bleaching in 1998, in addition to that in the small-scale in Ourawan Bay in 2004 (Reference 4). Additionally, it is a matter of concern that the coastal zone is negatively affected by various complex factors such as (i) an explosive increase of the starfish species Acanthaster planci; (ii) other factors involving both the land and the sea, such as clay soil flowage and excessive nutrient inflow; and (iii) human development-related activities, such as fishing, tourism, and the associated diseases.

caption on
caption off
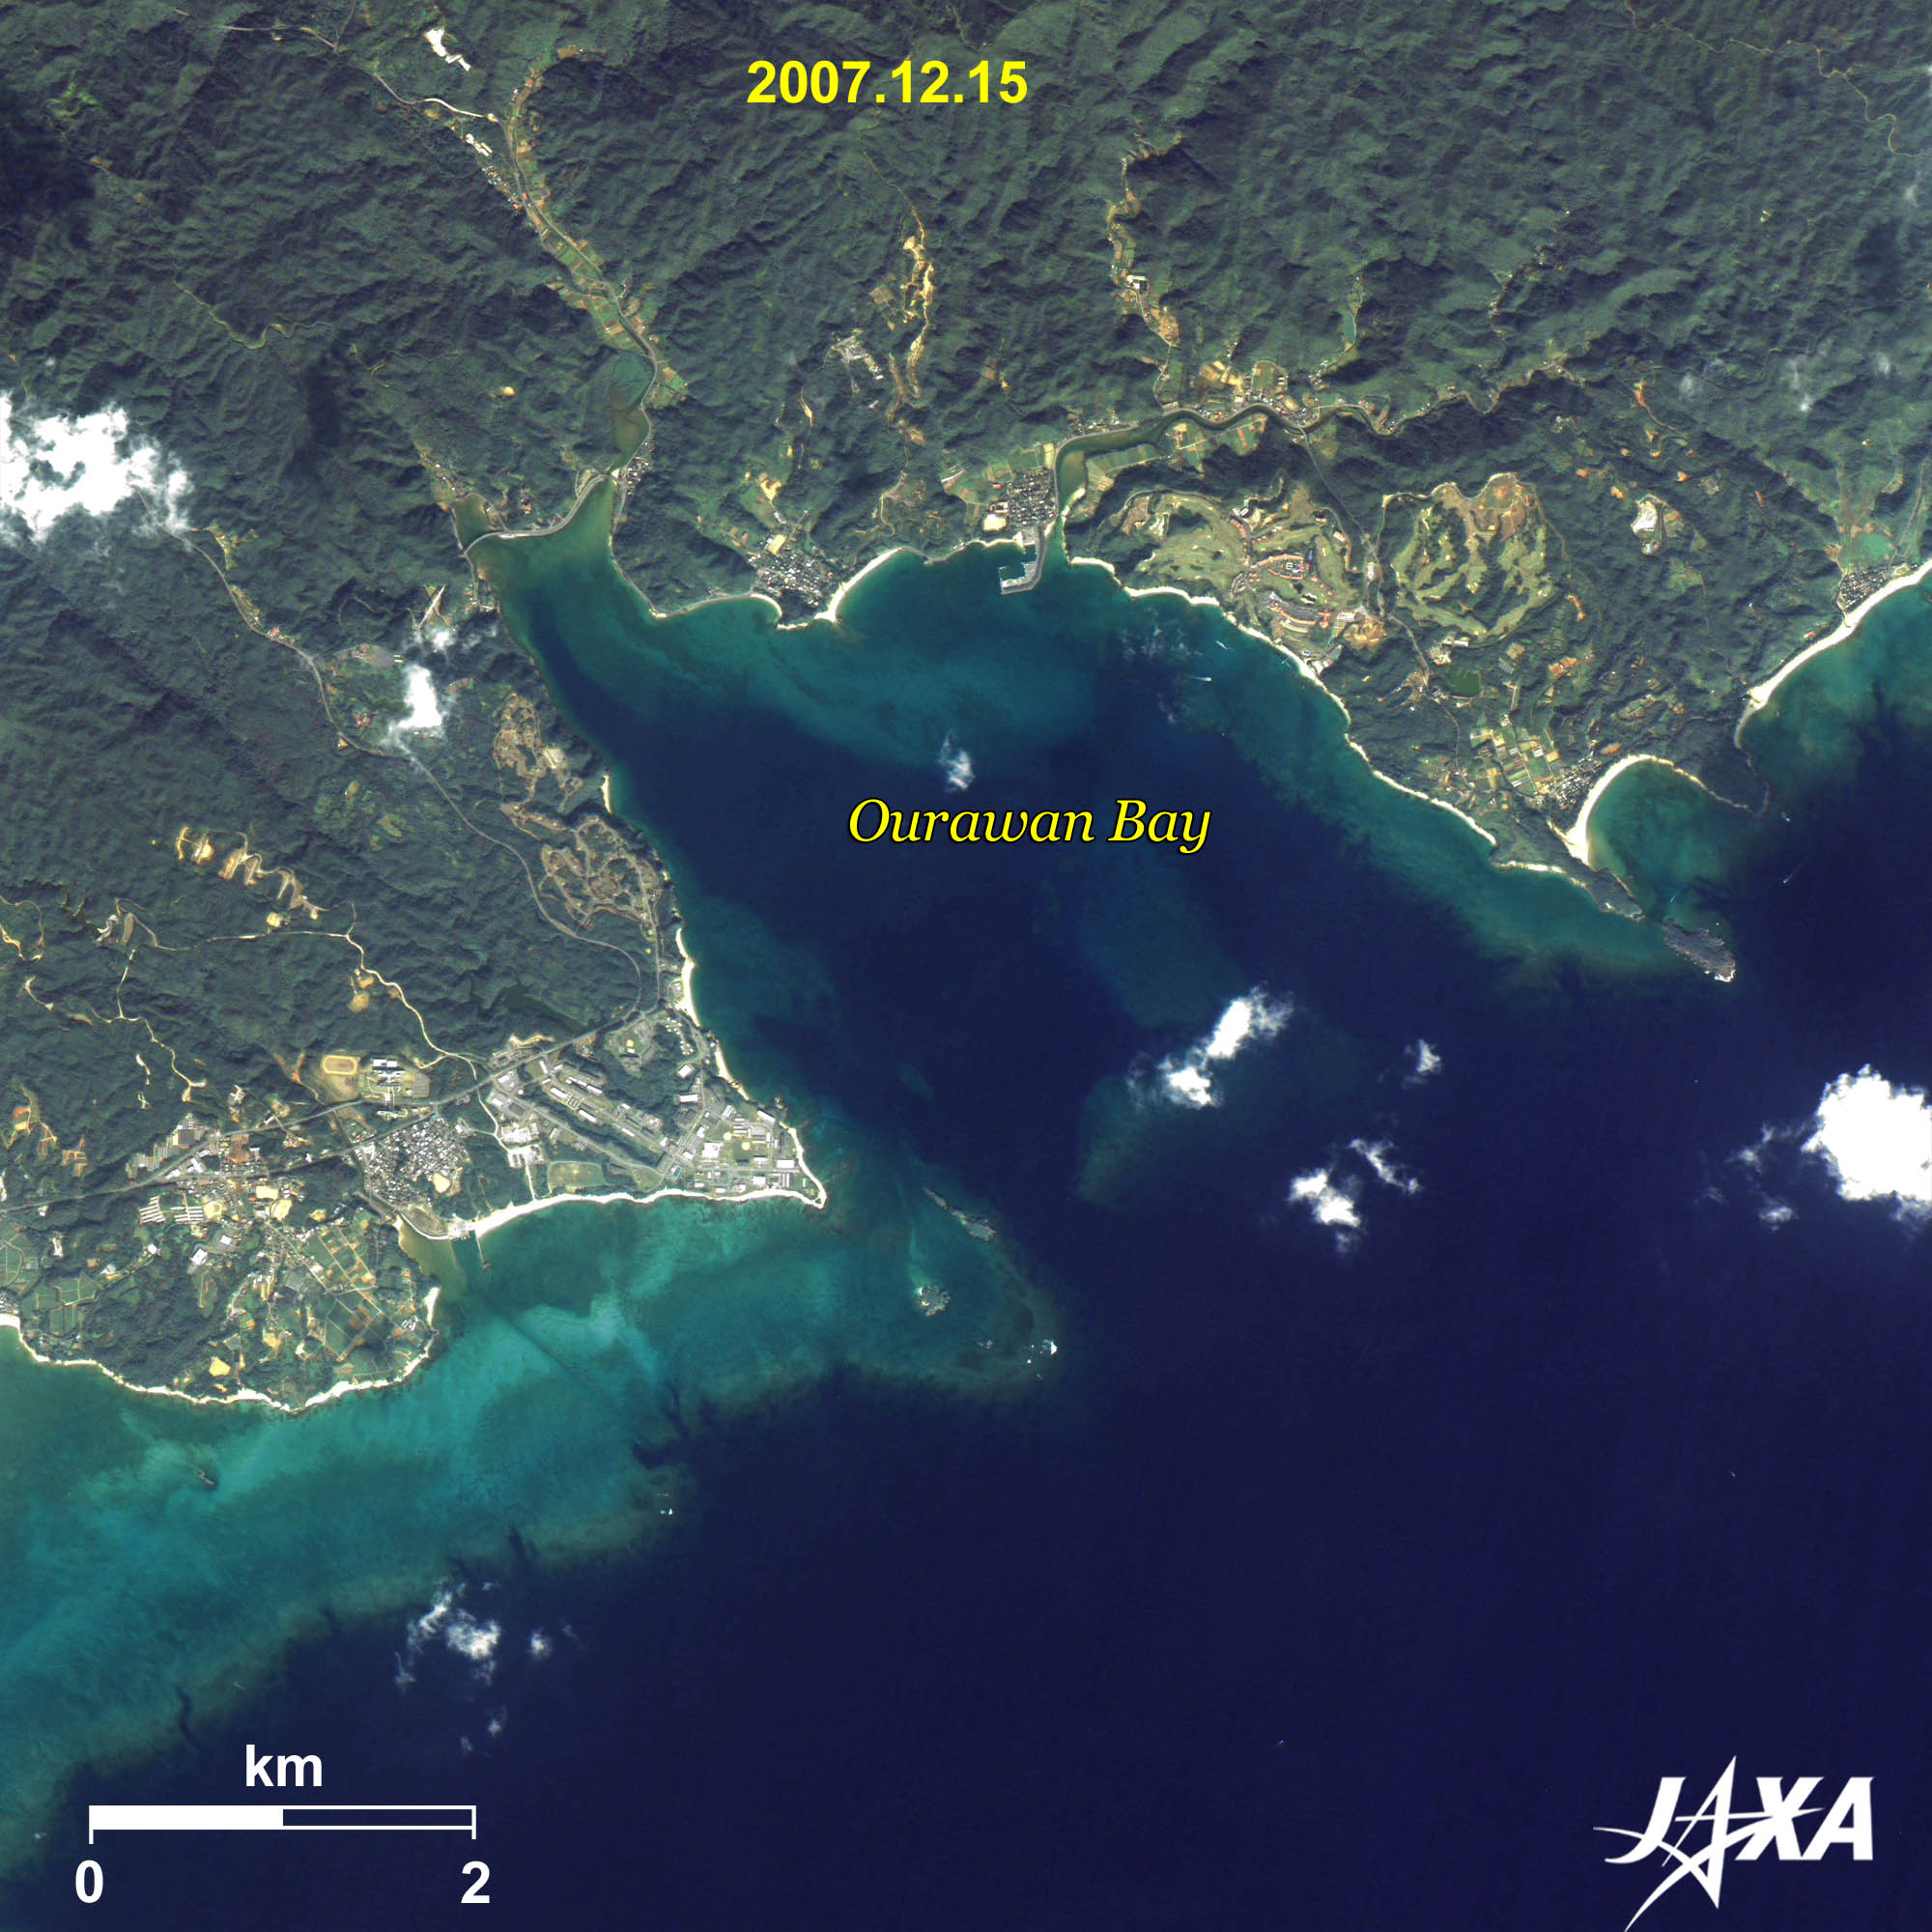
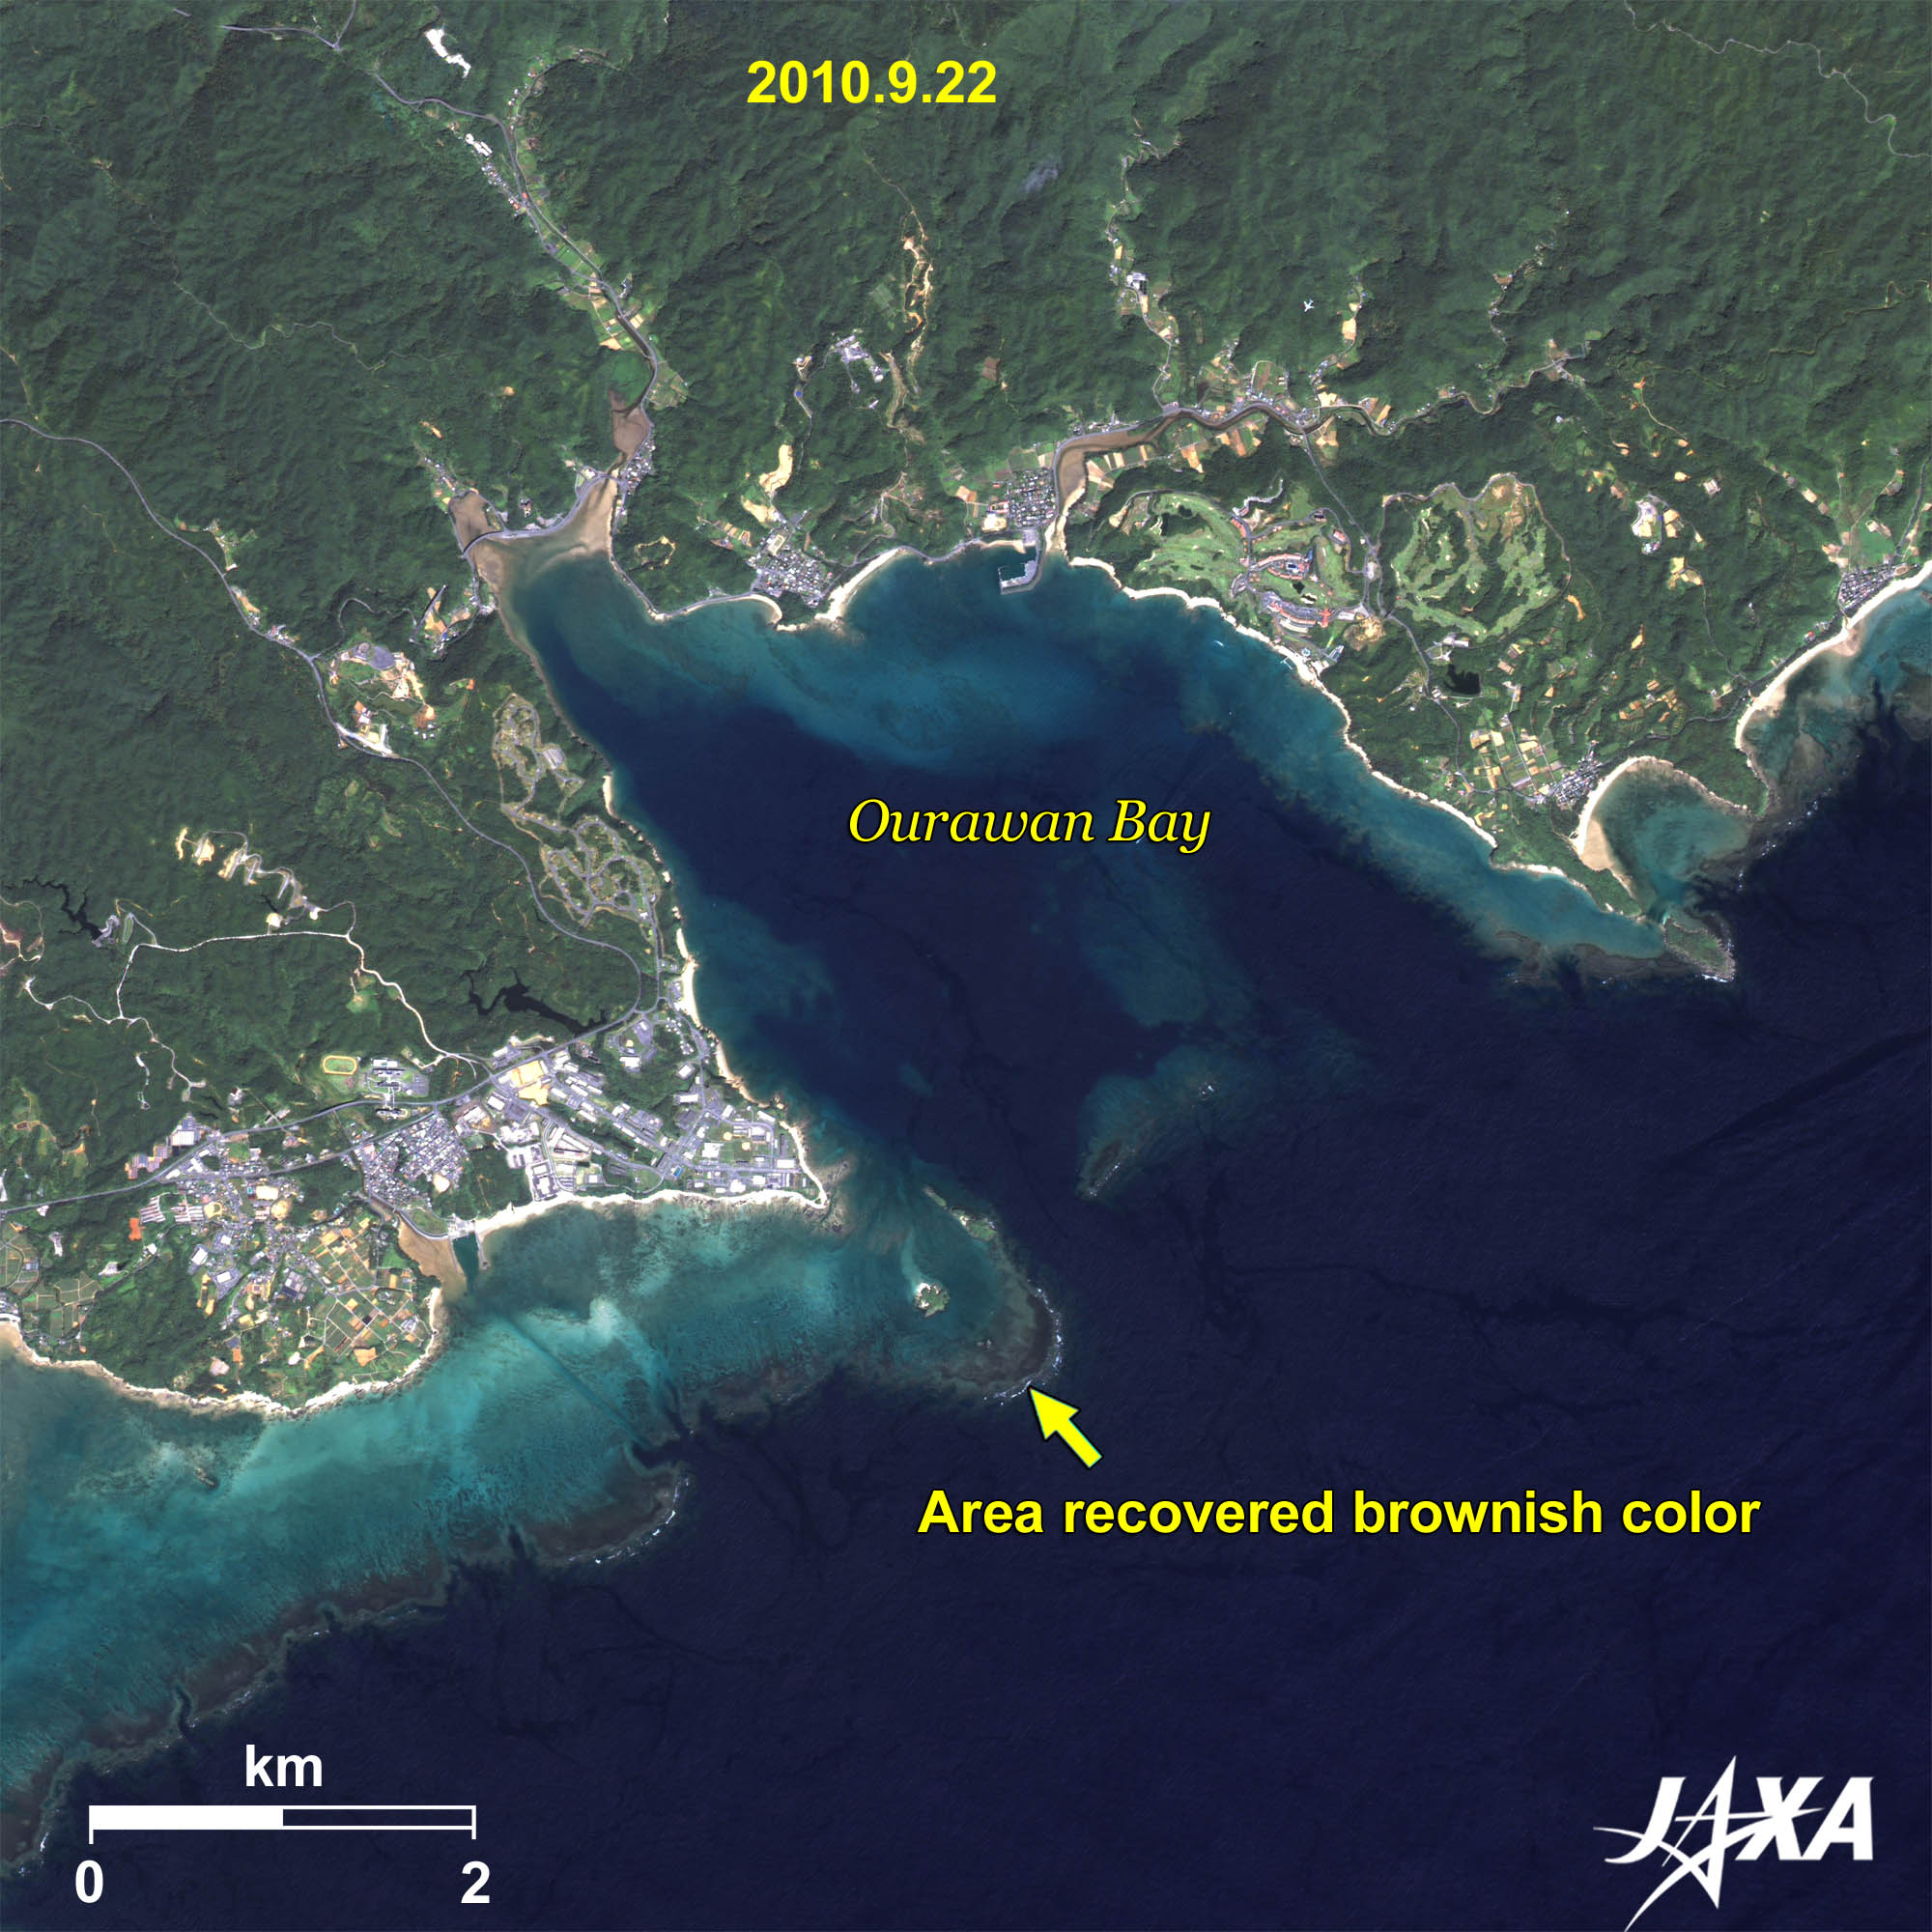
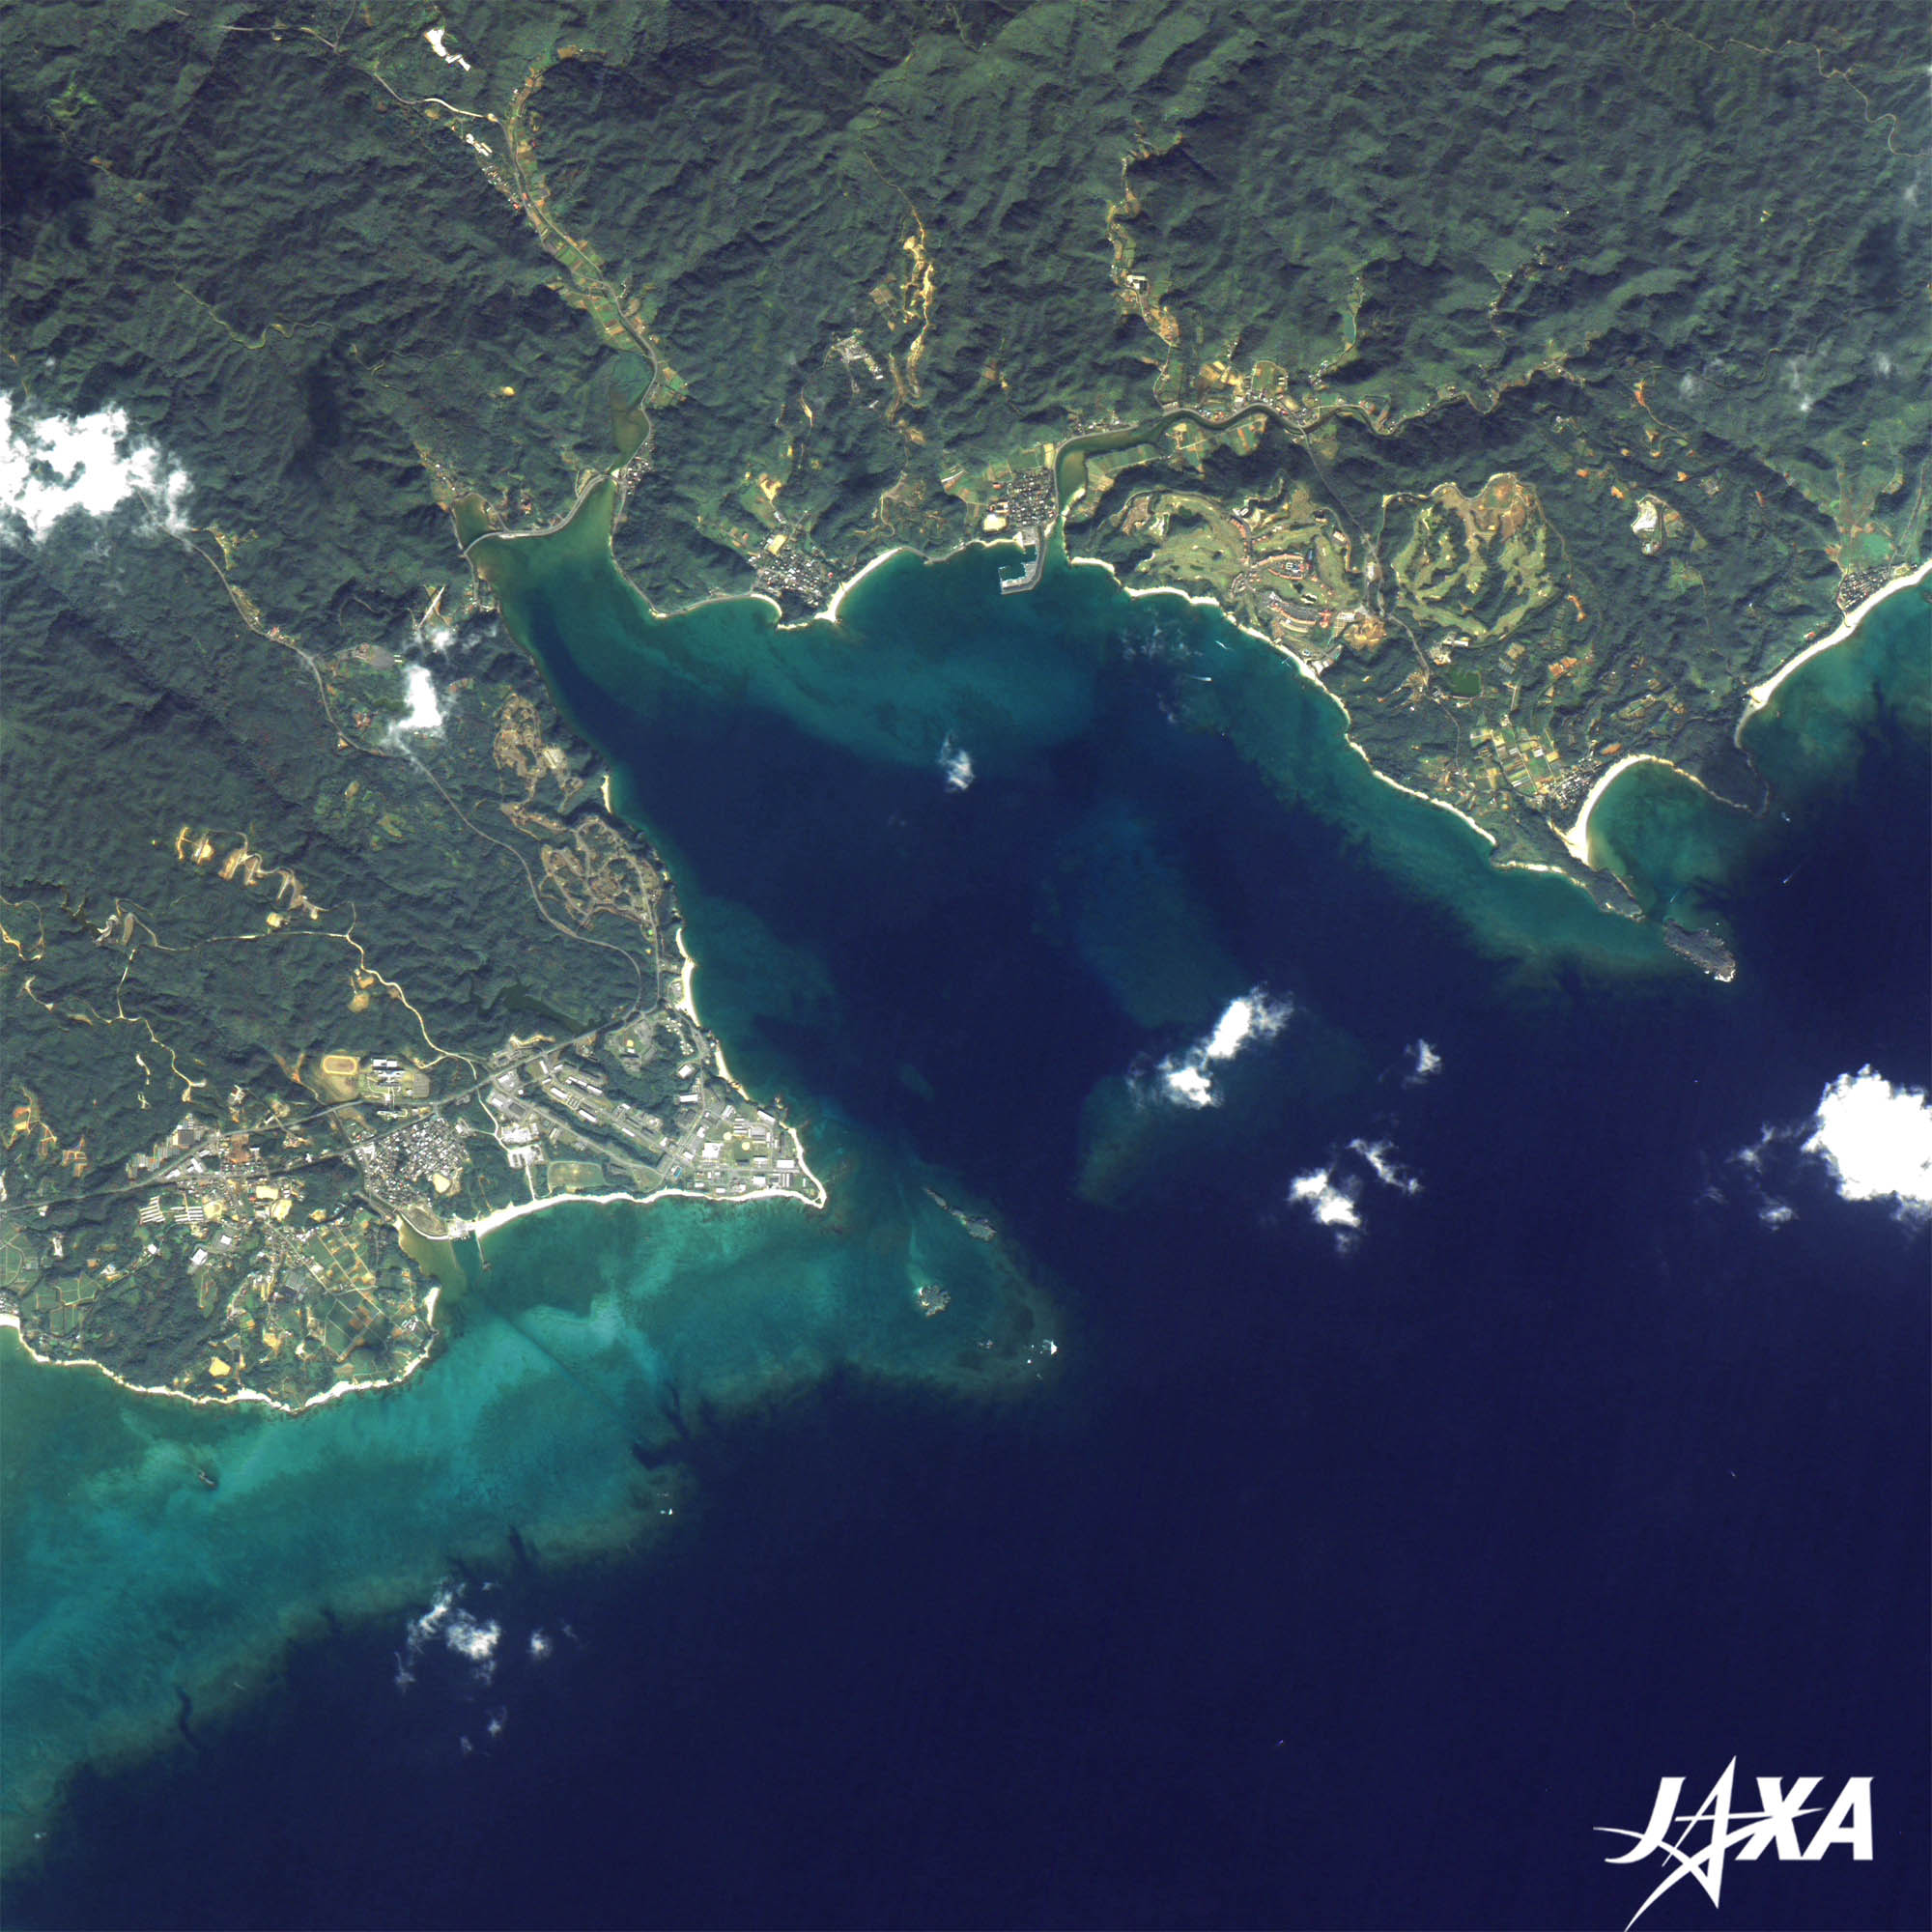
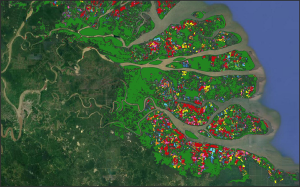
Fig. 2. Images of Ourawan Bay in 2007 (left) and in 2010 (right).
Ourawan Bay (kmz, 6.89 MB, low-resolution) as seen as on Google Earth
Images of Ourawan Bay obtained by the Advanced Land Observation Satellite (ALOS; Daichi) in December 2007 and September 2010 are shown in Fig. 2. In these images of the eastern coast of Nago, Okinawa main island, there can be seen a fully diverse environment spreading from the deep sea facing the open sea, coral reefs, underwater forests of marine plants (Thalassia and Halophila) and seaweed varieties; up to the inner section of the V-shaped Ourawan Bay, home to mangrove forests and mud flats along the mouths of the Oura and Teima rivers. In an environment with such varied and unique ecosystems, this so-called rich biodiversity was created with blue coral (Heliopora coerulea) community at Chiribishi and Dugong. On the coast of Okinawa Island, there have been occurrences of red-soil erosion, reclamation, outbreaks of starfish Onihitode (Acanthaster planci), and the bleaching of coral, which have caused a decrease in coral proliferation. However, Ourawan Bay is considered an area in which rich biodiversity maintenance can be achieved because of its unique surrounding geography and natural resources. In Fig. 2, this recovery is evident by its change from a whitish color in 2007 to a brownish color in 2010, as in 1992, on the edge of the coral reef along the west edge of Ourawan Bay.
During recent planetary observation from space, onboard satellite sensors have been evolving to fill the coastal zone information gap. By using a blue light, which has high transmittance in water, observation performance is enhanced to map land cover on the ocean bottom and bathymetry, and the information collected by monitoring variations in coastal environments are considered to be a useful in planning biodiversity conservation. The successor to the Advanced Land and Observation Satellite (ALOS) with optical sensors is considered as a suitable tool for studying widely distributed coral regions along coastal zones through consistently high-resolution images with wide-swath width coverage capability in a single system, which is unique to advanced optical remote-sensing technology in Japan. The availability of public data for mapping biodiversity by using the successor to ALOS with optical sensors has become more critical for countries such as members of the Association of Southeast Asian Nations (ASEAN) and is expected to be a high-profile international contribution from Japan (Reference 5).
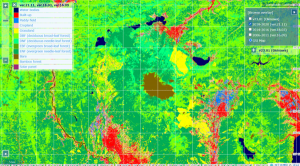
Furthermore, the Second-Generation Global Imager (SGLI) onboard Global Change Observation Mission-Climate (GCOM-C) makes it possible to analyze time-series data sets of suspended solids in turbid water flow from land, aquatic plants, and river-water flow along coastal zones of the highly irregular and indented coastline of Japan. To better understand the relationship between regional marine climate and environmental change, high-resolution data will be presented: 250 m in ocean color and 500 m in sea surface temperature (SST).
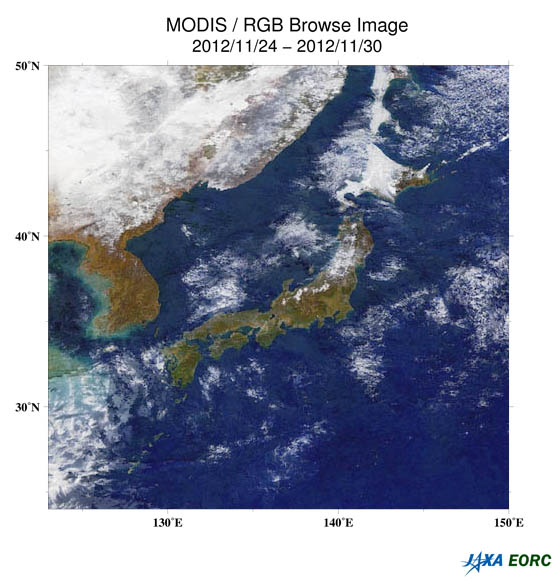
Fig. 3. a. Cloud-free RGB color-composite image
(processed from data obtained during the course of seven days, from November 24 to 30, 2012).
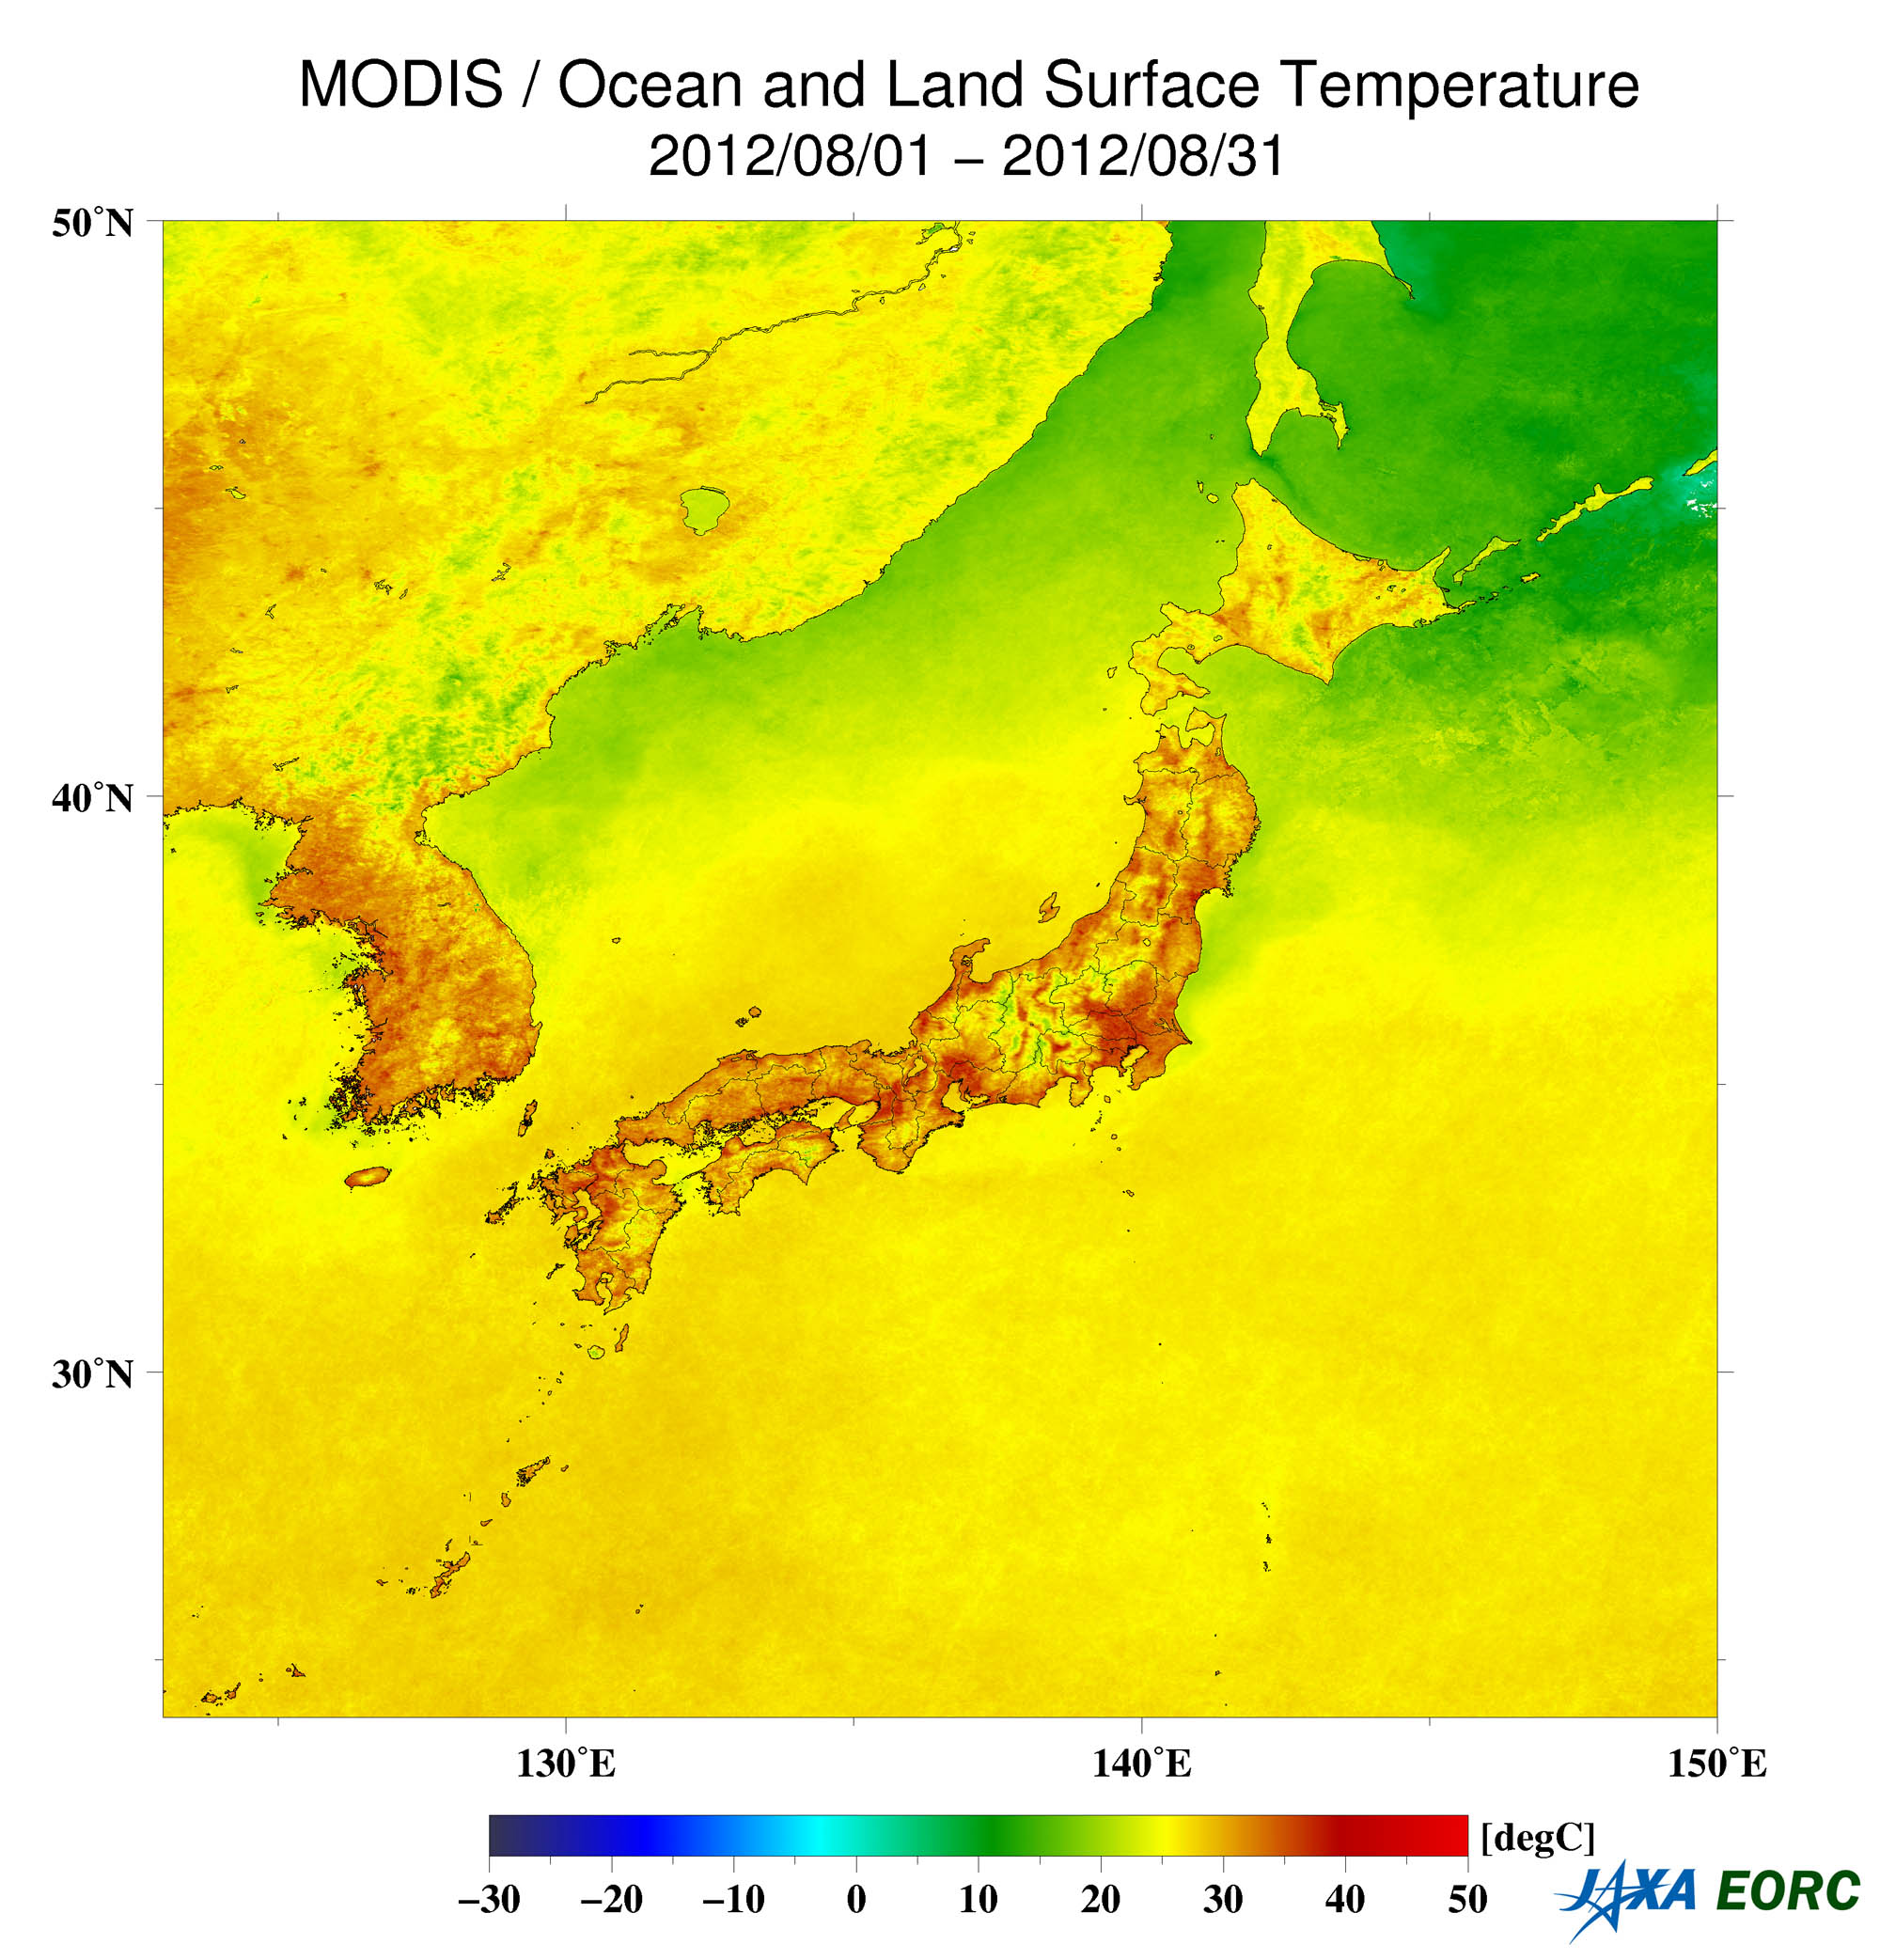
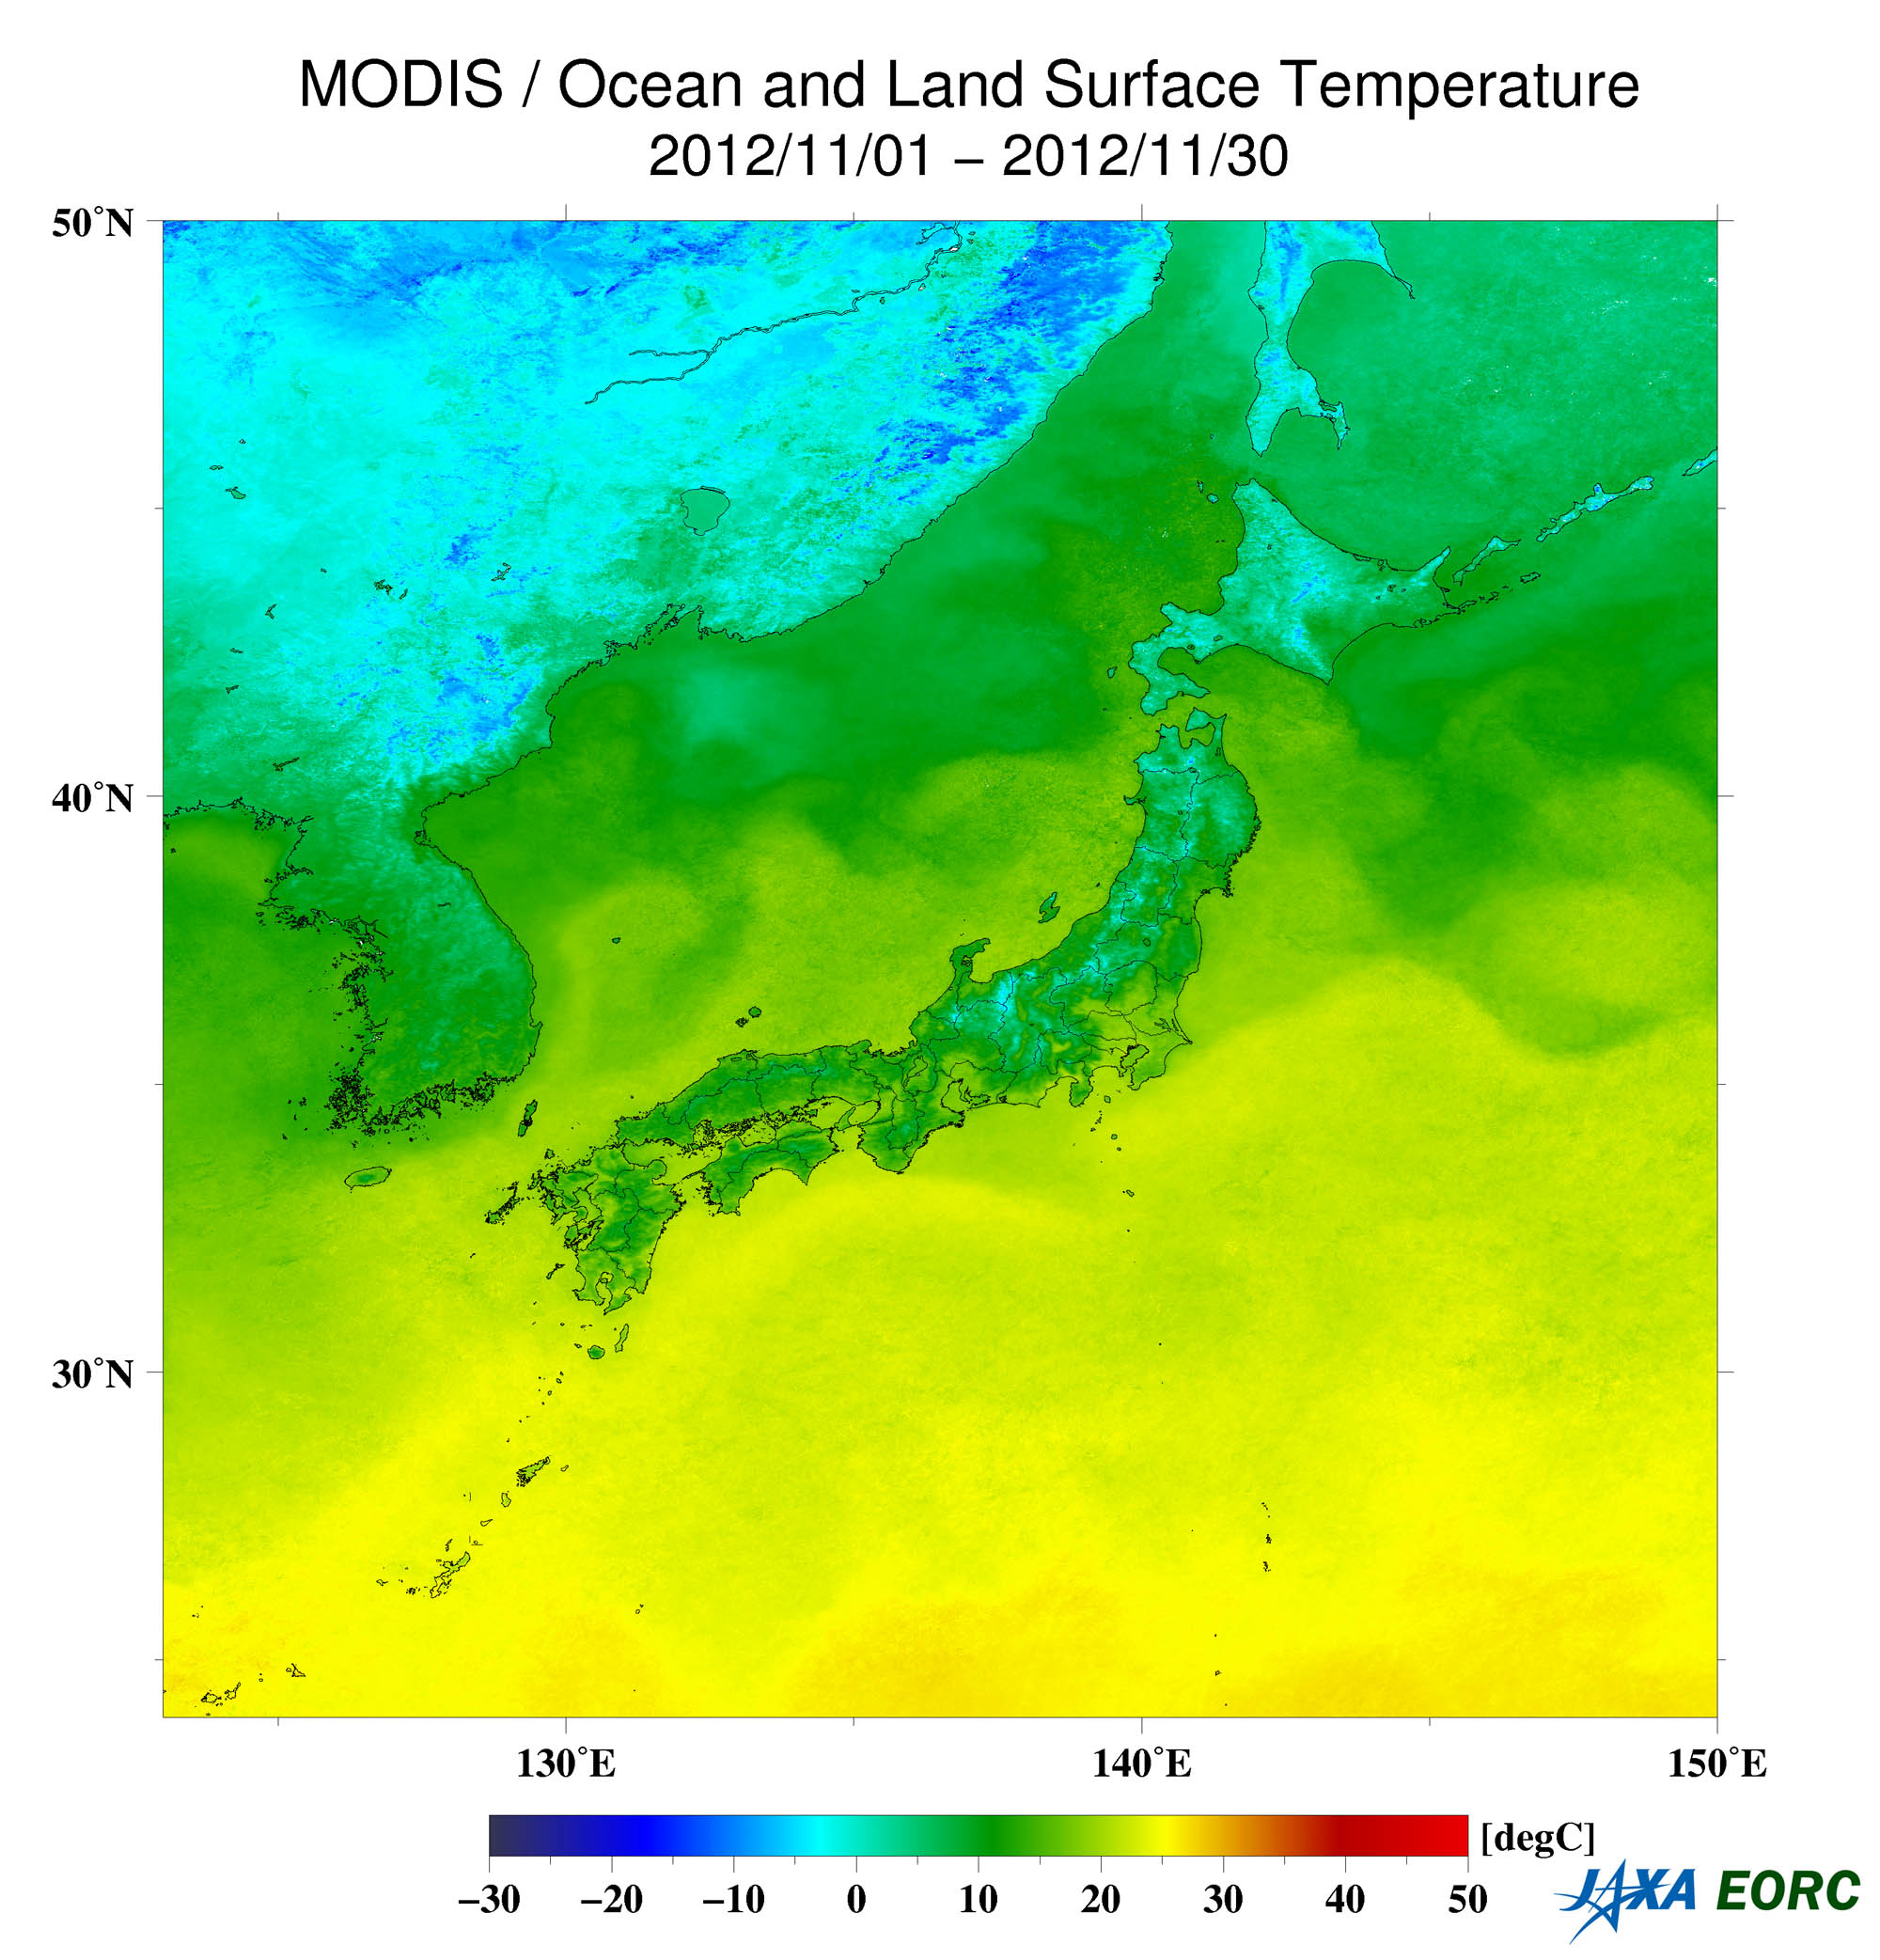
Fig. 3. b. Monthly mean land and sea surface temperature (SST) in August 2012. (Left)
Fig. 3. c. Monthly mean land and sea surface temperature (SST) in November 2012. (Right)
As the preceding information derivation before SGLI, the Moderate-resolution Imaging Spectroradiometer (MODIS) image is now open to the public (Fig. 3a) (Reference 6). From monthly mean land and SST in 2012 (Fig. 3b, 3c), the SSTs offshore Okinawa are 30 °C in August and more than 20 °C in November, which are suitable temperatures for coral development. Archived data from MODIS have been obtained since 2003. The products and information derived from these data sets are expected to be the predecessors of SGLI data sets without information gaps to contribute data analysis, validation, and applications such as biodiversity protection.
In November 2012, the Japan Meteorological Agency (JMA) released a statement concerning the release of periodic monitoring information on ocean acidification as information related to global warming, which was derived from time-series data analysis of marine observation data by a meteorological observation vessel for the first time in Japan (Reference 7). Based on this analysis, it was determined that ocean acidification is advanced in the northwest Pacific Ocean (from 3° N latitude to 34° N online of 137° E longitude). Accordingly, it is considered that carbon sink potential in the ocean is decreasing and its effects on marine ecosystems have generated concern. Ocean acidification information will be released by the JMA, and it is expected that both space and marine observation data will be used to promote biodiversity protection and to confront the challenges presented by climate change.
Footnotes
*1 The conference was held in June 1992 in Rio de Janeiro, Brazil. The official name is the United Nations Conference on Environment and Development (UNCD), otherwise known as the Earth Summit, where the Framework Convention on Climate Change (FCCC) and the Convention on Biological Diversity (CBD) were adopted.
*2 Corals with hard skeletons, which maintain an internal mechanism of cora–zooxanthella symbiosis, play a role in building up the coral reefs.
*3 The first Earth observation satellite of the Landsat mission was launched in 1972, which continued with a series of satellites until its 40th Anniversary in 2012. For future missions, Landsat-8 of the Landsat Data Continuity Mission (LDCM) was launched on February 11, 2013, or later. Landsat has ability to observe the Earth’s surface in every 16 days periodically without gaps, which is a variation from high-resolution commercial satellites that can observe specific targets by pointing observation. This method is considered the most effective for global environmental observance without time or location data gaps.
Reference sites
Explanation of the Images:
| Satellite: | Landsat-5 (USA) |
| Sensor: | Thematic Mapper (TM) |
| Date: | May 28, 1992 (UTC) (Fig.1) |
| Ground resolution: | 30 m |
| Map Projection: | Universal Transversal Mercator (UTM) |
The image data of Figure 1 was downloaded free of charge from the U.S. Geological Survey’s (USGS) Global Visualization Viewer (GLOVIS). The color composite images are produced by assigning red to Band 3 (630–690 nm), green to Band 2 (520–600 nm), and blue to Band 1 (450–520 nm). The resulting images have natural coloring as if seen by the unaided eye.
| Satellite: | Advanced Land Observing Satellite (ALOS) (Daichi) |
| Sensor: |
Advanced Visible and Near Infrared Radiometer-2 (AVNIR-2) Panchromatic Remote-sensing Instrument for Stereo Mapping (PRISM) |
| Date: | 01:12 (UTC) on December 25, 2007 (AVNIR-2, PRISM) (Fig. 2, left) 01:13 (UTC) on September 22, 2010 (AVNIR-2, PRISM) (Fig. 2, right) |
| Ground resolution: | 10 m (AVNIR-2) and 2.5 m (PRISM) |
| Map Projection: | Universal Transversal Mercator (UTM) |
The Advanced Visible and Near Infrared Radiometer 2 (AVNIR-2) is equipped with four observation bands. The color composite images are produced by assigning red to Band 3 (610 to 690 nm), green to Band 2 (520 to 600 nm), and blue to Band 1 (420 to 500 nm). The resulting images have natural coloring as if seen by the unaided eye. Each color indicates the following ground objects:
| Dark green: | Forests |
| Bright green: | Forests, grass fields, farmland |
| Bright grey: | Urban areas |
| Brown: | Bare land |
| Blue: | Sea surface |
| White: | Buildings or sand |
(Fig.2)
Panchromatic Remote-sensing Instrument for Stereo Mapping (PRISM) is an optical sensor for observing ground surfaces with visible and near-infrared signals in the 520- to 770-nm (one-billionth of a meter) band. The image is monochromatic but has a higher resolution. PRISM is equipped with three independent optical systems with which to simultaneously obtain images in the view of nadir, forward, and backward. Only the nadir images are used in these figures.
The aforementioned AVNIR-2 color composite image is decomposed into hue, saturation, and intensity. The intensity portion is replaced by PRISM data. The hue, saturation, and intensity data are then reversed into a color image. The color image in Fig. 2 has a virtual resolution of 2.5 m. A color image composed by combining a higher-resolution monochromatic image and a lower-resolution color image is referred to as a pan-sharpened image.
Search by Year
Search by Categories


Tags
-
#Earthquake
-
#Land
-
#Satellite Data
-
#Aerosol
-
#Public Health
-
#GCOM-C
-
#Sea
-
#Atmosphere
-
#Ice
-
#Today's Earth
-
#Flood
-
#Water Cycle
-
#AW3D
-
#G-Portal
-
#EarthCARE
-
#Volcano
-
#Agriculture
-
#Himawari
-
#GHG
-
#GPM
-
#GOSAT
-
#Simulation
-
#GCOM-W
-
#Drought
-
#Fire
-
#Forest
-
#Cooperation
-
#Precipitation
-
#Typhoon
-
#DPR
-
#NEXRA
-
#ALOS
-
#GSMaP
-
#Climate Change
-
#Carbon Cycle
-
#API
-
#Humanities Sociology
-
#AMSR
-
#Land Use Land Cover
-
#Environmental issues
-
#Quick Report
-
#GOSAT-GW
Related Resources


Applications Related Articles
-
 Applications 2024.01.15 Mon The Use of Earth Observation Satellite Data in the Humanities and Social Sciences (2)
 -
 Applications 2023.11.29 Wed The Use of Earth Observation Satellite Data in the Humanities and Social Sciences (1)
 -
 Applications 2023.08.04 Fri Contribution to SDGs Goal 6 “Clean Water and Sanitation”
 -
 Applications 2023.07.10 Mon Contribution to SDGs Goal 15 “Life on Land”
Stay Connected
