


Overview of data provision for each disaster
JAXA has been carrying out emergency observations of disaster-stricken areas on a priority basis at the request of ministries, agencies related to disaster management, and local governments, in addition to regular monitoring by Earth observation satellites.
We would like to express our deepest sympathies to all those who have been affected by natural disasters.
Tsunami: The Great East Japan Earthquake (2011)
A single tsunami generated by an earthquake can cause enormous damage over a very wide area. It is difficult to get a complete picture of the damage immediately after a disaster occurs, and helicopters and aircraft may not be able to observe all the affected areas. Satellites are effective in assessing the full extent of tsunami damage because they can observe a wide area at once.
We introduce the observation results of JAXA’s Advanced Land Observing Satellite “DAICHI” (ALOS) on the Great East Japan Earthquake in 2011.
Response to the Great East Japan Earthquake
At around 2:46 p.m. on March 11, 2011, an earthquake of magnitude 9.0 struck off the Pacific coast of the Tohoku region, the largest earthquake ever recorded in Japan. JAXA Tsukuba Space Center was hit by an intensity 6 lower on the Japanese seismic scale. While we were busy checking the damage within our center, we carried out emergency observations by ALOS every day from the morning of the next day. In the immediate aftermath of the earthquake, many aircraft and helicopters observed the tsunami-affected areas. However, it was impossible to get a full picture of the situation because flights were banned within a 30 km radius of the Fukushima Daiichi Nuclear Power Station. Under this situation, the entire coastline of the Tohoku region was clear and sunny on March 14, and ALOS emergency observation revealed the full extent of the damage caused by the tsunami for the first time.
ALOS observation results
Figure 1 is an image taken by the Advanced Visible and Near Infrared Radiometer type 2 (AVNIR-2), an optical sensor onboard ALOS, on March 14. An optical image can observe visible light and near-infrared light, which are visible to the human eye.
Figure 1 is called a “False Color Image,” which highlights vegetation and tsunami-affected areas by assigning near-infrared wavelengths to red, red wavelengths to green, and green wavelengths to blue (Figure 2). In the coastal area on the left of Figure 1, there is areas that have changed to dark blue, which are presumed to be the areas inundated by the tsunami. The red areas indicate the vegetation. We can also see drifted debris off the coast of Soma City, which is thought to have been washed out to the sea by the tsunami.
In this section, we have introduced how to estimate the tsunami damage area using optical sensors, but it can also be estimated using Synthetic Aperture Radar (SAR), which will be introduced in the next section, 2. Flood: The Heavy Rain Event of July 2018.
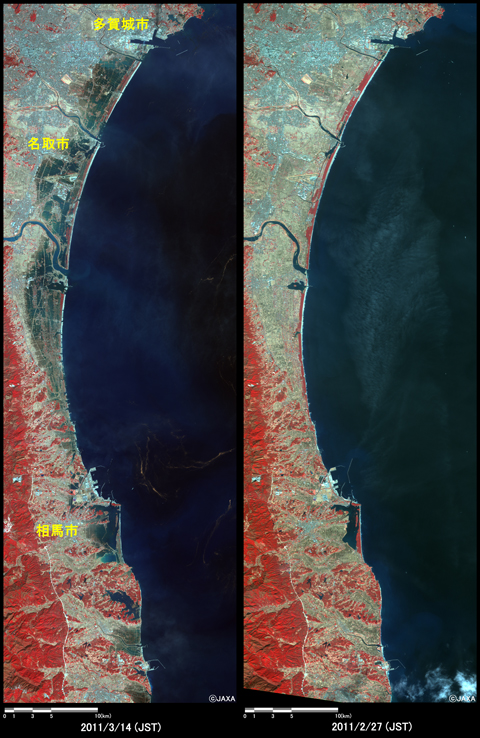
Figure 1: Coastal areas of the Tohoku region before (right) and after (left) the earthquake observed by ALOS.
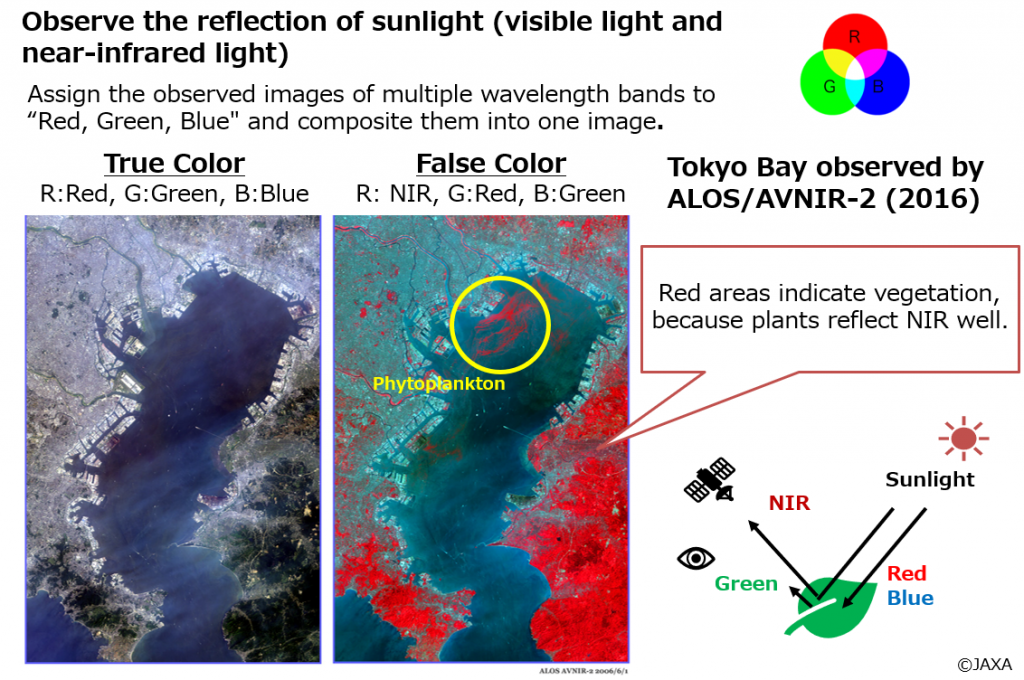
Figure 2: Characteristics of an optical sensor image
Read more detailed information about Use cases:
Emergency Observation the Great East Japan Earthquake by ALOS
Updates on Earth (2021/03/08) (Japanese only)
Flood: The Heavy Rain Event of July 2018
Japan suffers from typhoons and heavy rains every year, and as global warming progresses, the frequency of heavy rains and sudden downpours is expected to increase further. JAXA’s Earth observation satellites data can be used to monitor flood damage, which is becoming more severe every year.
Here we introduce the observation results of JAXA’s Advanced Land Observing Satellite-2 “DAICHI-2” (ALOS-2) for the Heavy Rain Event of July 2018.
Response to the Heavy Rain Event of July 2018
The Heavy Rain Event of July 2018 caused record-breaking heavy rainfall over a wide area nationwide, mainly in western Japan, from June 28, 2018 onward, resulting in extensive damage in many areas due to river flooding, inundation, and landslides.
JAXA conducted emergency observations based on requests from the Ministry of Land, Infrastructure, Transport and Tourism (MLIT), Tokushima Prefecture, and Kochi Prefecture, as a large amount of rain was expected to fall on western and eastern Japan after July 5. A total of nine emergency observations were conducted from the night of the 5th, and we provided the results showing the flooded areas and landslides. These results were utilized in the planning and implementation of the damage assessment plan by the disaster prevention helicopter survey. And also the TEC-FORCE Advanced Technical Guidance Team (sediment disaster experts) used a route map based on satellite data and information from the local government, and the map was useful for planning and conducting a prompt and accurate survey.
ALOS-2 Observation results
Figures 3 and 4 show the information we provided to disaster management agencies. On the left is a flooded area estimated by analyzing observation images taken by ALOS-2, and on the right is an optical image taken by Sentinel-2 before the disaster. The red areas are identified as flooded areas (we will explain how to read the analysis image later).
However, since it is difficult to identify only the damages caused by the disaster using this image alone, experts are looking at other materials including other optical images and the news media to detect areas that are more likely to be flooded, and provide the information to disaster management agencies. The identified result is the light blue frames shown in the both images.
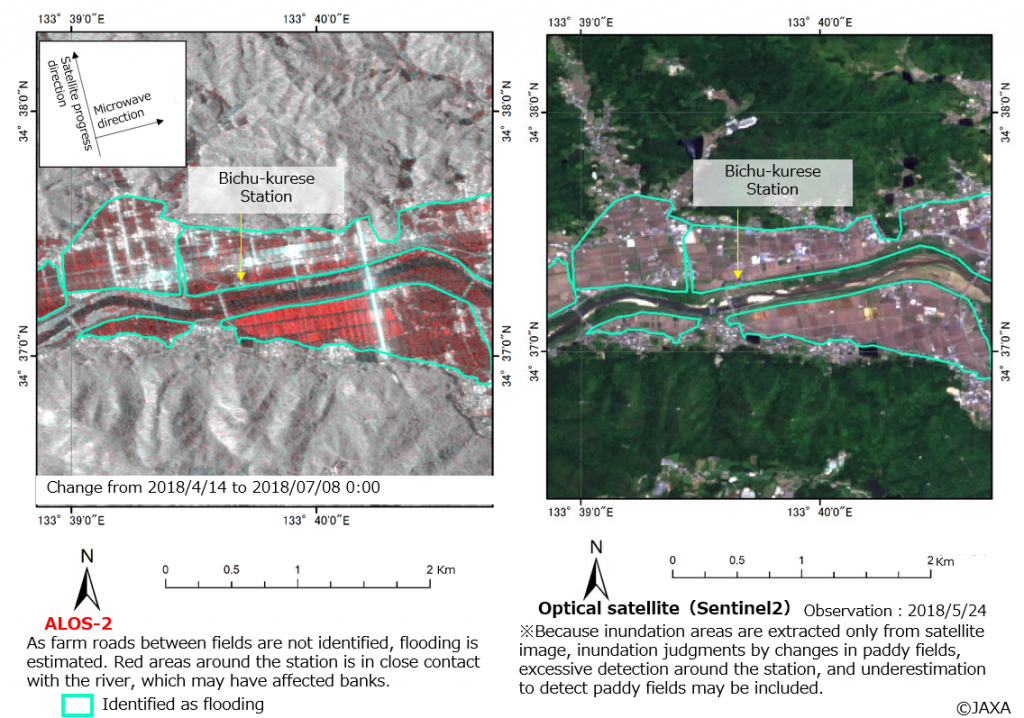
Figure 3: Result of identified flooded areas of the Takahashi River and Oda River basins in Kurashiki City, Okayama Prefecture
(Left: ALOS-2, Right: Optical image before the disaster)
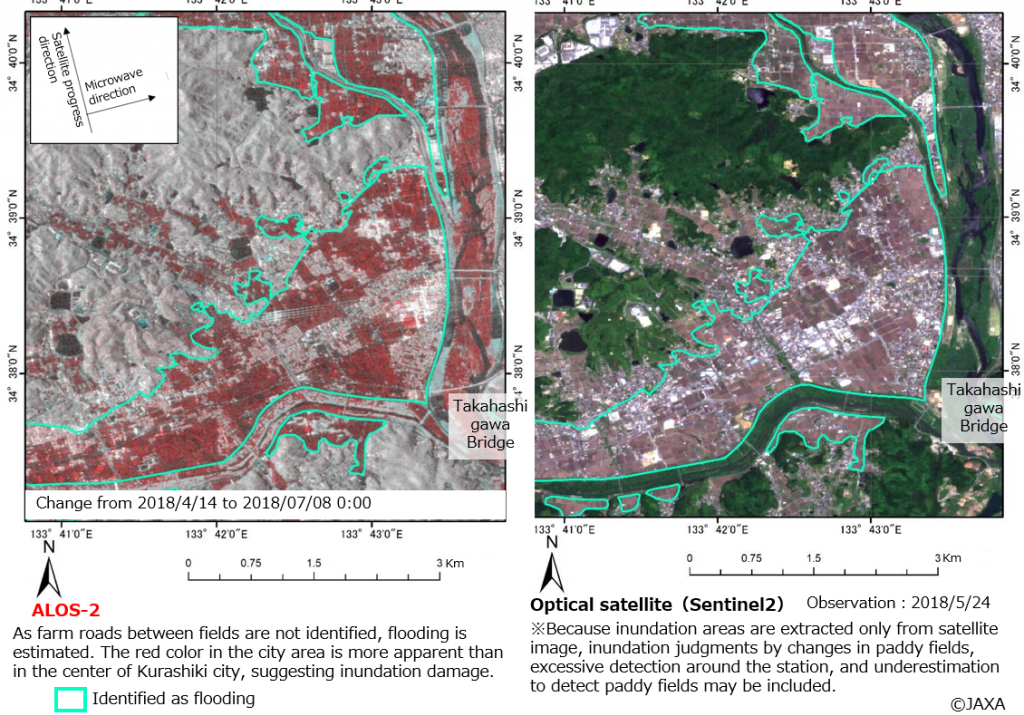
Figure 4: Result of identified flooded areas of the Takahashi River and Oda River basins in Kurashiki City, Okayama Prefecture
(Left: ALOS-2, Right: Optical image before the disaster)
Analysis of obserbation image from SAR satellite
ALOS-2 is equipped with a sensor called the Phased Array L-band Synthetic Aperture Radar (PALSAR-2). A SAR satellite conducts observations by emitting microwaves and receiving radio waves reflected back from observed objects. As shown in Figure 5, when the ground surface is smooth due to flooding, radio waves do not return to the satellite, and the received signals are weak (the image become dark). This characteristics can be used to estimate the flooded area.
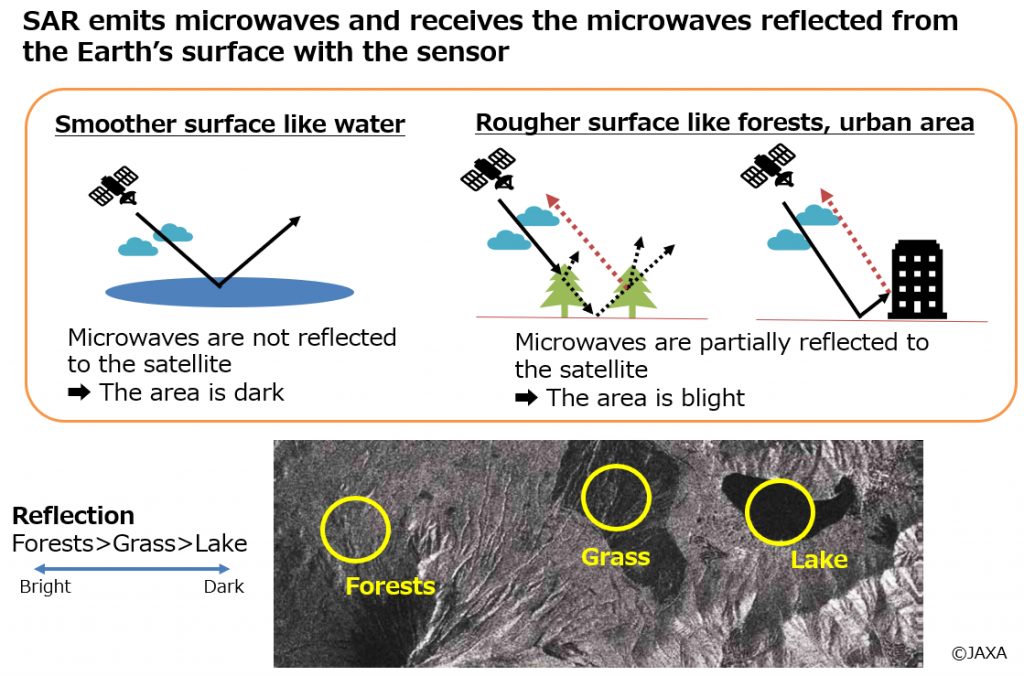
Figure 5: Characteristics of Synthetic Aperture Radar (SAR) images
ALOS-2 images shown in Figures 3 and 4 were generated using a method called “RGB color composite,” as shown in Figure 6. This method is used to highlight flooded areas by comparing images taken before and after the disaster. Here, the pre-disaster image is shown in red, and the post-disaster images are shown in blue and green. The post-disaster images in blue and green appear as light blue when superimposed, based on the three primary colors of light. In this way, if the received signal before the disaster is stronger than that after the disaster, the area will be red, if the signal after the disaster is stronger, the area will be light blue, and if there is no change in the received signals, the area will be close to white or black. Flooded areas are shown in red because the received signal is stronger in the pre-disaster image, as mentioned earlier. However, it should be noted that the red color may change due to other reasons than natural disasters, such as a rice-planting season when fields are irrigated.
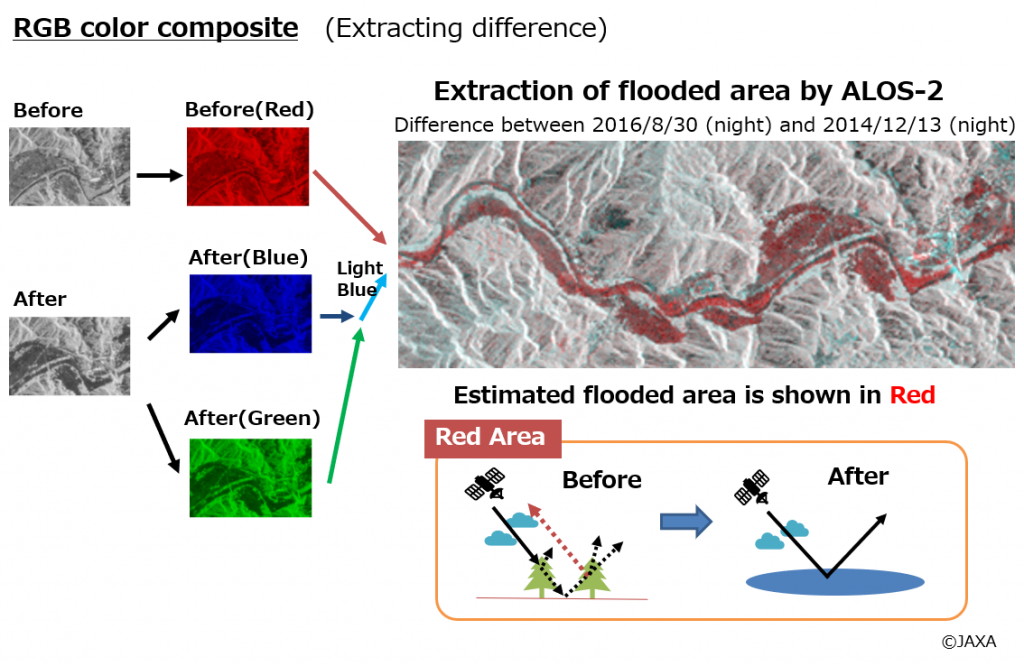
Figure 6: Flooded mapping by RGB color composite
It is difficult to understand intuitively SAR imaginary more than optical imagery, but it allows us to understand the situation on the ground day and night, in all weather conditions. In other words, SAR imaginary has strength in damage assessment, especially at night or when it is difficult to survey by helicopter due to heavy rain. The images in Figure 3 and 4 were taken at around midnight, which is one of the advantages of satellite observation since it is difficult to take images by helicopter during this time.
The images shown in “1. Tsunami: The Great East Japan Earthquake” were optical images taken by ALOS, but tsunami inundation areas can also be identified by SAR images taken by ALOS-2 in the same way.
Landslide: The Heavy Rain Event by Typhoon Hagibis in October 2019
Landslides are caused by a variety of factors, including heavy rains from typhoons, volcanic activity, and earthquakes. A landslide disaster can take many lives and property in an instant if a large amount of soil or rock collapses with great force. Since most landslides occur in mountainous areas and it is difficult to predict them, satellites are useful for observing a wide area where a landslide is suspected to occur.
Here we introduce the observation results of JAXA’s Advanced Land Observing Satellite-2 “DAICHI-2” (ALOS-2) for the Heavy Rain Event by Typhoon Hagibis in October 2019.
Response to the Heavy Rain Event by Typhoon Hagibis in October 2019
In the Heavy Rain Event by Typhoon Hagibis in October 2019, Hagibis made landfall in Izu Peninsula on October 12, 2019 with large and strong force, and passed East Japan, which resulted in heavy rains, strong winds, high waves, and storm surges over a wide area.
Since Hagibis was expected to bring a large amount of rain to the Hokuriku and Tohoku regions after October 12, JAXA conducted a total of six emergency observations from the night of October 12 at the request of the Ministry of Land, Infrastructure, Transport and Tourism. The information was provided was used to understand the outline of the flooding damage and landslide collapse, and to study the survey route by the disaster prevention helicopter.
ALOS-2 Observation results
Figures 7 and 8 show the information actually provided to disaster management agencies. On the left is an RGB color composite image obtained from ALOS-2 image, and on the right is an optical image taken by Sentinel-2 before the disaster. The red frame shows the landslide area identified by ALOS-2 and optical satellite images.
How to interpret the image
ALOS-2 Images below are also RGB color composite images, with red before the disaster and blue and green after the disaster (light blue when superimposed) same as “2. Flood: The Heavy Rain Event of July 2018”. We mentioned that the areas suspected of flooding in SAR image would be red, because the SAR image values would be smaller. On the other hand, in the case of landslides, red and light blue are often displayed next to each other. This is because in the case of landslides, the surface of the ground tends to become smooth in certain areas due to landslides, while collapsed areas tend to accumulate downward, causing the ground surface become rough.
In the case of landslides in particular, looking at SAR images alone can lead to misinterpretation. For example, it is difficult to identify between changes caused by deforestation and other man-made land alterations and changes caused by natural disasters. Therefore, it is important to provide more reliable information by checking and comparing the latest optical images of what the area looked like before the disaster.
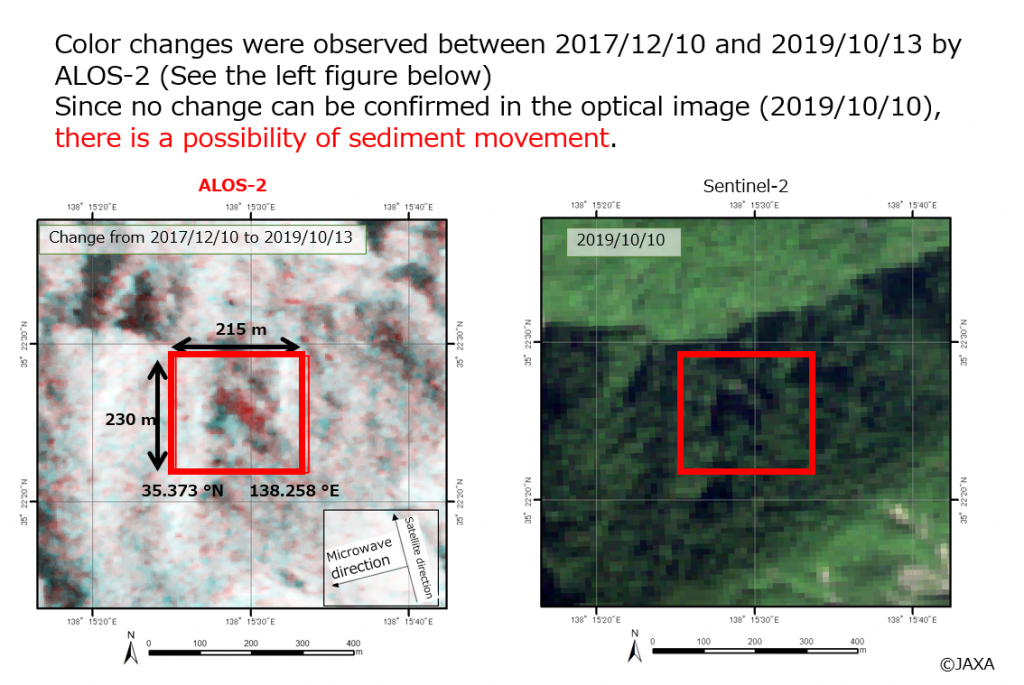
Figure 7: Result of identified sediment transport areas of around Amehata, Hayakawa Town, Yamanashi Prefecture
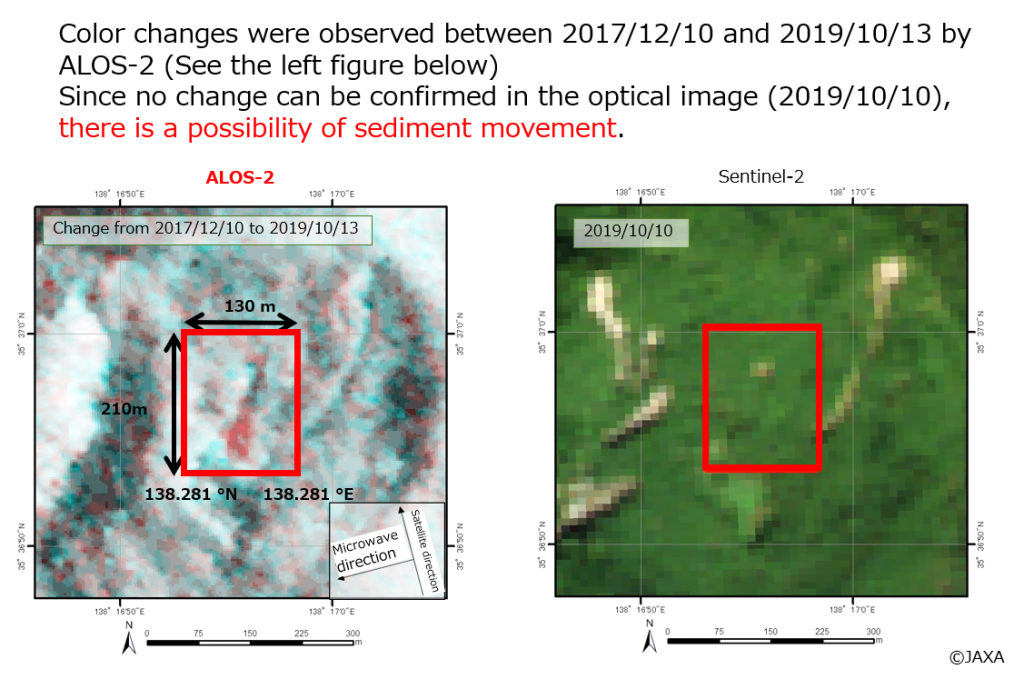
Figure 8: Result of identified sediment transport areas of around Narada, Hayakawa Town, Yamanashi Prefecture
Crustal movement: The 2016 Kumamoto Earthquake in 2016
Damages caused by earthquakes include tsunamis, collapsed buildings, fires, landslides, and liquefaction. Although it is considered difficult to predict earthquakes, regular monitoring by satellites allows us to know changes of ground surface such as crustal movement in the event of an earthquake disaster.
Here, we introduce an example of observation by JAXA’s Advanced Land Observing Satellite-2 “DAICHI-2” (ALOS-2) for the 2016 Kumamoto Earthquake.
Response to the 2016 Kumamoto Earthquake
An earthquake of magnitude 6.5 occurred on April 14, 2016, with its epicenter in the Kumamoto region of Kumamoto Prefecture, causing an intensity of 7 on the Japanese scale in Mashiki-cho, Kumamoto Prefecture, and an intensity of just under 6 in Tamana City, Kumamoto City, and other areas. On April 16, a magnitude 7.3 earthquake, which was larger than the previous one, hit Mashiki Town and Nishihara Village in Kumamoto Prefecture with an intensity of 7, and Minamiaso Village and Kikuchi City with a intensity of just under 6.
After the disaster struck, we conducted emergency observations using ALOS-2 at the request of the Earthquake SAR Analysis Working Group (Earthquake WG) established by the Coordinating Committee for Earthquake Prediction, and provided the data. The results of the differential interferometry of ALOS-2 images showed crustal movement, which was published on the Geospatial Information Authority of Japan (GSI) website and used to report to the Earthquake Research Committee (extraordinary meeting) (April 17, 2016).
ALOS-2 Observation results
Figure 9 is an interferometric SAR image created by the Geospatial Information Authority of Japan (GSI)based on ALOS-2 imagery, capturing the crustal movement from February 10, 2015 to April 19, 2016.
Interferometric SAR analysis (or interferometry, InSAR) is an analysis method that takes the difference between the observation data of two SAR images acquired before and after an earthquake. This allows us to measure the displacement of the ground surface, i.e., how much the ground has moved. It is possible to visualize the crustal movement associated with earthquakes as a whole widely, which is useful for estimating the location of fault movement and predicting the risk of future earthquakes.
For more information on how to view interferometric SAR images, please click here.
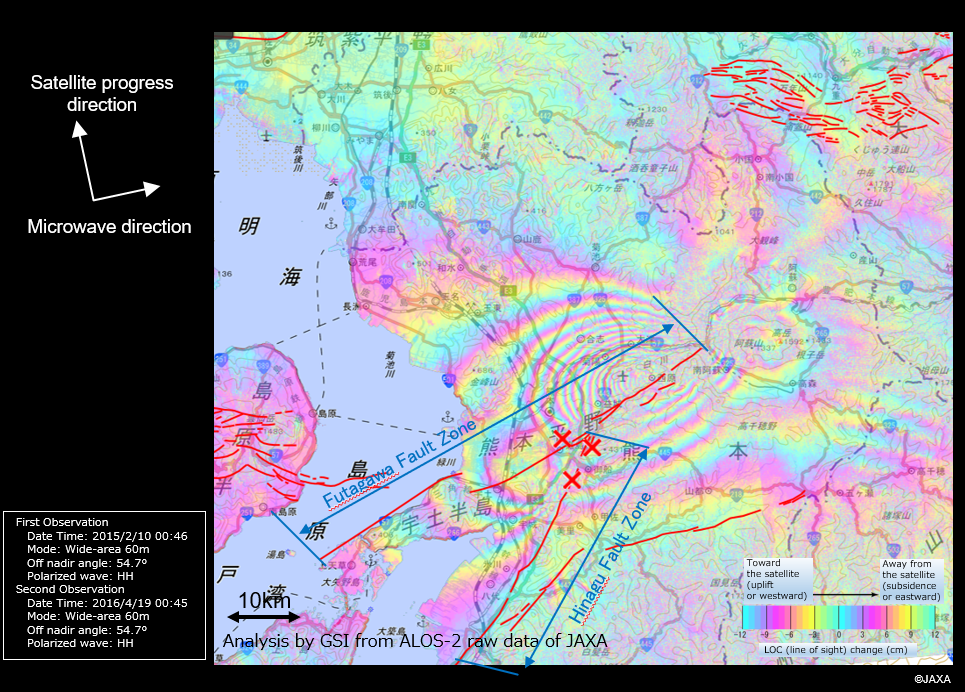
Figure 9: Interferometric SAR image created by GSI based on ALOS-2 imagery
In addition, Sentinel Asia and the International Charter ‘Space and Major Disasters’, which are international frameworks for disaster management using satellites, were activated at the request of the Cabinet Office after the 2016 Kumamoto Earthquake. In addition to ALOS-2, we provided disaster management organizations with observation results of landslide areas around Minamiaso Village and collapsed buildings in Mashiki Town detected by observation data from Sentinel Asia and International Charter ‘Space and Major Disasters’ satellites, as well as commercial optical satellites.
・Read more about Use case:
The Kumamoto Earthquake in April 2016
Sentinel Asia
Charter Activations
・Read about:
Sentinel Asia
International Charter ‘Space and Major Disasters’
Volcano (activity in Nisinoshima)
Japan is one of the largest volcanic countries in the world, and according to the Japan Meteorological Agency, there are 111 active volcanoes in Japan (as of April 2021). Among volcanic phenomena, cinder cones, pyroclastic flows, snowmelt-type volcanic mudflows, lava flows, volcanic ash, and volcanic gases can cause major disasters.
In Japan, ground-based observation networks are well developed for monitoring volcanic activity for disaster prevention and research purposes. Therefore, compared to earthquakes, it is easier to identify signs of disasters through regular monitoring. However, for volcanoes that are difficult to observe on the ground, such as distant islands and submarine volcanoes, or for volcanoes whose ground-based observation equipment has been damaged by eruptions, information from observation satellites is important. The satellite is also useful, as it can monitor crustal movement over a wide area.
Monitoring by ALOS-2
Figure 10 shows the changes in the topography of Nishinoshima Island from 2014 to 2019, observed by ALOS-2. Nishinoshima is a volcanic island located 930 km south of Tokyo, and the new island, which appeared at the time of the eruption in November 2013, was about 200 m in diameter. But later it became one with the original island, currently its area has been expanding and it is still active. Figure 10 shows the gradual expansion of Nishinoshima’s area. SAR images allows us to understand the changes on a regular basis, day and night, unaffected by weather or fumes.
JAXA has continued to observe the volcanic activity on Nishinoshima Island using ALOS-2 based on a request from the Satellite Analysis Group (Volcano WG) established by the Coordinating Committee for Prediction of Volcanic Eruption. Ovservation images are used by the Japan Meteorological Agency (JMA) to issue warnings around craters, and by the Japan Coast Guard (JCG) to issue navigational warnings.
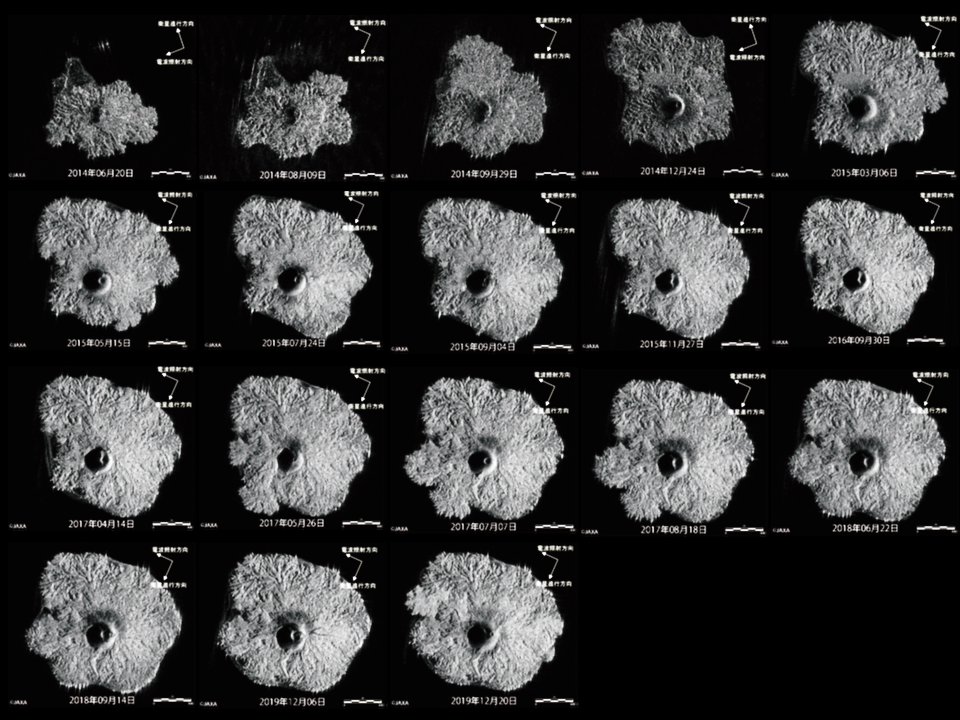
Figure 10: Observation images of Nishinoshima Island from 2014 to 2019
Monitoring by GCOM-C
In addition to understanding changes in topography by SAR images, combining information from other satellites will allow us to gain a more comprehensive understanding. In this section, we will introduce the observations by the Global Change Observation Mission-Climate “SHIKISAI” (GCOM-C).
When a volcano in the ocean is active, “discolored water” appears. The ocean color is so dark that it is sometimes difficult to observe from an airplane because it is drowned out by dust in the atmosphere. This is where GCOM-C, which can observe a wide range of wavelengths from ultraviolet to infrared, comes in handy. By combining various wavelengths and compensating the effects of dust, sunlight reflection, we can more accurately estimate the changes in discolored water that cannot be identified just by looking at it from above. Figure 11 shows a large-scale discolored water, which is thought to have originated from the erupting Nishinoshima Island, observed by GCOM-C on July 17, 2020.
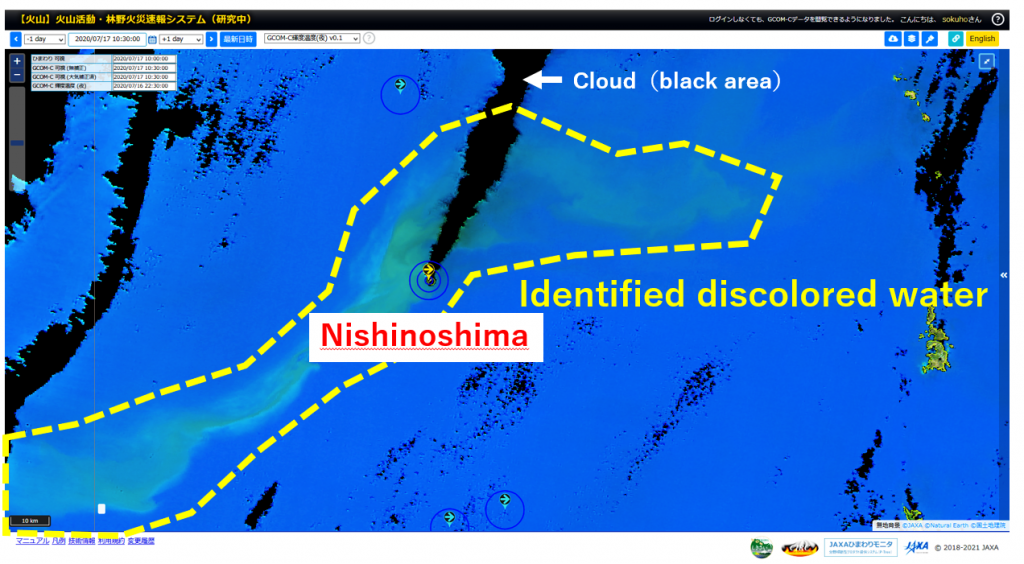
Figure 11: Discolored water around Nishinoshima observed by GCOM-C (yellow frame)
Using infrared light, we can also capture the transition of lava flows and changes in the high-temperature areas near the crater. Figure 12 shows the temperature trends of Nishinoshima Island observed by GCOM-C, showing the temperature increase during the eruptions in July 2018 and December 2019. By monitoring regularly, we can quickly detect anomalies in volcanic activity and signs of eruptions on distant volcanic islands.
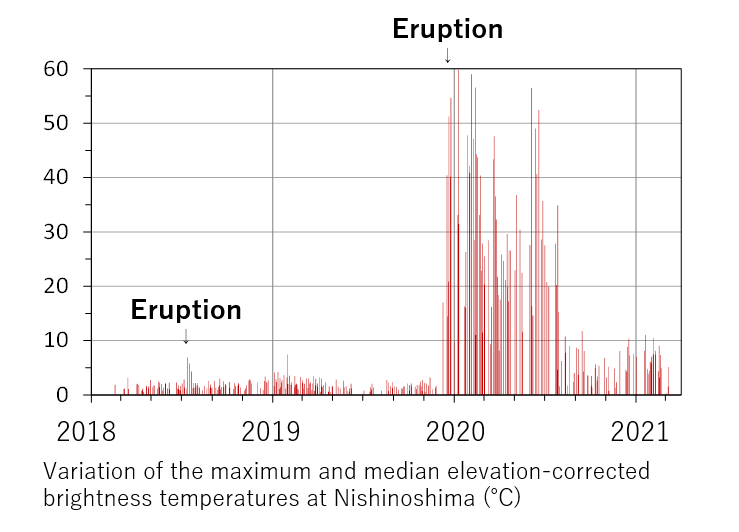
Figure 12: Thermal infrared observation result of Nishinoshima by GCOM-C
For infrared monitoring, JAXA is using the results of observations not only by GCOM-C, but also by the Compact Infrared Camera for Earth Observation (CIRC) onboard ALOS-2. We are also developing the “Volcano monitoring system” as a system for early detection of changes in volcanic activity. We are monitoring active volcanoes based on thermal infrared and visual images from GCOM-C, CIRC, and JMA’s “Himawari”.
・Read more detailed:
Volcano monitoring system
Compact Infrared Camera for Earth Observation (CIRC)


Stay Connected
