The satellites observe aerosols, greenhouse gases, water-cycle, precipitation and clouds, etc. We conduct the research to utilize these data.
Monitoring of Aerosols
Aerosols consist of air pollutants such as yellow dust, PM2.5, volcanic ash, forest fires, etc. affect human living environment by reducing visibility, sticking to cars, houses, and crops, and causing health problems. It is said that aerosols greatly influence on climate change since they have effect to reflect and absorb sunlight.
JAXA estimates the quantities and types of aerosols by using domestic and international satellite data in multiple way and provides obtained information to both research institutes and other users.
Also, we are conducting research development for incorporating measured satellite data into computer simulations of aerosol transport models (data assimilation) in accordance with external institutions. The aim of this effort is to create a common environmental information about when, where and how much aerosols like yellow dust and PM2.5 are coming.
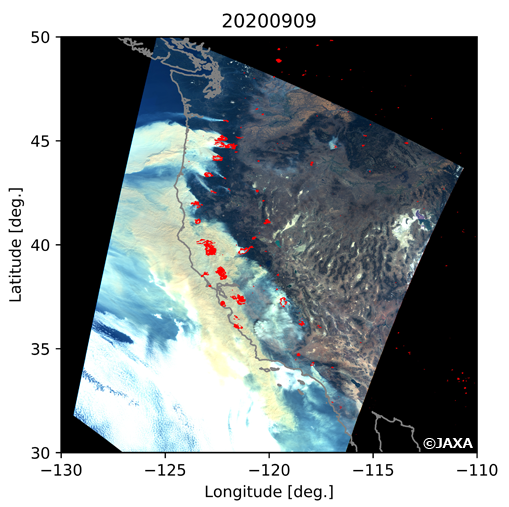
Visible image and the locations of forest fires (shown as red color) in the west coast of USA on September 9, 2020 observed by “SHIKISAI” (GCOM-C). We can see large amount of yellowish smokes from forest fires are emitting to the Pacific Ocean side.
Observing Greenhouse Gases
JAXA has been observing greenhouse gases (carbon dioxide (CO2) and methane (CH4)) using earth observation satellites of the Greenhouse Gases Observing Mission in cooperation with the Ministry of the Environment (MOE) and the National Institute for Environmental Studies (NIES)
Greenhouse Gases Observing Satellite “IBUKI” (GOSAT) launched in January 2009 has been observing decadal scale change of global CO2 and CH4. CO2 concentration of the Earth’s atmosphere consists of the balance between emission by fossil-fuel consumption and absorption by photosynthesis. Since amount of activity of photosynthesis is influenced by seasons, CO2 concentration is always changing depending on seasons and regions. In average, it is clear that CO2 concentration in global atmosphere is increasing year by year. In December 2015, the monthly average concentration of CO2 in the whole global atmosphere exceeded 400 ppm for the first time, recording 400.2 ppm.
Currently, Greenhouse Gases Observing Satellite “IBUKI-2” (GOSAT-2) launched in October 2018 is also in operation. In addition, Global Observing SATellite for Greenhouse gases and Water cycle (GOSAT-GW) is scheduled to be launched in JFY 2023.
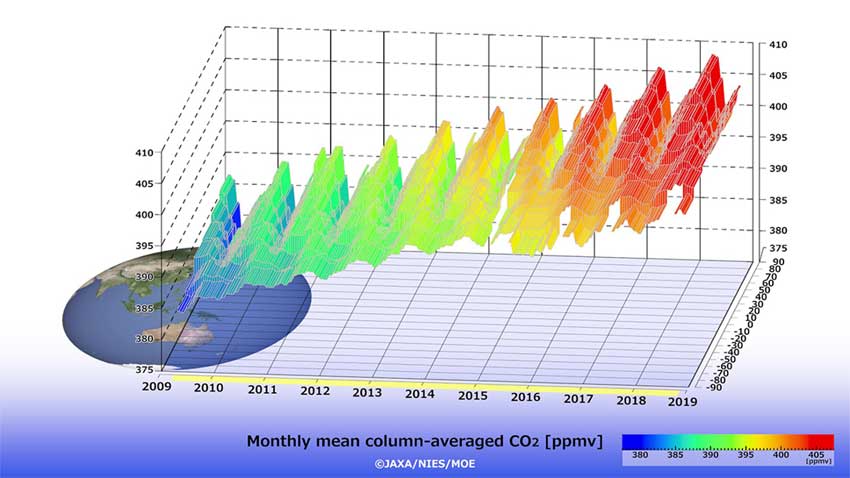
Monthly mean column-averaged CO2
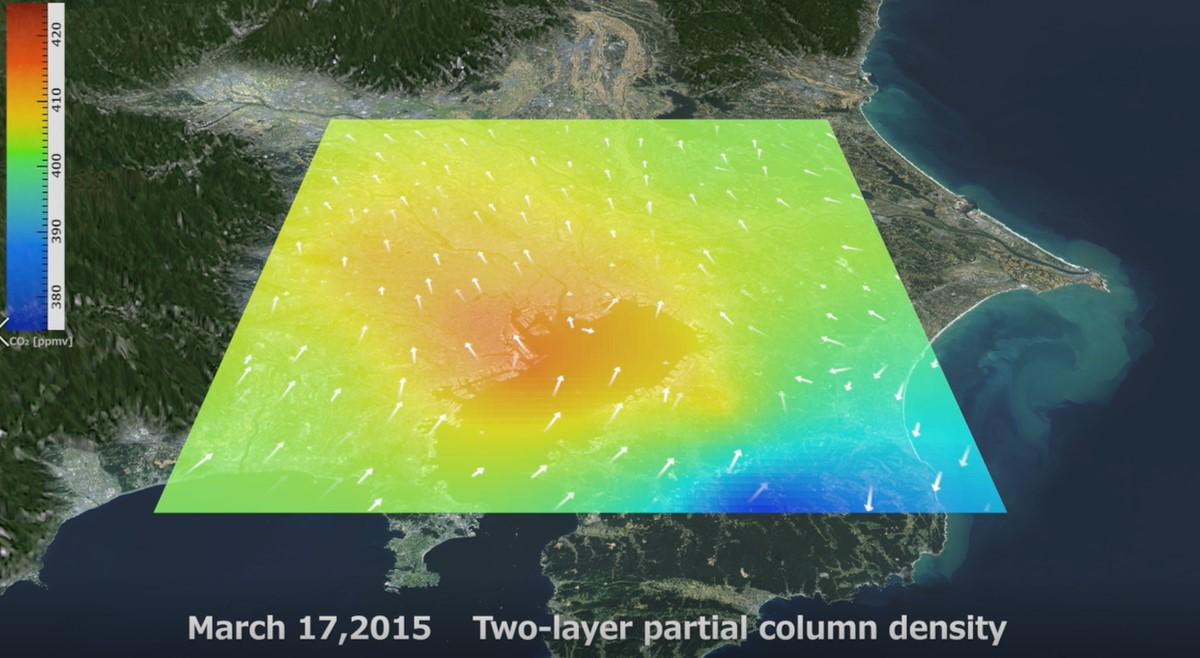
CO2 concentrations in the lower atmosphere of the Kanto region as observed by GOSAT on March 17, 2015
Observing the Water Cycle, Rain and Clouds
Extreme phenomena such as heavy rains and droughts due to climate change happen frequently in recent years and it is important to clarify water cycle in global scale.
JAXA has developed Global Satellite Mapping of Precipitation (GSMaP) by utilizing multiple satellites and provide data through website. The combination of the data from the Dual-frequency Precipitation Radar (DPR) onboard the Global Precipitation Measurement (GPM) core satellite as a basis, microwave radiometric data from the Global Change Observation Mission – Water “SHIZUKU” (GCOM-W) and the data from geostationary orbit satellite makes it possible to provide precipitation data with high accuracy and high resolution in near real-time.
Especially, in countries and regions where ground-based observation such as precipitation radar etc. are not sufficient, precipitation information like GSMaP is greatly useful. Furthermore, the utilization of satellite data is expanding in other fields such as disaster and agriculture as well as regular use of satellite data is increasing among several operational organizations and businesses.
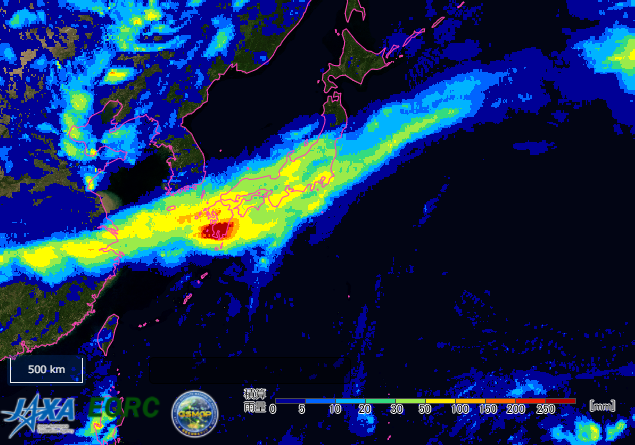
Observation of heavy rainfall in July 2020 by Global Satellite Mapping of Precipitation (GSMaP)
(24 hour accumulated precipitation at 17:00 in July 2020)