Changes in Automobile Shipping (Japan - North America) (update)
Last Update: 2020/09/03Information
2020/09/03: Observation results were updated : added the results from June 1st to June 18th 2020. Major updates are underlined.
2020/06/25: This article was released. The first edition article.
Overview
JAXA analyzed the track of cargo ships on the Japan-North America route based on the data obtained from the satellite AIS (Automatic identification system) experiments (SPAISE1, SPAISE2). It was confirmed that many ships (mainly pure car carriers) have remained in the Japanese coastal area (Pacific side) in 2020.
Example of a staying vessel track (Animation)
(staying around Japan and far away from Japan, Staying period: 20-30 March, 6-18 June 2020)
(Please see the Figure 5 for details)
Observation Results
JAXA analyzed the tracks of cargo ships on the Japan-North America route (February - June, 2019 and February - June, 2020 (up to June 18 in both 2019 and 2020)) based on the data obtained by JAXA's space based AIS experiments (SPAISE1, SPAISE2). Compared to the number of vessels in 2019, more vessels were found in the coastal area of Japan (Pacific side) in 2020. The number of pure car carriers remained at sea for long periods of time (more than 12 days) was only two in 2019, but 34 were identified in 2020. Therefore, we focused our analysis on pure car carriers.
AIS signals transmitting position information from vessels are communicated between vessels, and between ground stations installed at the coast and vessels. Receiving AIS signals by satellites allows us to detect the movement of vessels on the ocean away from the coast.
Analysis Results
It has been pointed out that the trade has fallen due to the economic recession caused by COVID-19. Therefore, in order to see changes in the trade status with foreign countries by shipping logistics, we confirmed the navigation status between Japan and North America in the North Pacific using JAXA’s AIS (SPAISE1, SPAISE2) data.
Table 1 shows the total number of cargo ships observed between Japan and North America and the number of pure car carriers stayed for 5 days or more, in the North Pacific between March-June 2019 and March-June 2020 (up to June 18 in both 2019 and 2020). (Vessels that stayed for more than 5 days are hereinafter treated as a staying vessel. Pure car carriers are identified by combining AIS information and public information. When the same vessel stayed more than once between March and June (when the stay was terminated due to port calls, etc.), each stay is counted.
The total number of cargo ships between Japan and North America decreased in 2020 compared to 2019. At the same time, the number of pure car carriers staying at sea for five days or more is higher. Compared to the 12 vessels in 2019, the number in 2020 is the 46 vessels, which is about four times as many. In addition, the number of pure car carriers that stayed at sea for 12 days or more significantly increased to the 34 vessels in 2020, compared to the 2 vessels in 2019.
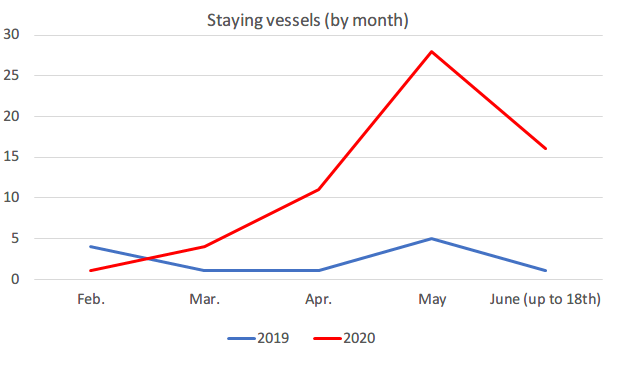
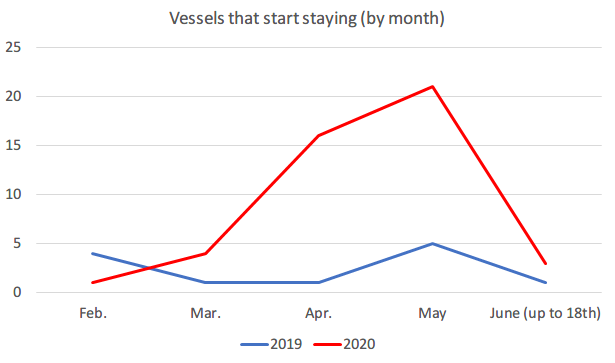
Figure 1 shows the number of pure car carriers staying more than 5 days and the number of pure car carriers that start staying and terminate staying in February-June 2019 and February-June 2020, by month. Vessels staying over multiple months are counted as the number of vessels staying for 5 days or more in each month. In 2019, there is not much change by month. But in 2020, the number of vessels staying in 2020 increased sharply, especially after April. The number of vessels staying in May was 28, which we can see that many vessels were staying. Although the analyzed period in June was short, the number of vessels that start staying is decreasing exceed the average ratio. However, 11 vessels were still staying as of June 18.
Car factories around the world including Japan have undertaken production adjustments since April. Since the number of vehicles to be transported by ship has decreased, it is presumed to adjust the holding time by shipping on the ocean. Moreover, one more reason is also presumed, including the difficulty to secure crew and dock workers due to restrictions on the movement of people (embark/disembark and crossing borders) during COVID-19.
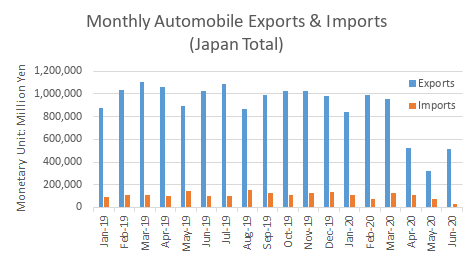
Reference 1 shows Trends in Automobile Trade for the Port of Nagoya, Japan's largest automobile export, the Port of Mikawa, Japan's second-largest automobile export and largest import port (see Reference 2 for locations of both ports) and total amount of all Japanese Ports. There was a noticeable decline in the value of exports in April and May 2020, particularly in May 2020, which was less than half the value of exports in May 2019. The Baltic Dry Index, one of the leading shipping markets (Reference 3) also indicates low in 2020.
On the other hand, in June, the value of exports from the Port of Nagoya recovered to 1.5 times that of May. Although the analysis results up to June 18 shows the decrease in the number of vessels to start staying, we expect to see a further recovery in the second half of June, such as a decrease in the number of staying pure car carriers. The next analysis will be performed for the period from June 19 to the end of July and this page will be updated.
| All Cargo Ships | Staying Pure Car Carriers (more than 5 days) |
Staying Pure Car Carriers (more than 12 days) |
|
|---|---|---|---|
| 2019 | 916 | 12 | 2 |
| 2020 | 823 | 46 | 34 |
b)
c)
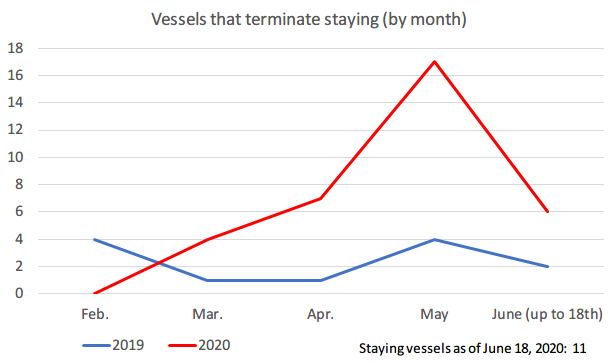
Figure 1. The number of staying pure car carrier for more than 5 days in February -June 2019 and 2020
(a) Staying vessels (by month)
(b) Vessels that start staying (by month)
(c) Vessels that terminate staying (by month)
(When the same vessels stayed more than once, each stay is counted.)
Examples of route map of vessels (1 plot / day)
The followings are representative examples of vessels that have remained at sea near Japan for more than five days, and show their tracks for each vessel. Figure 2 shows vessels that are close to land and remain in a small area. Such vessels were seen not only in 2020, but also in 2019. Regardless of the impact of COVID-19, it appears that there are some cases of staying for more than 5 days to enter the port.
On the other hand, in 2020, as shown in Figure 3, a vessel drifted over a wide area for more than a month at a distance from land. As shown in Figure 4, a vessel stayed far away from Japan in the ocean. In addition, as shown in Figure 5, the same vessel stayed twice for more than a month. Adding of AIS data in June makes us to see more prominently the vessels that staying on the ocean as shown in Fig. 3 and Fig. 5. For pure car carriers, such long-term staying and staying far from the Japanese coast were hardly observed in 2019, and such staying seems to be characteristics for 2020. The ability to detect staying vessels far from land is a key feature of AIS signal reception by satellite.
Analysis of observation data from JAXA's radar satellite (Advanced Land Observing Satellite (ALOS-2)) shows that the number of vehicles and containers at the Port of Nagoya has been decreasing. (Details)
We would like to observe the navigation status in this area until we can recover from the effects of COVID-19.
Figure 2. Example of a staying vessel track (in a narrow area near Japan, Staying period: 9-15 February 2019) (Animation)
Figure 3. Example of a staying vessel track (Animation)
(drifting over a wide area at a distance from land, Staying period: 10 May -18 June 2020)
Figure 4. Example of a staying vessel track (Animation)
(in wide area on the ocean far away from Japan in the ocean, Staying period: 29 April -14 May 2020)
Figure 5. Example of a staying vessel track (Animation)
(staying around Japan and far away from Japan, Staying period: 20-30 March, 6-18 June 2020)
Reference 1
Trends in Automobile Trade (Prepared by JAXA based on information provided by Nagoya Customs). The data for 2019 is defined value, the data for Jan-May is revised value and the data for June 2020 is preliminary value).
Port of Nagoya – The largest Automobile export port in Japan (From 2019 to June 2020)
Port of Mikawa – The largest Automobile import and the second-largest Automobile export port
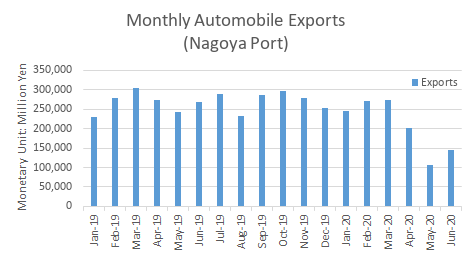
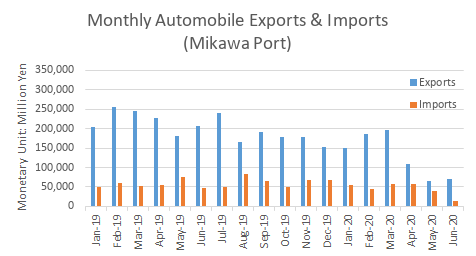
Export value in April and May 2020 is decreasing remarkably, but it recovers in June.
Reference 2
Please refer to the following website for the locations of Port of Nagoya and Port of Mikawa.
Ports in Aichi Prefecture (Aichi Prefecture Official Website; in Japanese)
Reference 3
Trend of Baltic Dry Index (Japan Maritime Center; in Japanese)
Baltic Dry Index (BDI): General indicator of shipping rate for bulkers calculated by the Baltic Exchange in England. First published on Jan 4, 1985 at 1,000 points.
What is Automatic identification system (AIS) ?
http://www.imo.org/en/OurWork/Safety/Navigation/Pages/AIS.aspx (International Maritime Organization)
The AIS signal contains dynamic information such as vessel position, time, bow heading, and ground speed, as well as static information such as vessel number and vessel name, vessel length and type.
The AIS receiver station (ground station) installed on land can only receive the vessel AIS signal within a range of about 100 km from the coast. But the AIS receiver installed on the satellite can receive the vessel AIS with a range of about 5,000 km from the satellite. Therefore, it is possible to obtain vessel information in a wide range of ocean.
Introduction of SPAISE (Space-based Automatic Identification System) (in Japanese)
Analysis method
In this analysis, SPAISE1 and SPAISE2 are used to create a ship location plot (track maps) per day for each ship, and staying ships and their staying days are visually determined. Consequently, there are some errors.
The plots of days when the AIS signal could not be received are not included in the figure. The staying period is counted from the first reception date to the last reception date when the ship is determined to stay on the ocean. Even if there is a day that AIS signal was not received, ships clearly judged not to call at the port are included in the stay period.
Difference of Ground station and Satellite station.
In coastal areas including ports, many vessels emit AIS signals, which makes it difficult to separate and analyze signals received by satellites. Therefore, it is effective to analyze by combining AIS signals from the coast received by the ground stations and AIS signals from the offshore received by the satellite station.
Since JAXA does not receive AIS signals from ground stations, only AIS signals received from the satellite station are used for our analysis. In this analysis, the vessel tracks near the coast including the ports are not accurate. Therefore, only staying ships on the ocean far away the coast are introduced.