Changes in the ports (container terminals) before and after COVID-19 pandemic
Last Update: 2026/04/16Information
2026/04/16:Observation results for the Port of Nagoya were updated : Updated observation results up to the February 2026 (Fig. 1-3 and Fig. 1-4).
2025/04/08:Observation results for the Port of Nagoya were updated : Updated observation results up to the January 2025 (Fig. 1-3).
2024/04/04:Observation results for the Port of Nagoya were updated : Updated observation results up to the January 2024 (Fig. 1-3).
2023/03/13:Observation results for the Port of Nagoya were updated : Updated observation results up to the February 2023 (Fig. 1-3).
2022/02/18:Observation results for the Port of Nagoya were updated : Updated observation results up to the January 2022 (Fig. 1-3).
2021/03/18:Observation results for the Port of Nagoya were updated : Updated observation results up to the February 2021 (Fig. 1-3).
2020/12/23: Observation results for the Port of Nagoya were updated : Updated observation results up to the first half of October 2020 (Fig. 1-3).
2020/08/25: Observation results for the Port of Nagoya were updated : added the results until the first half of August 2020 (Fig 1-3).
2020/07/20: Observation results were added.
2020/06/25: This article was released.
Overview
Synthetic Aperture Radar (SAR) can be used to observe the earth's surface day and night in all weather conditions. The combination of PALSAR-2, JAXA's L-band SAR onboard ALOS-2 and C-band SAR onboard European Sentinel allows us to observe the conditions of containers, vehicles, etc. at container terminals. Here, the changes of containers, vehicles, etc. in the container terminals at the Port of Nagoya and the Port of Mikawa (Toyohashi) in Aichi Prefecture are shown under COVID-19 pandemic. Both of the ports have a high volume of imports and exports in Japan.
Observation and Analysis Results (the Port of Nagoya)
The Port of Nagoya has continued to grow in importance for trade since it opened in 1907. The amount of cargo handled at the Port of Nagoya was 197 million tons in 2018, the number one in Japan. In addition, about 1.4 million completed vehicles are exported from the Port of Nagoya, which is also Japan's number one.
JAXA observed changes in container and car parking at the Shimpomachi container terminal using the Land Observing Satellite-2 (ALOS-2: Daichi 2) observation data from the end of November 2019 to June 2020. It was observed that the number of containers and vehicles decreased during COVID-19 pandemic period.
Fig 1-1 shows the difference in the Shimpomachi container terminal between November 2019 (blue) and May 2020 (red). The red color indicates that some objects were existed only in May 2020 in the location. The blue color indicates that some objects were existed only in November 2019 in the location. There are a lot of blue color in the container terminal. It is means that there are no containers in May 2020 in spite of there were many containers in November 2019.
In addition, Fig 1-2 shows car container density change in a time series animation from November 2019 to June 2020 using data by ALOS-2. It shows the change in the quantity of containers and cars were changed.
Fig 1-3 shows the density of car containers in the ALOS-2 and Sentinel-1 image since the end of November 2019 to February 2026. We found several up and down trends in analyzed value from the satellite imageries since the first state of emergency was declared in April 2020. In 2022, sales were almost flat due to tight supply and demand for semiconductors due to the spread of the new coronavirus, but in 2023, due to the rebound, sales exceeded the previous year's results throughout the year. Although sales in fiscal year 2024 did not exceed the previous year's performance, sales in fiscal year 2025 exceeded the previous year’s performance for the first time in two years.
Figures 1-4 show the time series changes in car exports from Nagoya Port by Nagoya Customs since November 2019. Comparing the 2025 data with Figures 1-3, the car and container density in ALOS-2 shows peaks in February, April, June, and October. Similarly, the car export performance at Nagoya Port in Figure 1-4 also shows peaks in February-March, June-July, and October, confirming that the trends in both figures are roughly consistent.
Comparing the increase and decrease of the analyzed values in the chart with social, economic, and trades situations, the periods of the decrease trends were close to the timings of the state of emergency and production adjustment of a car factory due to shortage of parts supply. In 2025, following 2024, a steady recovery from the decline in demand due to the impact of the new coronavirus was confirmed.
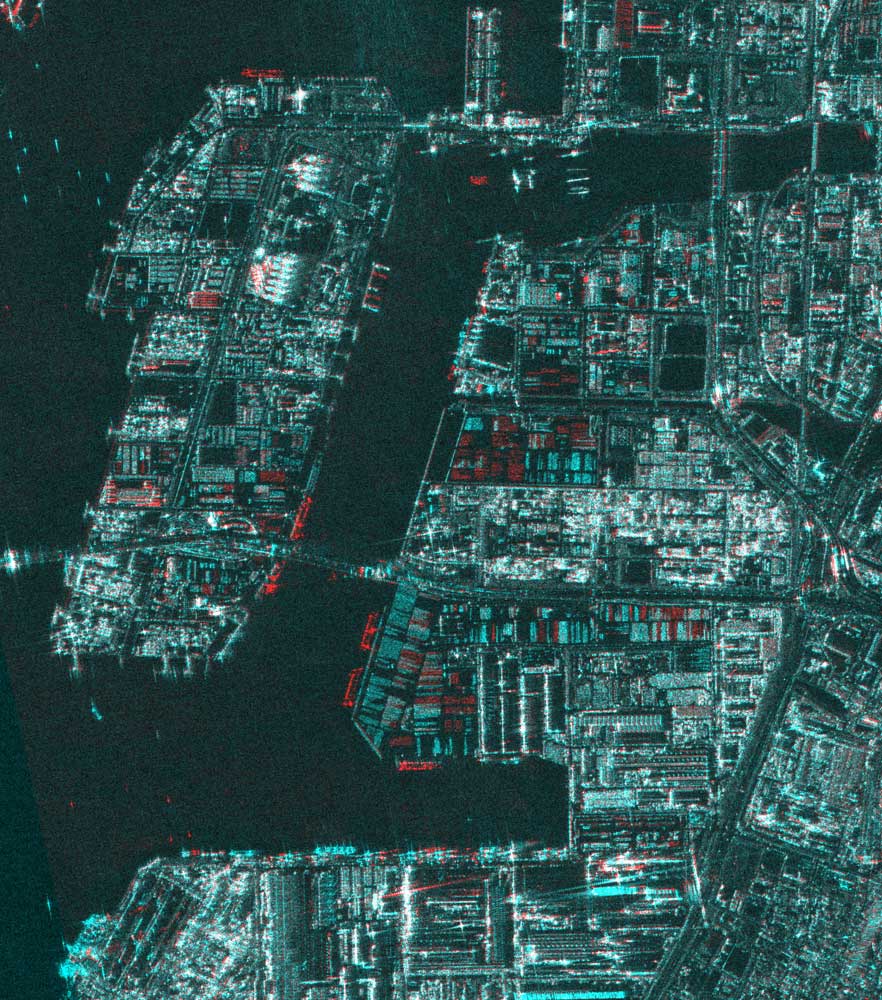
Fig 1-1: ALOS-2 3-meter composite color image at Shimpomachi, the Port of Nagoya (red color: May 8, 2020 and blue color: Nov. 27, 2019).
Fig 1-2: ALOS-2 time series data from November 2019 to June 2020
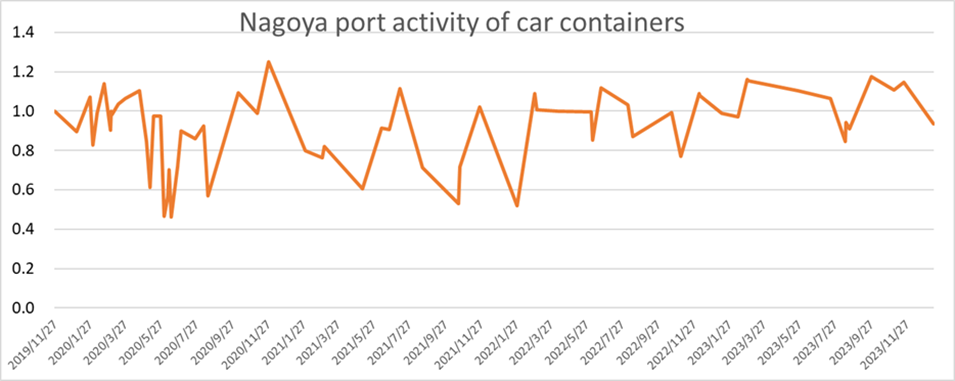
Fig 1-3: The car container density change in Shimpomachi in the Port of Nagoya. (The vertical axis shows the ratio with the initial value on 27 November 2019.)
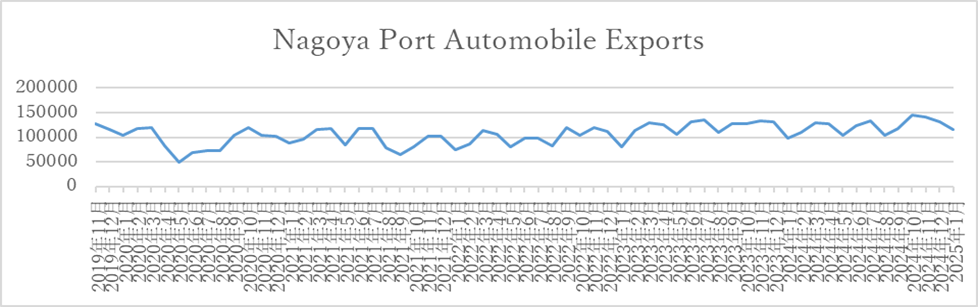
Fig 1-4: Nagoya Customs Automobile Export Statistics
Observation and Analysis Results (the Port of Toyohashi)
Fig 2-1 shows the difference in the Jinnofuto of the Port of Toyohashi between January 2020 (blue) and May 2020 (red).
Fig 2-2 shows the changes in cars and containers at the Port of Toyohashi. The total number of cars and containers at the Port of Toyohashi does not seem to change significantly.
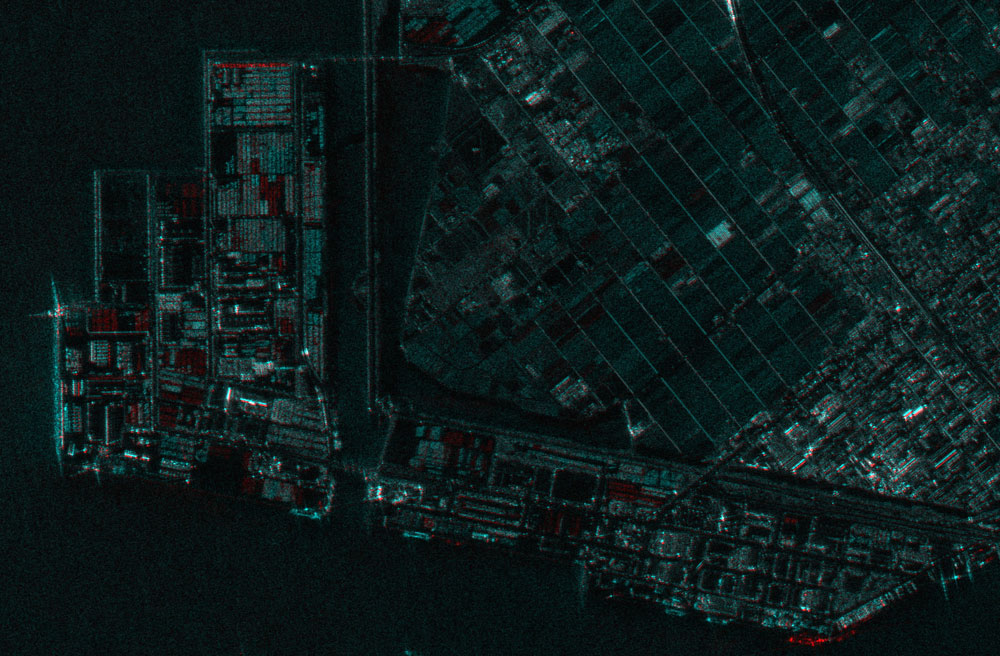
Fig 2-1: ALOS-2 3-meter composite color image at Jinnofuto , the Port of Toyohashi (red color: May 8, 2020 and blue color: Jan. 31, 2020).
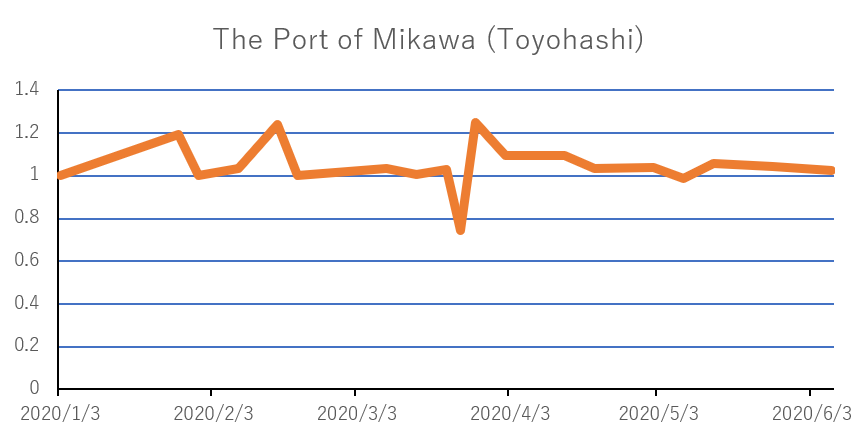
Fig 2-2: The car container density change in the Port of Toyohashi. (The vertical axis is the ratio with the standard day being 1)
Download
Terms of use is applied to the data for download.