Changes seen in the airports before and after COVID-19 pandemic
Last Update: 2020/12/25Information
2020/12/25: Added observation results regarding changes in the number of vehicles in pay parking lots.
2020/09/11: Observation results of the Chateauroux Centre Marcel Dassault Airport (CHR) in France, the Bournemouth Airport (BOH) in the United Kingdom, and the Shivaji International Airport (BOM) in India were updated. Details...
2020/07/20: Observation results of some Japanese airports were added. Details...
2020/06/25: This article was released.
Overview
Synthetic Aperture Radar (SAR) can be used to observe the earth's surface day and night in all weather conditions. The combination of PALSAR-2, JAXA's L-band SAR onboard ALOS-2 and C-band SAR onboard European Sentinel allows us to observe the conditions of airplanes, especially changes in the main hub tarmac in the world before and after the COVID-19 pandemic. From the same data, we can confirm the changes in the parking lot adjacent to the airfield before and after COVID-19 pandemic.
For the areas with clear sky, the European optical satellite, Sentinel 2 has been utilized.
Observation and Analysis Results
Past observation data, such as 2019 and 2020 data for Japan, Asia Pacific, the United States, Europe and other regions have been compared, and the changes in COVID-19 pandemic on airplanes at airports, parked cars, etc. have also been observed. By making color-synthesized data from ALOS-2 and European Sentinel 1 SAR data or time-series animations, the changes can be visualized.
Regarding the data presented here, the data after 2020 COVID-19 pandemic are shown as red and the past data like 2019 etc. are shown as blue and green. Therefore, the spots which brightly observed only in the year 2020 are seen red, and the spots which brightly observed only in the year 2019 have are seen blue-green. (Assigned colors are different depending on each image. See the explanation of each figures for the details.)
There are differences depend on airports, but generally on the tarmac and elsewhere, you can see increase in the amount of red color that appears after COVID-19 pandemic in 2020. Conversely, airport gates are often blue, and there were no planes at the gate, in other words, the planes were not being operated. Similarly, the parking lots adjacent to the airfield are much blue, and there were more parking in 2020 than in 2019. The number of parking cars has also decreased.
Some airlines were moving planes to different airports to store and maintain them. In case of Birmingham-Shuttlesworth international Airport (BHM) in the United States, Australia's Alice Springs Airport (ASP), Chateauroux Centre Marcel Dassault Airport (CHR), Bournemouth Airport (BOH) in the UK, etc., the number of planes has increased in 2020.
For Alice Springs Airport (ASP), a similar comparison was made using the European optical satellite, Sentinel 2 with the continued sunny weather. The optical image shows that the aircraft can be distinguished from the rest of the aircraft at a glance, and the number of aircraft on the tarmac has increased.
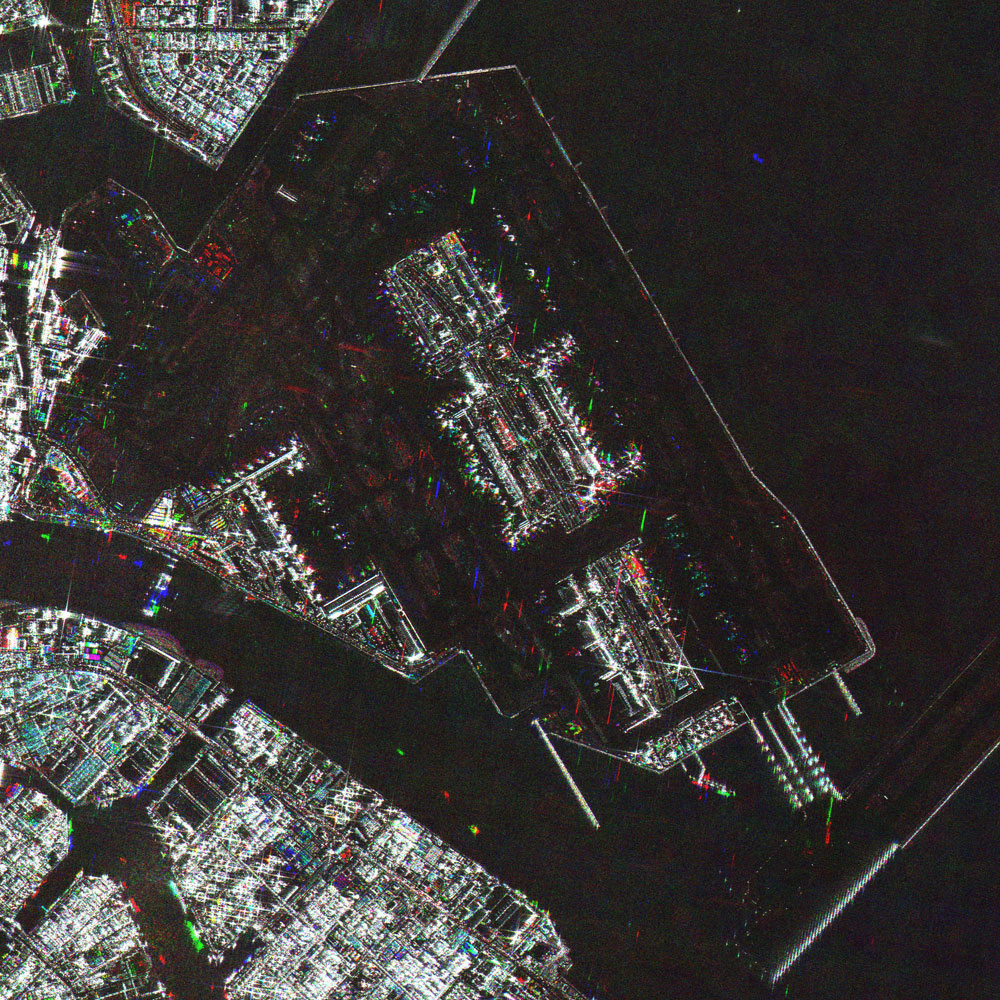
Fig 1-1: ALOS-2 observed color composite image of Tokyo International Airport, Haneda on Nov. 28, 2019 assigned as red color, Mar. 19, 2020 as green, and May 14, 2020 as blue, respectively
(Red, green, or cyan colored pixels in parking areas show airplanes on March and May 2020)
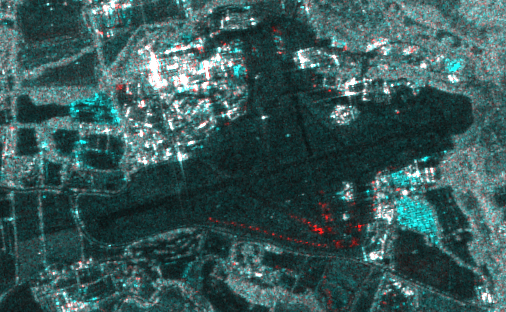
Fig 1-2: ALOS-2 observation images of Bournemouth Airport (BOH) on May 22, 2019 (Green and Blue) and May 20, 2020 (Red)
(In 2020, the number of aircraft parked was increased in the red area)
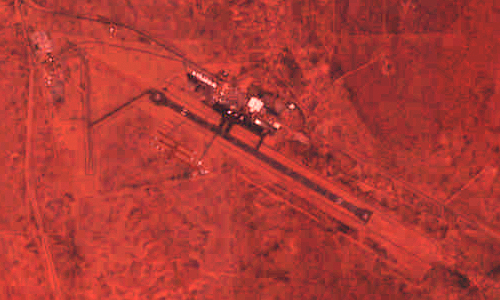
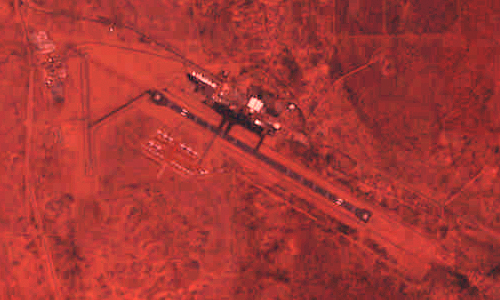
Fig 1-3: Alice Springs Airport (ASP) images observed by Sentinel 2 on March 9, 2020 and May 28, 2020
(The image below shows increasing of the number of parked aircraft)
Observation and Analysis Result(Changes in the number of vehicles in pay parking lots)
Indicator provided by: JAXA based on data provided by JAXA, ESA and NASA
Satellite imagery from three international space agencies has quantified the decline in traffic at Los Angeles International Airport (LAX) since COVID-19 slowdowns began, specifically noting both the lower number of cars in the pay parking lot and the consistency of these numbers throughout the day.
As recently as April, imagery from NASA, JAXA and ESA showed significant fluctuations in the number of cars in the lot at different times of day. This pattern aligns with what would be expected with travelers flying at various times throughout the week and during the winter holidays. Since pandemic safety restrictions brought travel to a near-standstill, however, the consistency of parked cars indicates that fewer cars are moving in and out of the lots nearby the airport.
The report from LAX is part of an effort by NASA, JAXA and ESA to help quantify changes at airports and other transportation hubs around the world caused by lockdowns designed to prevent the spread of the novel coronavirus. Scientists are combining two kinds of space-based remote sensing data – synthetic aperture radar (SAR) data from JAXA’s ALOS-2 and ESA’s Copernicus Sentinel-1 satellites, with NASA-processed high-resolution optical remote sensing data from Planet’s SkySat. Planet provides data to NASA as part of the agency’s Commercial SmallSat Data Acquisition Program.
Combining these datasets enables production of more comprehensive assessment of changes in patterns in the airport parking lots. While Planet imagery can be used to monitor changes in the number of cars in these lots and around the world every day, its camera like sensors cannot see through clouds, therefore limiting our ability to track changes on cloudy or rainy days. The radar systems on the Sentinel-1 and ALOS-2SAR satellites penetrate through clouds and rain, as well as making observations both during the day and at night. This capability makes it possible to track changes in activity, such as parking patterns, every time a SAR satellite is over the region – a few times a week. The combined datasets make it possible to better track changes in human activity related to the COVID-19 than with a single satellite system.
The time series trend graph of car density in the parking area at LAX shown in Fig 2-1 tracks the total number of cars during December 2019 and September 2020.
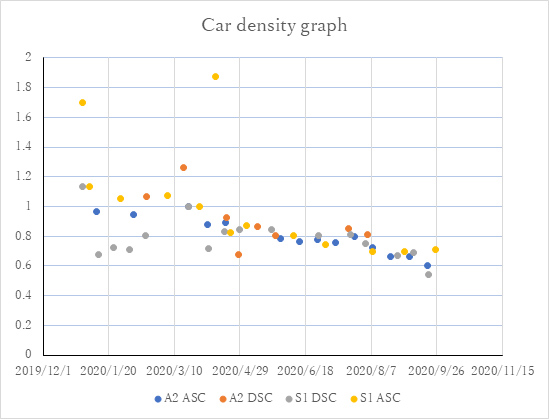
Fig 2-1. Car density graph during December 2019 and September 2020.
In April, as the effects of California’s earlier pandemic-related lockdowns were just taking hold, ALOS-2 and Sentinel-1 recorded variations in the number of cars parked at LAX. This was largely due to the 6-hour time differences between observations between ALOS-2 and Sentinel-1. Sentinel-1 passes over LAX at 6 a.m. and 6 p.m. (PST), and ALOS-2 at noon and midnight (PST). Since then, however, the variation in the number of cars between observations for both satellites has stabilized, indicating both fewer cars overall and fewer cars leaving and entering the parking area.
Figure 2-2 shows a color composited SAR image of LAX from the PALSAR-2 instrument aboard the ALOS-2 satellite. The different colors in the image correspond to the different dates the images were captured. The blue/green area shows cars parked in the pay lots on Jan. 11, before the pandemic restrictions. Red areas indicate fewer cars parked there on May 30. White areas are buildings.
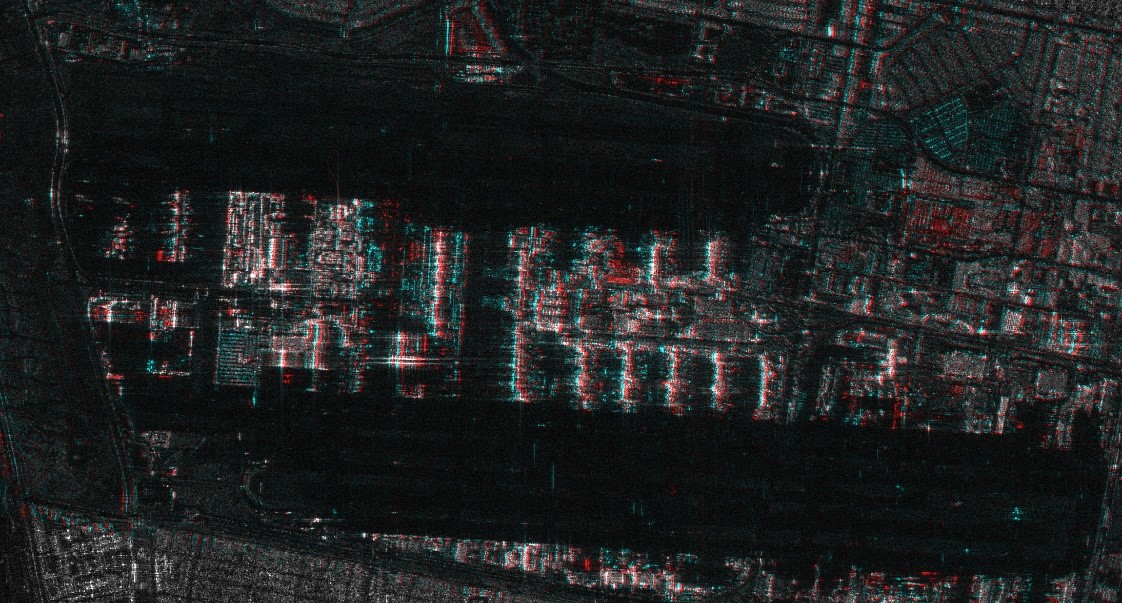
Fig 2-2. ALOS-2 LAX data.
Fig 2-3 and 2-4 show car detection in red using Planet’s SkySat imagery and Artificial Intelligence (AI). The first image shows a heavy concentration of cars in the parking lots in January, corresponding to the SARS image from ALOS-2. In the July image using Planet data, there are far fewer cars in the pay lots. The number of cars in the rental car lots remained high, indicating less demand for those vehicles.
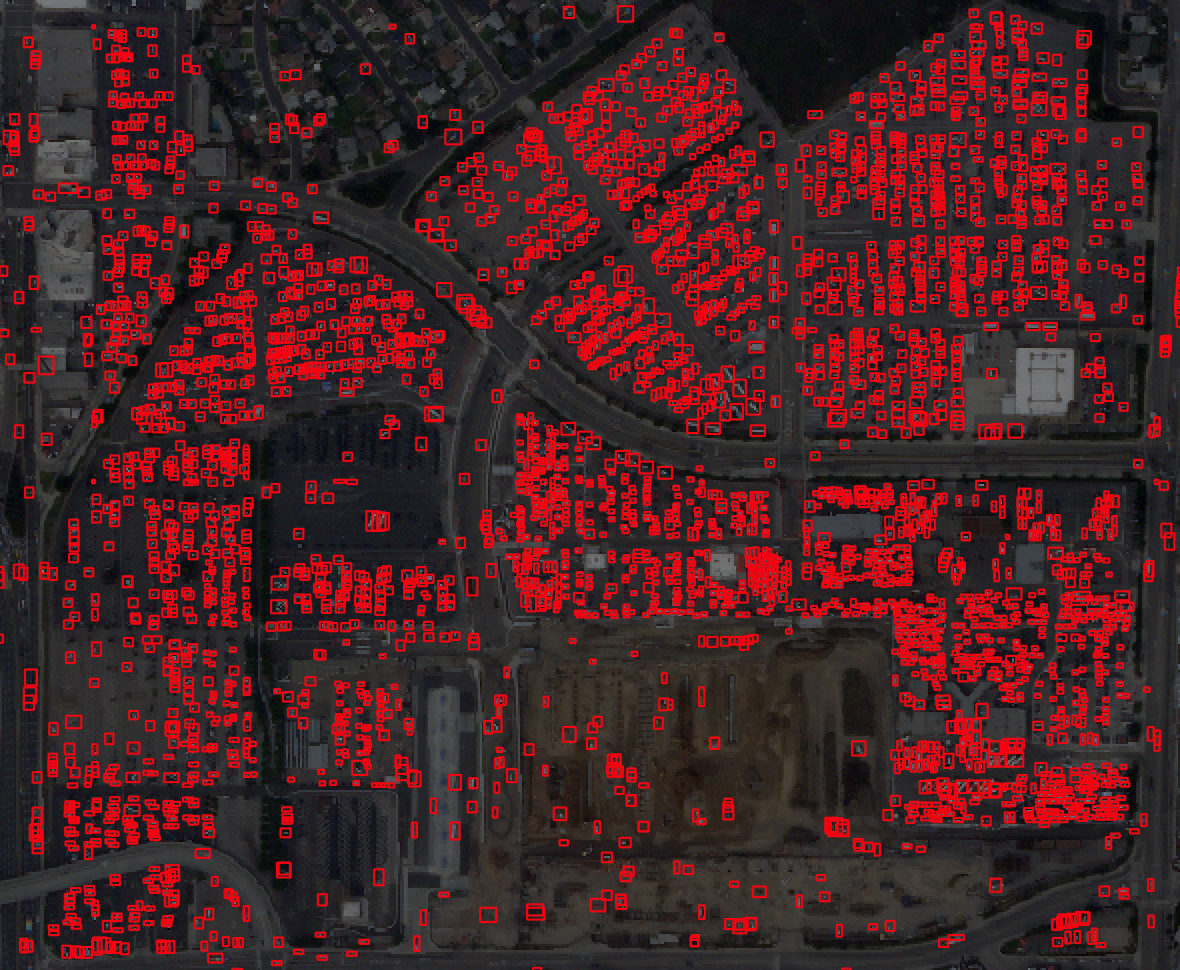
Fig 2-3 Car number estimation in January by Planet SkySat and AI
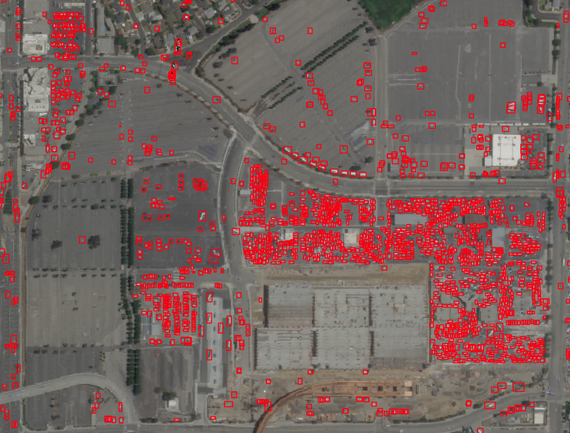
Fig 2-4 Car number estimation in July Planet SkySat and AI
Overall, Planet’s SkySat estimated 3,708 cars parked on Jan. 9, and 1,943 on July 8. This corresponds with SAR data from ALOS-2 and Sentinel-1.